
 Login Sign Up


| |||||
 |  | ||||

| 12Stocks.com Market Intelligence |
Best SmallCap Stocks
|
| In a hurry? Small Cap Stock Lists: Performance Trends Table, Stock Charts
Sort Small Cap stocks: Daily, Weekly, Year-to-Date, Market Cap & Trends. Filter Small Cap stocks list by sector: Show all, Tech, Finance, Energy, Staples, Retail, Industrial, Materials, Utilities and HealthCare Filter Small Cap stocks list by size: All Large Medium Small and MicroCap |
| 12Stocks.com Small Cap Stocks Performances & Trends Daily | |||||||||
|
|  The overall Smart Investing & Trading Score is 88 (0-bearish to 100-bullish) which puts Small Cap index in short term bullish trend. The Smart Investing & Trading Score from previous trading session is 70 and hence an improvement of trend.
| ||||||||
Here are the Smart Investing & Trading Scores of the most requested small cap stocks at 12Stocks.com (click stock name for detailed review):
|


| 12Stocks.com: Investing in Smallcap Index with Stocks | |
|
The following table helps investors and traders sort through current performance and trends (as measured by Smart Investing & Trading Score) of various
stocks in the Smallcap Index. Quick View: Move mouse or cursor over stock symbol (ticker) to view short-term technical chart and over stock name to view long term chart. Click on  to add stock symbol to your watchlist and to add stock symbol to your watchlist and  to view watchlist. Click on any ticker or stock name for detailed market intelligence report for that stock. to view watchlist. Click on any ticker or stock name for detailed market intelligence report for that stock. |
12Stocks.com Performance of Stocks in Smallcap Index
| Ticker | Stock Name | Watchlist | Category | Recent Price | Smart Investing & Trading Score | Change % | YTD Change% |
| ATRO | Astronics |   | Industrials | 18.91 | 54 | 0.11 | 8.55% |
| DBI | Designer Brands | | Services & Goods | 9.45 | 17 | 0.11 | 6.78% |
| IIIV | i3 Verticals | | Technology | 20.00 | 0 | 0.10 | -5.53% |
| TITN | Titan Machinery | | Services & Goods | 23.42 | 47 | 0.09 | -18.91% |
| FMNB | Farmers National | | Financials | 12.49 | 32 | 0.08 | -13.56% |
| CPS | Cooper-Standard | | Consumer Staples | 14.72 | 58 | 0.07 | -24.67% |
| MCB | Metropolitan Bank | | Financials | 42.80 | 83 | 0.07 | -22.72% |
| FC | Franklin Covey | | Services & Goods | 38.64 | 53 | 0.05 | -11.23% |
| VCEL | Vericel | | Health Care | 48.54 | 83 | 0.04 | 36.31% |
| FMAO | Farmers & Merchants Bancorp | | Financials | 22.54 | 100 | 0.04 | -9.11% |
| PEBO | Peoples Bancorp | | Financials | 30.41 | 76 | 0.03 | -9.92% |
| MBWM | Mercantile Bank | | Financials | 39.02 | 68 | 0.03 | -3.37% |
| FRPH | FRP | | Financials | 30.02 | 15 | 0.02 | -52.25% |
| BZH | Beazer Homes | | Industrials | 28.30 | 24 | 0.00 | -16.25% |
| CSV | Carriage Services | | Services & Goods | 26.54 | 88 | 0.00 | 6.12% |
| NC | NACCO Industries | | Consumer Staples | 31.34 | 42 | 0.00 | -14.14% |
| HAYN | Haynes | | Industrials | 59.18 | 31 | 0.00 | 3.73% |
| IMRX | Immuneering | | Health Care | 1.59 | 30 | 0.00 | -79.05% |
| ORC | Orchid Island | | Financials | 8.58 | 60 | 0.00 | 1.78% |
| ASIX | AdvanSix | | Materials | 25.04 | 59 | 0.00 | -16.42% |
| DOUG | Douglas Elliman | | Financials | 1.12 | 20 | 0.00 | -61.77% |
| VAXX | Vaxxinity | | Health Care | 0.05 | 0 | 0.00 | -94.29% |
| VPG | Vishay Precision | | Technology | 31.51 | 10 | -0.03 | -7.51% |
| GCO | Genesco | | Services & Goods | 26.66 | 67 | -0.04 | -24.28% |
| FBMS | First Bancshares | | Financials | 25.50 | 76 | -0.04 | -13.06% |
| For chart view version of above stock list: Chart View ➞ 0 - 25 , 25 - 50 , 50 - 75 , 75 - 100 , 100 - 125 , 125 - 150 , 150 - 175 , 175 - 200 , 200 - 225 , 225 - 250 , 250 - 275 , 275 - 300 , 300 - 325 , 325 - 350 , 350 - 375 , 375 - 400 , 400 - 425 , 425 - 450 , 450 - 475 , 475 - 500 , 500 - 525 | ||
 | Click To Change The Sort Order: By Market Cap or Company Size Performance: Year-to-date, Week and Day |  |
| Too many stocks? View smallcap stocks filtered by marketcap & sector |
| Marketcap: All SmallCap Stocks (default-no microcap), Large, Mid-Range, Small |
| Smallcap Sector: Tech, Finance, Energy, Staples, Retail, Industrial, Materials, & Medical |
|
Get the most comprehensive stock market coverage daily at 12Stocks.com ➞ Best Stocks Today ➞ Best Stocks Weekly ➞ Best Stocks Year-to-Date ➞ Best Stocks Trends ➞  Best Stocks Today 12Stocks.com Best Nasdaq Stocks ➞ Best S&P 500 Stocks ➞ Best Tech Stocks ➞ Best Biotech Stocks ➞ |
| Detailed Overview of SmallCap Stocks |
| SmallCap Technical Overview, Leaders & Laggards, Top SmallCap ETF Funds & Detailed SmallCap Stocks List, Charts, Trends & More |
| Smallcap: Technical Analysis, Trends & YTD Performance | |
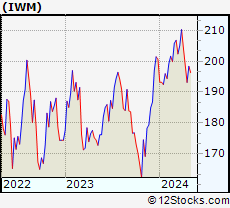
| SmallCap segment as represented by
IWM, an exchange-traded fund [ETF], holds basket of thousands of smallcap stocks from across all major sectors of the US stock market. The smallcap index (contains stocks like Riverbed & Sotheby's) is up by 3.06% and is currently underperforming the overall market by -6.31% year-to-date. Below is a quick view of technical charts and trends: | |
 IWM Weekly Chart |
|
| Long Term Trend: Very Good | |
| Medium Term Trend: Very Good | |
 IWM Daily Chart |
|
| Short Term Trend: Very Good | |
| Overall Trend Score: 88 | |
| YTD Performance: 3.06% | |
| **Trend Scores & Views Are Only For Educational Purposes And Not For Investing | |
| 12Stocks.com: Top Performing Small Cap Index Stocks | ||||||||||||||||||||||||||||||||||||||||||||||||
 The top performing Small Cap Index stocks year to date are
Now, more recently, over last week, the top performing Small Cap Index stocks on the move are


|
||||||||||||||||||||||||||||||||||||||||||||||||
| 12Stocks.com: Investing in Smallcap Index using Exchange Traded Funds | |
|
The following table shows list of key exchange traded funds (ETF) that
help investors track Smallcap index. The following list also includes leveraged ETF funds that track twice or thrice the daily returns of Smallcap indices. Short or inverse ETF funds move in the opposite direction to the index they track and are useful during market pullbacks or during bear markets. Quick View: Move mouse or cursor over ETF symbol (ticker) to view short-term technical chart and over ETF name to view long term chart. Click on ticker or stock name for detailed view. Click on to add stock symbol to your watchlist and to view watchlist. |
12Stocks.com List of ETFs that track Smallcap Index
| Ticker | ETF Name | Watchlist | Recent Price | Smart Investing & Trading Score | Change % | Week % | Year-to-date % |
| IWM | iShares Russell 2000 | | 206.86 | 88 | 1.04 | 1.25 | 3.06% |
| IJR | iShares Core S&P Small-Cap | | 110.40 | 95 | 1.00 | 1.3 | 1.99% |
| IWN | iShares Russell 2000 Value | | 157.81 | 88 | 0.97 | 1.04 | 1.6% |
| VTWO | Vanguard Russell 2000 ETF | | 83.50 | 70 | 0.89 | 1.06 | 2.96% |
| IWO | iShares Russell 2000 Growth | | 263.49 | 70 | 1.14 | 1.37 | 4.47% |
| IJS | iShares S&P Small-Cap 600 Value | | 102.21 | 100 | 1.25 | 1.68 | -0.83% |
| IJT | iShares S&P Small-Cap 600 Growth | | 130.72 | 83 | 0.58 | 0.66 | 4.46% |
| SMLV | SPDR SSGA US Small Cap Low Volatil ETF | | 111.65 | 76 | 0.22 | 0.39 | -0.77% |
| XSLV | PowerShares S&P SmallCap Low Volatil ETF | | 44.33 | 83 | -0.42 | 0.21 | 0.4% |
| SAA | ProShares Ultra SmallCap600 | | 24.98 | 90 | 1.50 | 2.59 | 0.12% |
| SBB | ProShares Short SmallCap600 | | 15.77 | 0 | -0.79 | -1.16 | -1% |
| SDD | ProShares UltraShort SmallCap600 | | 17.89 | 28 | -1.47 | -2.14 | -2.92% |
| 12Stocks.com: Charts, Trends, Fundamental Data and Performances of SmallCap Stocks | |
|
We now take in-depth look at all SmallCap stocks including charts, multi-period performances and overall trends (as measured by Smart Investing & Trading Score). One can sort SmallCap stocks (click link to choose) by Daily, Weekly and by Year-to-Date performances. Also, one can sort by size of the company or by market capitalization. |
| Select Your Default Chart Type: | |||||
| |||||
| Click on stock symbol or name for detailed view. Click on to add stock symbol to your watchlist and to view watchlist. Quick View: Move mouse or cursor over "Daily" to quickly view daily technical stock chart and over "Weekly" to view weekly technical stock chart. | |||||

 | ATRO Astronics Corporation |
| Sector: Industrials | |
| SubSector: Aerospace/Defense Products & Services | |
| MarketCap: 287.201 Millions | |
| Recent Price: 18.91 Smart Investing & Trading Score: 54 | |
| Day Percent Change: 0.11% Day Change: 0.02 | |
| Week Change: 2.38% Year-to-date Change: 8.6% | |
| ATRO Links: Profile News Message Board | |
| Charts:- Daily , Weekly | |
| Add ATRO to Watchlist: View: Get Complete ATRO Trend Analysis ➞ | |
 | DBI Designer Brands Inc. |
| Sector: Services & Goods | |
| SubSector: Apparel Stores | |
| MarketCap: 467.308 Millions | |
| Recent Price: 9.45 Smart Investing & Trading Score: 17 | |
| Day Percent Change: 0.11% Day Change: 0.01 | |
| Week Change: -1.25% Year-to-date Change: 6.8% | |
| DBI Links: Profile News Message Board | |
| Charts:- Daily , Weekly | |
| Add DBI to Watchlist: View: Get Complete DBI Trend Analysis ➞ | |
 | IIIV i3 Verticals, Inc. |
| Sector: Technology | |
| SubSector: Business Software & Services | |
| MarketCap: 448.458 Millions | |
| Recent Price: 20.00 Smart Investing & Trading Score: 0 | |
| Day Percent Change: 0.10% Day Change: 0.02 | |
| Week Change: -4.72% Year-to-date Change: -5.5% | |
| IIIV Links: Profile News Message Board | |
| Charts:- Daily , Weekly | |
| Add IIIV to Watchlist: View: Get Complete IIIV Trend Analysis ➞ | |
 | TITN Titan Machinery Inc. |
| Sector: Services & Goods | |
| SubSector: Industrial Equipment Wholesale | |
| MarketCap: 208.958 Millions | |
| Recent Price: 23.42 Smart Investing & Trading Score: 47 | |
| Day Percent Change: 0.09% Day Change: 0.02 | |
| Week Change: -1.76% Year-to-date Change: -18.9% | |
| TITN Links: Profile News Message Board | |
| Charts:- Daily , Weekly | |
| Add TITN to Watchlist: View: Get Complete TITN Trend Analysis ➞ | |
 | FMNB Farmers National Banc Corp. |
| Sector: Financials | |
| SubSector: Regional - Midwest Banks | |
| MarketCap: 366.57 Millions | |
| Recent Price: 12.49 Smart Investing & Trading Score: 32 | |
| Day Percent Change: 0.08% Day Change: 0.01 | |
| Week Change: -1.73% Year-to-date Change: -13.6% | |
| FMNB Links: Profile News Message Board | |
| Charts:- Daily , Weekly | |
| Add FMNB to Watchlist: View: Get Complete FMNB Trend Analysis ➞ | |
 | CPS Cooper-Standard Holdings Inc. |
| Sector: Consumer Staples | |
| SubSector: Auto Parts | |
| MarketCap: 184.339 Millions | |
| Recent Price: 14.72 Smart Investing & Trading Score: 58 | |
| Day Percent Change: 0.07% Day Change: 0.01 | |
| Week Change: 1.17% Year-to-date Change: -24.7% | |
| CPS Links: Profile News Message Board | |
| Charts:- Daily , Weekly | |
| Add CPS to Watchlist: View: Get Complete CPS Trend Analysis ➞ | |
 | MCB Metropolitan Bank Holding Corp. |
| Sector: Financials | |
| SubSector: Regional - Northeast Banks | |
| MarketCap: 212.999 Millions | |
| Recent Price: 42.80 Smart Investing & Trading Score: 83 | |
| Day Percent Change: 0.07% Day Change: 0.03 | |
| Week Change: 0.4% Year-to-date Change: -22.7% | |
| MCB Links: Profile News Message Board | |
| Charts:- Daily , Weekly | |
| Add MCB to Watchlist: View: Get Complete MCB Trend Analysis ➞ | |
 | FC Franklin Covey Co. |
| Sector: Services & Goods | |
| SubSector: Education & Training Services | |
| MarketCap: 243.306 Millions | |
| Recent Price: 38.64 Smart Investing & Trading Score: 53 | |
| Day Percent Change: 0.05% Day Change: 0.02 | |
| Week Change: 0.47% Year-to-date Change: -11.2% | |
| FC Links: Profile News Message Board | |
| Charts:- Daily , Weekly | |
| Add FC to Watchlist: View: Get Complete FC Trend Analysis ➞ | |
 | VCEL Vericel Corporation |
| Sector: Health Care | |
| SubSector: Biotechnology | |
| MarketCap: 391.885 Millions | |
| Recent Price: 48.54 Smart Investing & Trading Score: 83 | |
| Day Percent Change: 0.04% Day Change: 0.02 | |
| Week Change: 0.91% Year-to-date Change: 36.3% | |
| VCEL Links: Profile News Message Board | |
| Charts:- Daily , Weekly | |
| Add VCEL to Watchlist: View: Get Complete VCEL Trend Analysis ➞ | |
 | FMAO Farmers & Merchants Bancorp, Inc. |
| Sector: Financials | |
| SubSector: Regional - Midwest Banks | |
| MarketCap: 280.27 Millions | |
| Recent Price: 22.54 Smart Investing & Trading Score: 100 | |
| Day Percent Change: 0.04% Day Change: 0.01 | |
| Week Change: 0.36% Year-to-date Change: -9.1% | |
| FMAO Links: Profile News Message Board | |
| Charts:- Daily , Weekly | |
| Add FMAO to Watchlist: View: Get Complete FMAO Trend Analysis ➞ | |
 | PEBO Peoples Bancorp Inc. |
| Sector: Financials | |
| SubSector: Regional - Midwest Banks | |
| MarketCap: 449.77 Millions | |
| Recent Price: 30.41 Smart Investing & Trading Score: 76 | |
| Day Percent Change: 0.03% Day Change: 0.01 | |
| Week Change: -0.13% Year-to-date Change: -9.9% | |
| PEBO Links: Profile News Message Board | |
| Charts:- Daily , Weekly | |
| Add PEBO to Watchlist: View: Get Complete PEBO Trend Analysis ➞ | |
 | MBWM Mercantile Bank Corporation |
| Sector: Financials | |
| SubSector: Regional - Midwest Banks | |
| MarketCap: 372.77 Millions | |
| Recent Price: 39.02 Smart Investing & Trading Score: 68 | |
| Day Percent Change: 0.03% Day Change: 0.01 | |
| Week Change: -1.49% Year-to-date Change: -3.4% | |
| MBWM Links: Profile News Message Board | |
| Charts:- Daily , Weekly | |
| Add MBWM to Watchlist: View: Get Complete MBWM Trend Analysis ➞ | |
 | FRPH FRP Holdings, Inc. |
| Sector: Financials | |
| SubSector: Property Management | |
| MarketCap: 374.442 Millions | |
| Recent Price: 30.02 Smart Investing & Trading Score: 15 | |
| Day Percent Change: 0.02% Day Change: 0.00 | |
| Week Change: -1.94% Year-to-date Change: -52.3% | |
| FRPH Links: Profile News Message Board | |
| Charts:- Daily , Weekly | |
| Add FRPH to Watchlist: View: Get Complete FRPH Trend Analysis ➞ | |
 | BZH Beazer Homes USA, Inc. |
| Sector: Industrials | |
| SubSector: Residential Construction | |
| MarketCap: 180.106 Millions | |
| Recent Price: 28.30 Smart Investing & Trading Score: 24 | |
| Day Percent Change: 0.00% Day Change: 0.00 | |
| Week Change: -0.46% Year-to-date Change: -16.3% | |
| BZH Links: Profile News Message Board | |
| Charts:- Daily , Weekly | |
| Add BZH to Watchlist: View: Get Complete BZH Trend Analysis ➞ | |
 | CSV Carriage Services, Inc. |
| Sector: Services & Goods | |
| SubSector: Personal Services | |
| MarketCap: 304.725 Millions | |
| Recent Price: 26.54 Smart Investing & Trading Score: 88 | |
| Day Percent Change: 0.00% Day Change: 0.00 | |
| Week Change: 2% Year-to-date Change: 6.1% | |
| CSV Links: Profile News Message Board | |
| Charts:- Daily , Weekly | |
| Add CSV to Watchlist: View: Get Complete CSV Trend Analysis ➞ | |
 | NC NACCO Industries, Inc. |
| Sector: Consumer Staples | |
| SubSector: Home Furnishings & Fixtures | |
| MarketCap: 179.835 Millions | |
| Recent Price: 31.34 Smart Investing & Trading Score: 42 | |
| Day Percent Change: 0.00% Day Change: 0.00 | |
| Week Change: -1.66% Year-to-date Change: -14.1% | |
| NC Links: Profile News Message Board | |
| Charts:- Daily , Weekly | |
| Add NC to Watchlist: View: Get Complete NC Trend Analysis ➞ | |
 | HAYN Haynes International, Inc. |
| Sector: Industrials | |
| SubSector: Metal Fabrication | |
| MarketCap: 245.75 Millions | |
| Recent Price: 59.18 Smart Investing & Trading Score: 31 | |
| Day Percent Change: 0.00% Day Change: 0.00 | |
| Week Change: -0.2% Year-to-date Change: 3.7% | |
| HAYN Links: Profile News Message Board | |
| Charts:- Daily , Weekly | |
| Add HAYN to Watchlist: View: Get Complete HAYN Trend Analysis ➞ | |
 | IMRX Immuneering Corporation |
| Sector: Health Care | |
| SubSector: Biotechnology | |
| MarketCap: 303 Millions | |
| Recent Price: 1.59 Smart Investing & Trading Score: 30 | |
| Day Percent Change: 0.00% Day Change: 0.00 | |
| Week Change: 9.66% Year-to-date Change: -79.1% | |
| IMRX Links: Profile News Message Board | |
| Charts:- Daily , Weekly | |
| Add IMRX to Watchlist: View: Get Complete IMRX Trend Analysis ➞ | |
 | ORC Orchid Island Capital, Inc. |
| Sector: Financials | |
| SubSector: Mortgage Investment | |
| MarketCap: 212.339 Millions | |
| Recent Price: 8.58 Smart Investing & Trading Score: 60 | |
| Day Percent Change: 0.00% Day Change: 0.00 | |
| Week Change: 0.59% Year-to-date Change: 1.8% | |
| ORC Links: Profile News Message Board | |
| Charts:- Daily , Weekly | |
| Add ORC to Watchlist: View: Get Complete ORC Trend Analysis ➞ | |
 | ASIX AdvanSix Inc. |
| Sector: Materials | |
| SubSector: Chemicals - Major Diversified | |
| MarketCap: 394.136 Millions | |
| Recent Price: 25.04 Smart Investing & Trading Score: 59 | |
| Day Percent Change: 0.00% Day Change: 0.00 | |
| Week Change: 0.64% Year-to-date Change: -16.4% | |
| ASIX Links: Profile News Message Board | |
| Charts:- Daily , Weekly | |
| Add ASIX to Watchlist: View: Get Complete ASIX Trend Analysis ➞ | |
 | DOUG Douglas Elliman Inc. |
| Sector: Financials | |
| SubSector: Financials Services | |
| MarketCap: 197 Millions | |
| Recent Price: 1.12 Smart Investing & Trading Score: 20 | |
| Day Percent Change: 0.00% Day Change: 0.00 | |
| Week Change: -5.08% Year-to-date Change: -61.8% | |
| DOUG Links: Profile News Message Board | |
| Charts:- Daily , Weekly | |
| Add DOUG to Watchlist: View: Get Complete DOUG Trend Analysis ➞ | |
 | VAXX Vaxxinity, Inc. |
| Sector: Health Care | |
| SubSector: Biotechnology | |
| MarketCap: 320 Millions | |
| Recent Price: 0.05 Smart Investing & Trading Score: 0 | |
| Day Percent Change: 0.00% Day Change: 0.00 | |
| Week Change: -5.88% Year-to-date Change: -94.3% | |
| VAXX Links: Profile News Message Board | |
| Charts:- Daily , Weekly | |
| Add VAXX to Watchlist: View: Get Complete VAXX Trend Analysis ➞ | |
 | VPG Vishay Precision Group, Inc. |
| Sector: Technology | |
| SubSector: Scientific & Technical Instruments | |
| MarketCap: 261.553 Millions | |
| Recent Price: 31.51 Smart Investing & Trading Score: 10 | |
| Day Percent Change: -0.03% Day Change: -0.01 | |
| Week Change: -1.28% Year-to-date Change: -7.5% | |
| VPG Links: Profile News Message Board | |
| Charts:- Daily , Weekly | |
| Add VPG to Watchlist: View: Get Complete VPG Trend Analysis ➞ | |
 | GCO Genesco Inc. |
| Sector: Services & Goods | |
| SubSector: Apparel Stores | |
| MarketCap: 187.508 Millions | |
| Recent Price: 26.66 Smart Investing & Trading Score: 67 | |
| Day Percent Change: -0.04% Day Change: -0.01 | |
| Week Change: 0.64% Year-to-date Change: -24.3% | |
| GCO Links: Profile News Message Board | |
| Charts:- Daily , Weekly | |
| Add GCO to Watchlist: View: Get Complete GCO Trend Analysis ➞ | |
 | FBMS The First Bancshares, Inc. |
| Sector: Financials | |
| SubSector: Regional - Southeast Banks | |
| MarketCap: 359.535 Millions | |
| Recent Price: 25.50 Smart Investing & Trading Score: 76 | |
| Day Percent Change: -0.04% Day Change: -0.01 | |
| Week Change: 0% Year-to-date Change: -13.1% | |
| FBMS Links: Profile News Message Board | |
| Charts:- Daily , Weekly | |
| Add FBMS to Watchlist: View: Get Complete FBMS Trend Analysis ➞ | |
| For tabular summary view of above stock list: Summary View ➞ 0 - 25 , 25 - 50 , 50 - 75 , 75 - 100 , 100 - 125 , 125 - 150 , 150 - 175 , 175 - 200 , 200 - 225 , 225 - 250 , 250 - 275 , 275 - 300 , 300 - 325 , 325 - 350 , 350 - 375 , 375 - 400 , 400 - 425 , 425 - 450 , 450 - 475 , 475 - 500 , 500 - 525 | ||
| Click To Change The Sort Order: By Market Cap or Company Size Performance: Year-to-date, Week and Day | |
| Select Chart Type: | ||
| Too many stocks? View smallcap stocks filtered by marketcap & sector |
| Marketcap: All SmallCap Stocks (default-no microcap), Large, Mid-Range, Small & MicroCap |
| Sector: Tech, Finance, Energy, Staples, Retail, Industrial, Materials, Utilities & Medical |
|
Best Stocks Today 12Stocks.com |
© 2024 12Stocks.com Terms & Conditions Privacy Contact Us
All Information Provided Only For Education And Not To Be Used For Investing or Trading. See Terms & Conditions


One More Thing ... Get Best Stocks Delivered Daily!
Never Ever Miss A Move With Our Top Ten Stocks Lists
Find Best Stocks In Any Market - Bull or Bear Market
Take A Peek At Our Top Ten Stocks Lists: Daily, Weekly, Year-to-Date & Top Trends
Find Best Stocks In Any Market - Bull or Bear Market
Take A Peek At Our Top Ten Stocks Lists: Daily, Weekly, Year-to-Date & Top Trends
Smallcap Stocks With Best Up Trends [0-bearish to 100-bullish]: SunPower [100], Harrow Health[100], ProKidney [100], Fossil Group[100], Infinera [100], Agilysys [100], Tucows [100], Actinium [100], Arbor Realty[100], Funko [100], Pitney Bowes[100]
Best Smallcap Stocks Year-to-Date:
CareMax [477.32%], Bakkt [400%], Janux [345.93%], Viking [289.47%], Alpine Immune[241.07%], Longboard [232.98%], Avidity Biosciences[219.69%], Super Micro[189.32%], Sweetgreen [182.92%], Novavax [181.04%], Vera [163.89%] Best Smallcap Stocks This Week:
SunPower [91.3%], Maxeon Solar[70.28%], Novavax [51.91%], ProKidney [45.91%], Harrow Health[40.09%], LivePerson [38.44%], Humacyte [36.17%], MacroGenics [34.44%], Big Lots[32.3%], Virgin Galactic[29.63%], Sunnova Energy[29.56%] Best Smallcap Stocks Daily:
SunPower [60.00%], Maxeon Solar[49.60%], Harrow Health[34.63%], ProKidney [33.12%], Sunnova Energy[27.39%], Big Lots[26.95%], Generation Bio[24.65%], FuelCell Energy[23.35%], Virgin Galactic[22.12%], Paysafe [20.23%], LivePerson [20.18%]