
 Login Sign Up


| |||||
 |  | ||||

| 12Stocks.com Market Intelligence |
Best SmallCap Stocks
|
| In a hurry? Small Cap Stock Lists: Performance Trends Table, Stock Charts
Sort Small Cap stocks: Daily, Weekly, Year-to-Date, Market Cap & Trends. Filter Small Cap stocks list by sector: Show all, Tech, Finance, Energy, Staples, Retail, Industrial, Materials, Utilities and HealthCare Filter Small Cap stocks list by size: All Large Medium Small and MicroCap |
| 12Stocks.com Small Cap Stocks Performances & Trends Daily | |||||||||
|
|  The overall Smart Investing & Trading Score is 70 (0-bearish to 100-bullish) which puts Small Cap index in short term neutral to bullish trend. The Smart Investing & Trading Score from previous trading session is 65 and hence an improvement of trend.
| ||||||||
Here are the Smart Investing & Trading Scores of the most requested small cap stocks at 12Stocks.com (click stock name for detailed review):
|


| 12Stocks.com: Investing in Smallcap Index with Stocks | |
|
The following table helps investors and traders sort through current performance and trends (as measured by Smart Investing & Trading Score) of various
stocks in the Smallcap Index. Quick View: Move mouse or cursor over stock symbol (ticker) to view short-term technical chart and over stock name to view long term chart. Click on  to add stock symbol to your watchlist and to add stock symbol to your watchlist and  to view watchlist. Click on any ticker or stock name for detailed market intelligence report for that stock. to view watchlist. Click on any ticker or stock name for detailed market intelligence report for that stock. |
12Stocks.com Performance of Stocks in Smallcap Index
| Ticker | Stock Name | Watchlist | Category | Recent Price | Smart Investing & Trading Score | Change % | YTD Change% |
| MSBI | Midland States |   | Financials | 23.65 | 33 | -0.17 | -14.19% |
| CCS | Century Communities | | Industrials | 84.44 | 54 | -0.18 | -7.35% |
| ACCO | ACCO Brands | | Consumer Staples | 5.13 | 64 | -0.19 | -15.63% |
| UTI | Universal Technical | | Services & Goods | 14.99 | 13 | -0.20 | 19.73% |
| HAYN | Haynes | | Industrials | 59.18 | 31 | -0.20 | 3.73% |
| NGVC | Natural Grocers | | Services & Goods | 19.48 | 100 | -0.20 | 21.75% |
| RIGL | Rigel | | Health Care | 0.98 | 0 | -0.22 | -32.26% |
| UVSP | Univest Financial | | Financials | 22.59 | 75 | -0.26 | 2.54% |
| CHEF | Chefs | | Consumer Staples | 38.40 | 83 | -0.26 | 30.48% |
| EVRI | Everi | | Services & Goods | 7.71 | 37 | -0.26 | -31.59% |
| TPC | Tutor Perini | | Industrials | 18.79 | 85 | -0.27 | 106.48% |
| ANIK | Anika | | Health Care | 25.56 | 36 | -0.27 | 12.80% |
| DAKT | Daktronics | | Technology | 11.25 | 95 | -0.27 | 32.67% |
| NOG | Northern Oil | | Energy | 39.62 | 36 | -0.28 | 6.88% |
| PI | Impinj | | Technology | 159.82 | 63 | -0.28 | 77.52% |
| OCUL | Ocular Therapeutix | | Health Care | 5.64 | 37 | -0.35 | 26.46% |
| SFST | Southern First | | Financials | 27.50 | 45 | -0.36 | -25.88% |
| NATH | Nathan s | | Services & Goods | 66.75 | 40 | -0.36 | -14.43% |
| CALX | Calix | | Technology | 30.52 | 62 | -0.36 | -30.14% |
| NAUT | Nautilus | | Health Care | 2.73 | 66 | -0.36 | -17.02% |
| ORRF | Orrstown Financial | | Financials | 26.55 | 39 | -0.38 | -10.00% |
| UTMD | Utah Medical | | Health Care | 68.47 | 57 | -0.39 | -18.70% |
| AMSWA | American | | Technology | 10.03 | 10 | -0.40 | -11.24% |
| CLNE | Clean Energy | | Utilities | 2.48 | 57 | -0.40 | -35.25% |
| NN | NextNav | | Technology | 7.46 | 26 | -0.40 | 67.64% |
| For chart view version of above stock list: Chart View ➞ 0 - 25 , 25 - 50 , 50 - 75 , 75 - 100 , 100 - 125 , 125 - 150 , 150 - 175 , 175 - 200 , 200 - 225 , 225 - 250 , 250 - 275 , 275 - 300 , 300 - 325 , 325 - 350 , 350 - 375 , 375 - 400 , 400 - 425 , 425 - 450 , 450 - 475 , 475 - 500 , 500 - 525 | ||
 | Click To Change The Sort Order: By Market Cap or Company Size Performance: Year-to-date, Week and Day |  |
| Too many stocks? View smallcap stocks filtered by marketcap & sector |
| Marketcap: All SmallCap Stocks (default-no microcap), Large, Mid-Range, Small |
| Smallcap Sector: Tech, Finance, Energy, Staples, Retail, Industrial, Materials, & Medical |
|
Get the most comprehensive stock market coverage daily at 12Stocks.com ➞ Best Stocks Today ➞ Best Stocks Weekly ➞ Best Stocks Year-to-Date ➞ Best Stocks Trends ➞  Best Stocks Today 12Stocks.com Best Nasdaq Stocks ➞ Best S&P 500 Stocks ➞ Best Tech Stocks ➞ Best Biotech Stocks ➞ |
| Detailed Overview of SmallCap Stocks |
| SmallCap Technical Overview, Leaders & Laggards, Top SmallCap ETF Funds & Detailed SmallCap Stocks List, Charts, Trends & More |
| Smallcap: Technical Analysis, Trends & YTD Performance | |
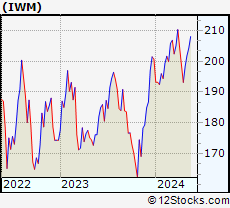
| SmallCap segment as represented by
IWM, an exchange-traded fund [ETF], holds basket of thousands of smallcap stocks from across all major sectors of the US stock market. The smallcap index (contains stocks like Riverbed & Sotheby's) is up by 2.01% and is currently underperforming the overall market by -6.83% year-to-date. Below is a quick view of technical charts and trends: | |
 IWM Weekly Chart |
|
| Long Term Trend: Very Good | |
| Medium Term Trend: Very Good | |
 IWM Daily Chart |
|
| Short Term Trend: Good | |
| Overall Trend Score: 70 | |
| YTD Performance: 2.01% | |
| **Trend Scores & Views Are Only For Educational Purposes And Not For Investing | |
| 12Stocks.com: Top Performing Small Cap Index Stocks | ||||||||||||||||||||||||||||||||||||||||||||||||
 The top performing Small Cap Index stocks year to date are
Now, more recently, over last week, the top performing Small Cap Index stocks on the move are


|
||||||||||||||||||||||||||||||||||||||||||||||||
| 12Stocks.com: Investing in Smallcap Index using Exchange Traded Funds | |
|
The following table shows list of key exchange traded funds (ETF) that
help investors track Smallcap index. The following list also includes leveraged ETF funds that track twice or thrice the daily returns of Smallcap indices. Short or inverse ETF funds move in the opposite direction to the index they track and are useful during market pullbacks or during bear markets. Quick View: Move mouse or cursor over ETF symbol (ticker) to view short-term technical chart and over ETF name to view long term chart. Click on ticker or stock name for detailed view. Click on to add stock symbol to your watchlist and to view watchlist. |
12Stocks.com List of ETFs that track Smallcap Index
| Ticker | ETF Name | Watchlist | Recent Price | Smart Investing & Trading Score | Change % | Week % | Year-to-date % |
| IWM | iShares Russell 2000 | | 204.74 | 70 | 0.21 | 0.21 | 2.01% |
| IJR | iShares Core S&P Small-Cap | | 109.31 | 90 | 0.30 | 0.3 | 0.98% |
| VTWO | Vanguard Russell 2000 ETF | | 82.76 | 65 | 0.16 | 0.16 | 2.05% |
| IWN | iShares Russell 2000 Value | | 156.30 | 83 | 0.07 | 0.07 | 0.62% |
| IWO | iShares Russell 2000 Growth | | 260.53 | 52 | 0.23 | 0.23 | 3.29% |
| IJS | iShares S&P Small-Cap 600 Value | | 100.95 | 77 | 0.43 | 0.43 | -2.06% |
| IJT | iShares S&P Small-Cap 600 Growth | | 129.96 | 85 | 0.08 | 0.08 | 3.85% |
| XSLV | PowerShares S&P SmallCap Low Volatil ETF | | 44.51 | 95 | 0.63 | 0.63 | 0.82% |
| SMLV | SPDR SSGA US Small Cap Low Volatil ETF | | 111.41 | 90 | 0.17 | 0.17 | -0.99% |
| SDD | ProShares UltraShort SmallCap600 | | 18.16 | 20 | -0.68 | -0.68 | -1.47% |
| SAA | ProShares Ultra SmallCap600 | | 24.61 | 90 | 1.07 | 1.07 | -1.36% |
| SBB | ProShares Short SmallCap600 | | 15.90 | 10 | -0.37 | -0.37 | -0.21% |
| 12Stocks.com: Charts, Trends, Fundamental Data and Performances of SmallCap Stocks | |
|
We now take in-depth look at all SmallCap stocks including charts, multi-period performances and overall trends (as measured by Smart Investing & Trading Score). One can sort SmallCap stocks (click link to choose) by Daily, Weekly and by Year-to-Date performances. Also, one can sort by size of the company or by market capitalization. |
| Select Your Default Chart Type: | |||||
| |||||
| Click on stock symbol or name for detailed view. Click on to add stock symbol to your watchlist and to view watchlist. Quick View: Move mouse or cursor over "Daily" to quickly view daily technical stock chart and over "Weekly" to view weekly technical stock chart. | |||||

 | MSBI Midland States Bancorp, Inc. |
| Sector: Financials | |
| SubSector: Regional - Midwest Banks | |
| MarketCap: 400.27 Millions | |
| Recent Price: 23.65 Smart Investing & Trading Score: 33 | |
| Day Percent Change: -0.17% Day Change: -0.04 | |
| Week Change: -0.17% Year-to-date Change: -14.2% | |
| MSBI Links: Profile News Message Board | |
| Charts:- Daily , Weekly | |
| Add MSBI to Watchlist: View: Get Complete MSBI Trend Analysis ➞ | |
 | CCS Century Communities, Inc. |
| Sector: Industrials | |
| SubSector: Residential Construction | |
| MarketCap: 459.206 Millions | |
| Recent Price: 84.44 Smart Investing & Trading Score: 54 | |
| Day Percent Change: -0.18% Day Change: -0.15 | |
| Week Change: -0.18% Year-to-date Change: -7.4% | |
| CCS Links: Profile News Message Board | |
| Charts:- Daily , Weekly | |
| Add CCS to Watchlist: View: Get Complete CCS Trend Analysis ➞ | |
 | ACCO ACCO Brands Corporation |
| Sector: Consumer Staples | |
| SubSector: Office Supplies | |
| MarketCap: 448.2 Millions | |
| Recent Price: 5.13 Smart Investing & Trading Score: 64 | |
| Day Percent Change: -0.19% Day Change: -0.01 | |
| Week Change: -0.19% Year-to-date Change: -15.6% | |
| ACCO Links: Profile News Message Board | |
| Charts:- Daily , Weekly | |
| Add ACCO to Watchlist: View: Get Complete ACCO Trend Analysis ➞ | |
 | UTI Universal Technical Institute, Inc. |
| Sector: Services & Goods | |
| SubSector: Education & Training Services | |
| MarketCap: 163.506 Millions | |
| Recent Price: 14.99 Smart Investing & Trading Score: 13 | |
| Day Percent Change: -0.20% Day Change: -0.03 | |
| Week Change: -0.2% Year-to-date Change: 19.7% | |
| UTI Links: Profile News Message Board | |
| Charts:- Daily , Weekly | |
| Add UTI to Watchlist: View: Get Complete UTI Trend Analysis ➞ | |
 | HAYN Haynes International, Inc. |
| Sector: Industrials | |
| SubSector: Metal Fabrication | |
| MarketCap: 245.75 Millions | |
| Recent Price: 59.18 Smart Investing & Trading Score: 31 | |
| Day Percent Change: -0.20% Day Change: -0.12 | |
| Week Change: -0.2% Year-to-date Change: 3.7% | |
| HAYN Links: Profile News Message Board | |
| Charts:- Daily , Weekly | |
| Add HAYN to Watchlist: View: Get Complete HAYN Trend Analysis ➞ | |
 | NGVC Natural Grocers by Vitamin Cottage, Inc. |
| Sector: Services & Goods | |
| SubSector: Grocery Stores | |
| MarketCap: 185.475 Millions | |
| Recent Price: 19.48 Smart Investing & Trading Score: 100 | |
| Day Percent Change: -0.20% Day Change: -0.04 | |
| Week Change: -0.2% Year-to-date Change: 21.8% | |
| NGVC Links: Profile News Message Board | |
| Charts:- Daily , Weekly | |
| Add NGVC to Watchlist: View: Get Complete NGVC Trend Analysis ➞ | |
 | RIGL Rigel Pharmaceuticals, Inc. |
| Sector: Health Care | |
| SubSector: Biotechnology | |
| MarketCap: 256.585 Millions | |
| Recent Price: 0.98 Smart Investing & Trading Score: 0 | |
| Day Percent Change: -0.22% Day Change: 0.00 | |
| Week Change: -0.22% Year-to-date Change: -32.3% | |
| RIGL Links: Profile News Message Board | |
| Charts:- Daily , Weekly | |
| Add RIGL to Watchlist: View: Get Complete RIGL Trend Analysis ➞ | |
 | UVSP Univest Financial Corporation |
| Sector: Financials | |
| SubSector: Regional - Northeast Banks | |
| MarketCap: 467.999 Millions | |
| Recent Price: 22.59 Smart Investing & Trading Score: 75 | |
| Day Percent Change: -0.26% Day Change: -0.06 | |
| Week Change: -0.26% Year-to-date Change: 2.5% | |
| UVSP Links: Profile News Message Board | |
| Charts:- Daily , Weekly | |
| Add UVSP to Watchlist: View: Get Complete UVSP Trend Analysis ➞ | |
 | CHEF The Chefs Warehouse, Inc. |
| Sector: Consumer Staples | |
| SubSector: Food Wholesale | |
| MarketCap: 207.529 Millions | |
| Recent Price: 38.40 Smart Investing & Trading Score: 83 | |
| Day Percent Change: -0.26% Day Change: -0.10 | |
| Week Change: -0.26% Year-to-date Change: 30.5% | |
| CHEF Links: Profile News Message Board | |
| Charts:- Daily , Weekly | |
| Add CHEF to Watchlist: View: Get Complete CHEF Trend Analysis ➞ | |
 | EVRI Everi Holdings Inc. |
| Sector: Services & Goods | |
| SubSector: Gaming Activities | |
| MarketCap: 273.389 Millions | |
| Recent Price: 7.71 Smart Investing & Trading Score: 37 | |
| Day Percent Change: -0.26% Day Change: -0.02 | |
| Week Change: -0.26% Year-to-date Change: -31.6% | |
| EVRI Links: Profile News Message Board | |
| Charts:- Daily , Weekly | |
| Add EVRI to Watchlist: View: Get Complete EVRI Trend Analysis ➞ | |
 | TPC Tutor Perini Corporation |
| Sector: Industrials | |
| SubSector: Heavy Construction | |
| MarketCap: 382.595 Millions | |
| Recent Price: 18.79 Smart Investing & Trading Score: 85 | |
| Day Percent Change: -0.27% Day Change: -0.05 | |
| Week Change: -0.27% Year-to-date Change: 106.5% | |
| TPC Links: Profile News Message Board | |
| Charts:- Daily , Weekly | |
| Add TPC to Watchlist: View: Get Complete TPC Trend Analysis ➞ | |
 | ANIK Anika Therapeutics, Inc. |
| Sector: Health Care | |
| SubSector: Biotechnology | |
| MarketCap: 438.385 Millions | |
| Recent Price: 25.56 Smart Investing & Trading Score: 36 | |
| Day Percent Change: -0.27% Day Change: -0.07 | |
| Week Change: -0.27% Year-to-date Change: 12.8% | |
| ANIK Links: Profile News Message Board | |
| Charts:- Daily , Weekly | |
| Add ANIK to Watchlist: View: Get Complete ANIK Trend Analysis ➞ | |
 | DAKT Daktronics, Inc. |
| Sector: Technology | |
| SubSector: Computer Based Systems | |
| MarketCap: 223.539 Millions | |
| Recent Price: 11.25 Smart Investing & Trading Score: 95 | |
| Day Percent Change: -0.27% Day Change: -0.03 | |
| Week Change: -0.27% Year-to-date Change: 32.7% | |
| DAKT Links: Profile News Message Board | |
| Charts:- Daily , Weekly | |
| Add DAKT to Watchlist: View: Get Complete DAKT Trend Analysis ➞ | |
 | NOG Northern Oil and Gas, Inc. |
| Sector: Energy | |
| SubSector: Oil & Gas Drilling & Exploration | |
| MarketCap: 301.939 Millions | |
| Recent Price: 39.62 Smart Investing & Trading Score: 36 | |
| Day Percent Change: -0.28% Day Change: -0.11 | |
| Week Change: -0.28% Year-to-date Change: 6.9% | |
| NOG Links: Profile News Message Board | |
| Charts:- Daily , Weekly | |
| Add NOG to Watchlist: View: Get Complete NOG Trend Analysis ➞ | |
 | PI Impinj, Inc. |
| Sector: Technology | |
| SubSector: Communication Equipment | |
| MarketCap: 364.739 Millions | |
| Recent Price: 159.82 Smart Investing & Trading Score: 63 | |
| Day Percent Change: -0.28% Day Change: -0.45 | |
| Week Change: -0.28% Year-to-date Change: 77.5% | |
| PI Links: Profile News Message Board | |
| Charts:- Daily , Weekly | |
| Add PI to Watchlist: View: Get Complete PI Trend Analysis ➞ | |
 | OCUL Ocular Therapeutix, Inc. |
| Sector: Health Care | |
| SubSector: Biotechnology | |
| MarketCap: 249.985 Millions | |
| Recent Price: 5.64 Smart Investing & Trading Score: 37 | |
| Day Percent Change: -0.35% Day Change: -0.02 | |
| Week Change: -0.35% Year-to-date Change: 26.5% | |
| OCUL Links: Profile News Message Board | |
| Charts:- Daily , Weekly | |
| Add OCUL to Watchlist: View: Get Complete OCUL Trend Analysis ➞ | |
 | SFST Southern First Bancshares, Inc. |
| Sector: Financials | |
| SubSector: Money Center Banks | |
| MarketCap: 189.099 Millions | |
| Recent Price: 27.50 Smart Investing & Trading Score: 45 | |
| Day Percent Change: -0.36% Day Change: -0.10 | |
| Week Change: -0.36% Year-to-date Change: -25.9% | |
| SFST Links: Profile News Message Board | |
| Charts:- Daily , Weekly | |
| Add SFST to Watchlist: View: Get Complete SFST Trend Analysis ➞ | |
 | NATH Nathan s Famous, Inc. |
| Sector: Services & Goods | |
| SubSector: Restaurants | |
| MarketCap: 211.77 Millions | |
| Recent Price: 66.75 Smart Investing & Trading Score: 40 | |
| Day Percent Change: -0.36% Day Change: -0.24 | |
| Week Change: -0.36% Year-to-date Change: -14.4% | |
| NATH Links: Profile News Message Board | |
| Charts:- Daily , Weekly | |
| Add NATH to Watchlist: View: Get Complete NATH Trend Analysis ➞ | |
 | CALX Calix, Inc. |
| Sector: Technology | |
| SubSector: Communication Equipment | |
| MarketCap: 390.039 Millions | |
| Recent Price: 30.52 Smart Investing & Trading Score: 62 | |
| Day Percent Change: -0.36% Day Change: -0.11 | |
| Week Change: -0.36% Year-to-date Change: -30.1% | |
| CALX Links: Profile News Message Board | |
| Charts:- Daily , Weekly | |
| Add CALX to Watchlist: View: Get Complete CALX Trend Analysis ➞ | |
 | NAUT Nautilus Biotechnology, Inc. |
| Sector: Health Care | |
| SubSector: Biotechnology | |
| MarketCap: 458 Millions | |
| Recent Price: 2.73 Smart Investing & Trading Score: 66 | |
| Day Percent Change: -0.36% Day Change: -0.01 | |
| Week Change: -0.36% Year-to-date Change: -17.0% | |
| NAUT Links: Profile News Message Board | |
| Charts:- Daily , Weekly | |
| Add NAUT to Watchlist: View: Get Complete NAUT Trend Analysis ➞ | |
 | ORRF Orrstown Financial Services, Inc. |
| Sector: Financials | |
| SubSector: Regional - Northeast Banks | |
| MarketCap: 159.999 Millions | |
| Recent Price: 26.55 Smart Investing & Trading Score: 39 | |
| Day Percent Change: -0.38% Day Change: -0.10 | |
| Week Change: -0.38% Year-to-date Change: -10.0% | |
| ORRF Links: Profile News Message Board | |
| Charts:- Daily , Weekly | |
| Add ORRF to Watchlist: View: Get Complete ORRF Trend Analysis ➞ | |
 | UTMD Utah Medical Products, Inc. |
| Sector: Health Care | |
| SubSector: Medical Instruments & Supplies | |
| MarketCap: 285.86 Millions | |
| Recent Price: 68.47 Smart Investing & Trading Score: 57 | |
| Day Percent Change: -0.39% Day Change: -0.27 | |
| Week Change: -0.39% Year-to-date Change: -18.7% | |
| UTMD Links: Profile News Message Board | |
| Charts:- Daily , Weekly | |
| Add UTMD to Watchlist: View: Get Complete UTMD Trend Analysis ➞ | |
 | AMSWA American Software, Inc. |
| Sector: Technology | |
| SubSector: Application Software | |
| MarketCap: 389.862 Millions | |
| Recent Price: 10.03 Smart Investing & Trading Score: 10 | |
| Day Percent Change: -0.40% Day Change: -0.04 | |
| Week Change: -0.4% Year-to-date Change: -11.2% | |
| AMSWA Links: Profile News Message Board | |
| Charts:- Daily , Weekly | |
| Add AMSWA to Watchlist: View: Get Complete AMSWA Trend Analysis ➞ | |
 | CLNE Clean Energy Fuels Corp. |
| Sector: Utilities | |
| SubSector: Gas Utilities | |
| MarketCap: 371.977 Millions | |
| Recent Price: 2.48 Smart Investing & Trading Score: 57 | |
| Day Percent Change: -0.40% Day Change: -0.01 | |
| Week Change: -0.4% Year-to-date Change: -35.3% | |
| CLNE Links: Profile News Message Board | |
| Charts:- Daily , Weekly | |
| Add CLNE to Watchlist: View: Get Complete CLNE Trend Analysis ➞ | |
 | NN NextNav Inc. |
| Sector: Technology | |
| SubSector: Software - Infrastructure | |
| MarketCap: 314 Millions | |
| Recent Price: 7.46 Smart Investing & Trading Score: 26 | |
| Day Percent Change: -0.40% Day Change: -0.03 | |
| Week Change: -0.4% Year-to-date Change: 67.6% | |
| NN Links: Profile News Message Board | |
| Charts:- Daily , Weekly | |
| Add NN to Watchlist: View: Get Complete NN Trend Analysis ➞ | |
| For tabular summary view of above stock list: Summary View ➞ 0 - 25 , 25 - 50 , 50 - 75 , 75 - 100 , 100 - 125 , 125 - 150 , 150 - 175 , 175 - 200 , 200 - 225 , 225 - 250 , 250 - 275 , 275 - 300 , 300 - 325 , 325 - 350 , 350 - 375 , 375 - 400 , 400 - 425 , 425 - 450 , 450 - 475 , 475 - 500 , 500 - 525 | ||
| Click To Change The Sort Order: By Market Cap or Company Size Performance: Year-to-date, Week and Day | |
| Select Chart Type: | ||
| Too many stocks? View smallcap stocks filtered by marketcap & sector |
| Marketcap: All SmallCap Stocks (default-no microcap), Large, Mid-Range, Small & MicroCap |
| Sector: Tech, Finance, Energy, Staples, Retail, Industrial, Materials, Utilities & Medical |
|
Best Stocks Today 12Stocks.com |
© 2024 12Stocks.com Terms & Conditions Privacy Contact Us
All Information Provided Only For Education And Not To Be Used For Investing or Trading. See Terms & Conditions


One More Thing ... Get Best Stocks Delivered Daily!
Never Ever Miss A Move With Our Top Ten Stocks Lists
Find Best Stocks In Any Market - Bull or Bear Market
Take A Peek At Our Top Ten Stocks Lists: Daily, Weekly, Year-to-Date & Top Trends
Find Best Stocks In Any Market - Bull or Bear Market
Take A Peek At Our Top Ten Stocks Lists: Daily, Weekly, Year-to-Date & Top Trends
Smallcap Stocks With Best Up Trends [0-bearish to 100-bullish]: Novavax [100], Emergent BioSolutions[100], Verrica [100], iRobot [100], Trupanion [100], Humacyte [100], AMC s[100], Squarespace [100], Twist Bioscience[100], Redfin [100], Guardant Health[100]
Best Smallcap Stocks Year-to-Date:
CareMax [500%], Janux [365.24%], Bakkt [347.53%], Viking [288.82%], Alpine Immune[241.12%], Longboard [226.19%], Avidity Biosciences[187.83%], Sweetgreen [186.37%], Super Micro[175.37%], Novavax [173.13%], Vera [163.24%] Best Smallcap Stocks This Week:
Novavax [47.64%], MacroGenics [32.33%], Emergent BioSolutions[23.22%], Allbirds [20.23%], Omega [20.15%], SunPower [19.57%], Verrica [19.5%], iRobot [19.43%], Trupanion [19.26%], Humacyte [16.6%], FiscalNote [16.54%] Best Smallcap Stocks Daily:
Novavax [47.64%], MacroGenics [32.33%], Emergent BioSolutions[23.22%], Allbirds [20.23%], Omega [20.15%], SunPower [19.57%], Verrica [19.50%], iRobot [19.43%], Trupanion [19.26%], Humacyte [16.60%], FiscalNote [16.54%]