
 Login Sign Up


| |||||
 |  | ||||

| 12Stocks.com Market Intelligence |
Best SmallCap Stocks
|
| In a hurry? Small Cap Stock Lists: Performance Trends Table, Stock Charts
Sort Small Cap stocks: Daily, Weekly, Year-to-Date, Market Cap & Trends. Filter Small Cap stocks list by sector: Show all, Tech, Finance, Energy, Staples, Retail, Industrial, Materials, Utilities and HealthCare Filter Small Cap stocks list by size: All Large Medium Small and MicroCap |
| 12Stocks.com Small Cap Stocks Performances & Trends Daily | |||||||||
|
|  The overall Smart Investing & Trading Score is 44 (0-bearish to 100-bullish) which puts Small Cap index in short term neutral trend. The Smart Investing & Trading Score from previous trading session is 58 and hence a deterioration of trend.
| ||||||||
Here are the Smart Investing & Trading Scores of the most requested small cap stocks at 12Stocks.com (click stock name for detailed review):
|


| 12Stocks.com: Investing in Smallcap Index with Stocks | |
|
The following table helps investors and traders sort through current performance and trends (as measured by Smart Investing & Trading Score) of various
stocks in the Smallcap Index. Quick View: Move mouse or cursor over stock symbol (ticker) to view short-term technical chart and over stock name to view long term chart. Click on  to add stock symbol to your watchlist and to add stock symbol to your watchlist and  to view watchlist. Click on any ticker or stock name for detailed market intelligence report for that stock. to view watchlist. Click on any ticker or stock name for detailed market intelligence report for that stock. |
12Stocks.com Performance of Stocks in Smallcap Index
| Ticker | Stock Name | Watchlist | Category | Recent Price | Smart Investing & Trading Score | Change % | YTD Change% |
| ITOS | iTeos |   | Health Care | 10.45 | 61 | -1.23% | -4.48% |
| THRM | Gentherm | | Consumer Staples | 50.01 | 61 | -1.44% | -4.49% |
| AXGN | AxoGen | | Health Care | 6.52 | 35 | -5.09% | -4.54% |
| VRTS | Virtus | | Financials | 230.75 | 37 | -1.68% | -4.55% |
| CHCO | City Holding | | Financials | 105.21 | 93 | -0.88% | -4.58% |
| NXRT | NexPoint Residential | | Financials | 32.85 | 80 | -1.35% | -4.59% |
| EHAB | Enhabit | | Health Care | 9.87 | 33 | -2.03% | -4.64% |
| NPO | EnPro Industries | | Industrials | 149.38 | 51 | -1.09% | -4.70% |
| AVDX | AvidXchange | | Technology | 11.83 | 58 | -1.66% | -4.71% |
| LOCO | El Pollo | | Services & Goods | 8.40 | 23 | -0.36% | -4.76% |
| SNDX | Syndax | | Health Care | 20.57 | 54 | -1.06% | -4.81% |
| ACDC | ProFrac Holding | | Energy | 8.10 | 54 | -0.49% | -4.82% |
| MITK | Mitek Systems | | Technology | 12.41 | 43 | -1.97% | -4.83% |
| IVR | Invesco Mortgage | | Financials | 8.43 | 42 | -2.09% | -4.85% |
| HWC | Hancock Whitney | | Financials | 46.18 | 80 | -0.62% | -4.96% |
| SEAT | Vivid Seats | | Services & Goods | 5.93 | 68 | 2.24% | -4.97% |
| EXLS | ExlService | | Technology | 29.31 | 35 | -0.88% | -4.99% |
| ALG | Alamo Group | | Industrials | 199.63 | 10 | -2.24% | -5.02% |
| CNO | CNO Financial | | Financials | 26.45 | 57 | -1.64% | -5.20% |
| PAGS | PagSeguro Digital | | Financials | 11.82 | 10 | 1.11% | -5.21% |
| MTH | Meritage Homes | | Industrials | 165.07 | 39 | 6.71% | -5.24% |
| KFRC | Kforce | | Services & Goods | 64.00 | 18 | -0.12% | -5.27% |
| RLJ | RLJ Lodging | | Financials | 11.10 | 40 | -2.46% | -5.29% |
| IVAC | Intevac | | Technology | 4.09 | 24 | 10.54% | -5.32% |
| FOR | Forestar Group | | Financials | 31.31 | 23 | 0.51% | -5.32% |


| Too many stocks? View smallcap stocks filtered by marketcap & sector |
| Marketcap: All SmallCap Stocks (default-no microcap), Large, Mid-Range, Small |
| Smallcap Sector: Tech, Finance, Energy, Staples, Retail, Industrial, Materials, & Medical |
|
Get the most comprehensive stock market coverage daily at 12Stocks.com ➞ Best Stocks Today ➞ Best Stocks Weekly ➞ Best Stocks Year-to-Date ➞ Best Stocks Trends ➞  Best Stocks Today 12Stocks.com Best Nasdaq Stocks ➞ Best S&P 500 Stocks ➞ Best Tech Stocks ➞ Best Biotech Stocks ➞ |
| Detailed Overview of SmallCap Stocks |
| SmallCap Technical Overview, Leaders & Laggards, Top SmallCap ETF Funds & Detailed SmallCap Stocks List, Charts, Trends & More |
| Smallcap: Technical Analysis, Trends & YTD Performance | |
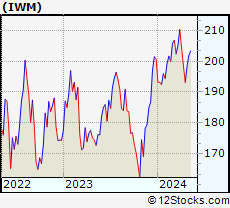
| SmallCap segment as represented by
IWM, an exchange-traded fund [ETF], holds basket of thousands of smallcap stocks from across all major sectors of the US stock market. The smallcap index (contains stocks like Riverbed & Sotheby's) is down by -2.11% and is currently underperforming the overall market by -7.27% year-to-date. Below is a quick view of technical charts and trends: | |
 IWM Weekly Chart |
|
| Long Term Trend: Good | |
| Medium Term Trend: Not Good | |
 IWM Daily Chart |
|
| Short Term Trend: Very Good | |
| Overall Trend Score: 44 | |
| YTD Performance: -2.11% | |
| **Trend Scores & Views Are Only For Educational Purposes And Not For Investing | |
| 12Stocks.com: Top Performing Small Cap Index Stocks | ||||||||||||||||||||||||||||||||||||||||||||||||
 The top performing Small Cap Index stocks year to date are
Now, more recently, over last week, the top performing Small Cap Index stocks on the move are


|
||||||||||||||||||||||||||||||||||||||||||||||||
| 12Stocks.com: Investing in Smallcap Index using Exchange Traded Funds | |
|
The following table shows list of key exchange traded funds (ETF) that
help investors track Smallcap index. The following list also includes leveraged ETF funds that track twice or thrice the daily returns of Smallcap indices. Short or inverse ETF funds move in the opposite direction to the index they track and are useful during market pullbacks or during bear markets. Quick View: Move mouse or cursor over ETF symbol (ticker) to view short-term technical chart and over ETF name to view long term chart. Click on ticker or stock name for detailed view. Click on to add stock symbol to your watchlist and to view watchlist. |
12Stocks.com List of ETFs that track Smallcap Index
| Ticker | ETF Name | Watchlist | Recent Price | Smart Investing & Trading Score | Change % | Week % | Year-to-date % |
| IWM | iShares Russell 2000 | | 196.48 | 44 | -0.61 | 1.73 | -2.11% |
| IJR | iShares Core S&P Small-Cap | | 104.86 | 78 | -0.80 | 1.59 | -3.13% |
| VTWO | Vanguard Russell 2000 ETF | | 79.45 | 63 | -0.60 | 1.75 | -2.03% |
| IWN | iShares Russell 2000 Value | | 150.18 | 68 | -0.73 | 1.62 | -3.32% |
| IWO | iShares Russell 2000 Growth | | 249.86 | 51 | -0.56 | 1.86 | -0.94% |
| IJS | iShares S&P Small-Cap 600 Value | | 96.69 | 60 | -1.04 | 1.13 | -6.19% |
| IJT | iShares S&P Small-Cap 600 Growth | | 125.06 | 63 | -0.25 | 2.33 | -0.06% |
| XSLV | PowerShares S&P SmallCap Low Volatil ETF | | 42.54 | 73 | -0.93 | 0.85 | -3.65% |
| SDD | ProShares UltraShort SmallCap600 | | 19.58 | 42 | 0.46 | -3.74 | 6.26% |
| SBB | ProShares Short SmallCap600 | | 16.50 | 40 | 0.79 | -2.02 | 3.58% |
| SMLV | SPDR SSGA US Small Cap Low Volatil ETF | | 107.33 | 73 | -1.01 | 1.17 | -4.61% |
| SAA | ProShares Ultra SmallCap600 | | 22.66 | 58 | -1.52 | 3.94 | -9.18% |
| 12Stocks.com: Charts, Trends, Fundamental Data and Performances of SmallCap Stocks | |
|
We now take in-depth look at all SmallCap stocks including charts, multi-period performances and overall trends (as measured by Smart Investing & Trading Score). One can sort SmallCap stocks (click link to choose) by Daily, Weekly and by Year-to-Date performances. Also, one can sort by size of the company or by market capitalization. |
| Select Your Default Chart Type: | |||||
| |||||
| Click on stock symbol or name for detailed view. Click on to add stock symbol to your watchlist and to view watchlist. Quick View: Move mouse or cursor over "Daily" to quickly view daily technical stock chart and over "Weekly" to view weekly technical stock chart. | |||||

 | ITOS iTeos Therapeutics, Inc. |
| Sector: Health Care | |
| SubSector: Biotechnology | |
| MarketCap: 10487 Millions | |
| Recent Price: 10.45 Smart Investing & Trading Score: 61 | |
| Day Percent Change: -1.23% Day Change: -0.13 | |
| Week Change: 2% Year-to-date Change: -4.5% | |
| ITOS Links: Profile News Message Board | |
| Charts:- Daily , Weekly | |
| Add ITOS to Watchlist: View: Get Complete ITOS Trend Analysis ➞ | |
 | THRM Gentherm Incorporated |
| Sector: Consumer Staples | |
| SubSector: Auto Parts | |
| MarketCap: 1032.59 Millions | |
| Recent Price: 50.01 Smart Investing & Trading Score: 61 | |
| Day Percent Change: -1.44% Day Change: -0.73 | |
| Week Change: 0.04% Year-to-date Change: -4.5% | |
| THRM Links: Profile News Message Board | |
| Charts:- Daily , Weekly | |
| Add THRM to Watchlist: View: Get Complete THRM Trend Analysis ➞ | |
 | AXGN AxoGen, Inc. |
| Sector: Health Care | |
| SubSector: Medical Appliances & Equipment | |
| MarketCap: 349.28 Millions | |
| Recent Price: 6.52 Smart Investing & Trading Score: 35 | |
| Day Percent Change: -5.09% Day Change: -0.35 | |
| Week Change: 0.31% Year-to-date Change: -4.5% | |
| AXGN Links: Profile News Message Board | |
| Charts:- Daily , Weekly | |
| Add AXGN to Watchlist: View: Get Complete AXGN Trend Analysis ➞ | |
 | VRTS Virtus Investment Partners, Inc. |
| Sector: Financials | |
| SubSector: Asset Management | |
| MarketCap: 601.303 Millions | |
| Recent Price: 230.75 Smart Investing & Trading Score: 37 | |
| Day Percent Change: -1.68% Day Change: -3.95 | |
| Week Change: 2.4% Year-to-date Change: -4.6% | |
| VRTS Links: Profile News Message Board | |
| Charts:- Daily , Weekly | |
| Add VRTS to Watchlist: View: Get Complete VRTS Trend Analysis ➞ | |
 | CHCO City Holding Company |
| Sector: Financials | |
| SubSector: Regional - Mid-Atlantic Banks | |
| MarketCap: 1059.59 Millions | |
| Recent Price: 105.21 Smart Investing & Trading Score: 93 | |
| Day Percent Change: -0.88% Day Change: -0.93 | |
| Week Change: 2.14% Year-to-date Change: -4.6% | |
| CHCO Links: Profile News Message Board | |
| Charts:- Daily , Weekly | |
| Add CHCO to Watchlist: View: Get Complete CHCO Trend Analysis ➞ | |
 | NXRT NexPoint Residential Trust, Inc. |
| Sector: Financials | |
| SubSector: REIT - Residential | |
| MarketCap: 839.161 Millions | |
| Recent Price: 32.85 Smart Investing & Trading Score: 80 | |
| Day Percent Change: -1.35% Day Change: -0.45 | |
| Week Change: 2.3% Year-to-date Change: -4.6% | |
| NXRT Links: Profile News Message Board | |
| Charts:- Daily , Weekly | |
| Add NXRT to Watchlist: View: Get Complete NXRT Trend Analysis ➞ | |
 | EHAB Enhabit, Inc. |
| Sector: Health Care | |
| SubSector: Medical Care Facilities | |
| MarketCap: 569 Millions | |
| Recent Price: 9.87 Smart Investing & Trading Score: 33 | |
| Day Percent Change: -2.03% Day Change: -0.21 | |
| Week Change: -3.71% Year-to-date Change: -4.6% | |
| EHAB Links: Profile News Message Board | |
| Charts:- Daily , Weekly | |
| Add EHAB to Watchlist: View: Get Complete EHAB Trend Analysis ➞ | |
 | NPO EnPro Industries, Inc. |
| Sector: Industrials | |
| SubSector: Industrial Equipment & Components | |
| MarketCap: 734.309 Millions | |
| Recent Price: 149.38 Smart Investing & Trading Score: 51 | |
| Day Percent Change: -1.09% Day Change: -1.65 | |
| Week Change: 0.24% Year-to-date Change: -4.7% | |
| NPO Links: Profile News Message Board | |
| Charts:- Daily , Weekly | |
| Add NPO to Watchlist: View: Get Complete NPO Trend Analysis ➞ | |
 | AVDX AvidXchange Holdings, Inc. |
| Sector: Technology | |
| SubSector: Software - Infrastructure | |
| MarketCap: 2120 Millions | |
| Recent Price: 11.83 Smart Investing & Trading Score: 58 | |
| Day Percent Change: -1.66% Day Change: -0.20 | |
| Week Change: 3.32% Year-to-date Change: -4.7% | |
| AVDX Links: Profile News Message Board | |
| Charts:- Daily , Weekly | |
| Add AVDX to Watchlist: View: Get Complete AVDX Trend Analysis ➞ | |
 | LOCO El Pollo Loco Holdings, Inc. |
| Sector: Services & Goods | |
| SubSector: Restaurants | |
| MarketCap: 296.97 Millions | |
| Recent Price: 8.40 Smart Investing & Trading Score: 23 | |
| Day Percent Change: -0.36% Day Change: -0.03 | |
| Week Change: 0.96% Year-to-date Change: -4.8% | |
| LOCO Links: Profile News Message Board | |
| Charts:- Daily , Weekly | |
| Add LOCO to Watchlist: View: Get Complete LOCO Trend Analysis ➞ | |
 | SNDX Syndax Pharmaceuticals, Inc. |
| Sector: Health Care | |
| SubSector: Biotechnology | |
| MarketCap: 365.985 Millions | |
| Recent Price: 20.57 Smart Investing & Trading Score: 54 | |
| Day Percent Change: -1.06% Day Change: -0.22 | |
| Week Change: -1.11% Year-to-date Change: -4.8% | |
| SNDX Links: Profile News Message Board | |
| Charts:- Daily , Weekly | |
| Add SNDX to Watchlist: View: Get Complete SNDX Trend Analysis ➞ | |
 | ACDC ProFrac Holding Corp. |
| Sector: Energy | |
| SubSector: Oil & Gas Equipment & Services | |
| MarketCap: 1830 Millions | |
| Recent Price: 8.10 Smart Investing & Trading Score: 54 | |
| Day Percent Change: -0.49% Day Change: -0.04 | |
| Week Change: -0.12% Year-to-date Change: -4.8% | |
| ACDC Links: Profile News Message Board | |
| Charts:- Daily , Weekly | |
| Add ACDC to Watchlist: View: Get Complete ACDC Trend Analysis ➞ | |
 | MITK Mitek Systems, Inc. |
| Sector: Technology | |
| SubSector: Application Software | |
| MarketCap: 265.962 Millions | |
| Recent Price: 12.41 Smart Investing & Trading Score: 43 | |
| Day Percent Change: -1.97% Day Change: -0.25 | |
| Week Change: 1.89% Year-to-date Change: -4.8% | |
| MITK Links: Profile News Message Board | |
| Charts:- Daily , Weekly | |
| Add MITK to Watchlist: View: Get Complete MITK Trend Analysis ➞ | |
 | IVR Invesco Mortgage Capital Inc. |
| Sector: Financials | |
| SubSector: Mortgage Investment | |
| MarketCap: 1182.19 Millions | |
| Recent Price: 8.43 Smart Investing & Trading Score: 42 | |
| Day Percent Change: -2.09% Day Change: -0.18 | |
| Week Change: 2.18% Year-to-date Change: -4.9% | |
| IVR Links: Profile News Message Board | |
| Charts:- Daily , Weekly | |
| Add IVR to Watchlist: View: Get Complete IVR Trend Analysis ➞ | |
 | HWC Hancock Whitney Corporation |
| Sector: Financials | |
| SubSector: Regional - Southeast Banks | |
| MarketCap: 1438.55 Millions | |
| Recent Price: 46.18 Smart Investing & Trading Score: 80 | |
| Day Percent Change: -0.62% Day Change: -0.29 | |
| Week Change: 4.34% Year-to-date Change: -5.0% | |
| HWC Links: Profile News Message Board | |
| Charts:- Daily , Weekly | |
| Add HWC to Watchlist: View: Get Complete HWC Trend Analysis ➞ | |
 | SEAT Vivid Seats Inc. |
| Sector: Services & Goods | |
| SubSector: Internet Content & Information | |
| MarketCap: 1560 Millions | |
| Recent Price: 5.93 Smart Investing & Trading Score: 68 | |
| Day Percent Change: 2.24% Day Change: 0.13 | |
| Week Change: 0.68% Year-to-date Change: -5.0% | |
| SEAT Links: Profile News Message Board | |
| Charts:- Daily , Weekly | |
| Add SEAT to Watchlist: View: Get Complete SEAT Trend Analysis ➞ | |
 | EXLS ExlService Holdings, Inc. |
| Sector: Technology | |
| SubSector: Information Technology Services | |
| MarketCap: 1781.78 Millions | |
| Recent Price: 29.31 Smart Investing & Trading Score: 35 | |
| Day Percent Change: -0.88% Day Change: -0.26 | |
| Week Change: -0.03% Year-to-date Change: -5.0% | |
| EXLS Links: Profile News Message Board | |
| Charts:- Daily , Weekly | |
| Add EXLS to Watchlist: View: Get Complete EXLS Trend Analysis ➞ | |
 | ALG Alamo Group Inc. |
| Sector: Industrials | |
| SubSector: Farm & Construction Machinery | |
| MarketCap: 964.107 Millions | |
| Recent Price: 199.63 Smart Investing & Trading Score: 10 | |
| Day Percent Change: -2.24% Day Change: -4.57 | |
| Week Change: -1.34% Year-to-date Change: -5.0% | |
| ALG Links: Profile News Message Board | |
| Charts:- Daily , Weekly | |
| Add ALG to Watchlist: View: Get Complete ALG Trend Analysis ➞ | |
 | CNO CNO Financial Group, Inc. |
| Sector: Financials | |
| SubSector: Accident & Health Insurance | |
| MarketCap: 1746.9 Millions | |
| Recent Price: 26.45 Smart Investing & Trading Score: 57 | |
| Day Percent Change: -1.64% Day Change: -0.44 | |
| Week Change: 0.99% Year-to-date Change: -5.2% | |
| CNO Links: Profile News Message Board | |
| Charts:- Daily , Weekly | |
| Add CNO to Watchlist: View: Get Complete CNO Trend Analysis ➞ | |
 | PAGS PagSeguro Digital Ltd. |
| Sector: Financials | |
| SubSector: Credit Services | |
| MarketCap: 6500.78 Millions | |
| Recent Price: 11.82 Smart Investing & Trading Score: 10 | |
| Day Percent Change: 1.11% Day Change: 0.13 | |
| Week Change: 2.96% Year-to-date Change: -5.2% | |
| PAGS Links: Profile News Message Board | |
| Charts:- Daily , Weekly | |
| Add PAGS to Watchlist: View: Get Complete PAGS Trend Analysis ➞ | |
 | MTH Meritage Homes Corporation |
| Sector: Industrials | |
| SubSector: Residential Construction | |
| MarketCap: 1440.36 Millions | |
| Recent Price: 165.07 Smart Investing & Trading Score: 39 | |
| Day Percent Change: 6.71% Day Change: 10.38 | |
| Week Change: 9.73% Year-to-date Change: -5.2% | |
| MTH Links: Profile News Message Board | |
| Charts:- Daily , Weekly | |
| Add MTH to Watchlist: View: Get Complete MTH Trend Analysis ➞ | |
 | KFRC Kforce Inc. |
| Sector: Services & Goods | |
| SubSector: Staffing & Outsourcing Services | |
| MarketCap: 622.828 Millions | |
| Recent Price: 64.00 Smart Investing & Trading Score: 18 | |
| Day Percent Change: -0.12% Day Change: -0.08 | |
| Week Change: 0.69% Year-to-date Change: -5.3% | |
| KFRC Links: Profile News Message Board | |
| Charts:- Daily , Weekly | |
| Add KFRC to Watchlist: View: Get Complete KFRC Trend Analysis ➞ | |
 | RLJ RLJ Lodging Trust |
| Sector: Financials | |
| SubSector: REIT - Hotel/Motel | |
| MarketCap: 1019.34 Millions | |
| Recent Price: 11.10 Smart Investing & Trading Score: 40 | |
| Day Percent Change: -2.46% Day Change: -0.28 | |
| Week Change: 0.54% Year-to-date Change: -5.3% | |
| RLJ Links: Profile News Message Board | |
| Charts:- Daily , Weekly | |
| Add RLJ to Watchlist: View: Get Complete RLJ Trend Analysis ➞ | |
 | IVAC Intevac, Inc. |
| Sector: Technology | |
| SubSector: Diversified Electronics | |
| MarketCap: 89.2396 Millions | |
| Recent Price: 4.09 Smart Investing & Trading Score: 24 | |
| Day Percent Change: 10.54% Day Change: 0.39 | |
| Week Change: 13.3% Year-to-date Change: -5.3% | |
| IVAC Links: Profile News Message Board | |
| Charts:- Daily , Weekly | |
| Add IVAC to Watchlist: View: Get Complete IVAC Trend Analysis ➞ | |
 | FOR Forestar Group Inc. |
| Sector: Financials | |
| SubSector: Real Estate Development | |
| MarketCap: 661.019 Millions | |
| Recent Price: 31.31 Smart Investing & Trading Score: 23 | |
| Day Percent Change: 0.51% Day Change: 0.16 | |
| Week Change: -0.95% Year-to-date Change: -5.3% | |
| FOR Links: Profile News Message Board | |
| Charts:- Daily , Weekly | |
| Add FOR to Watchlist: View: Get Complete FOR Trend Analysis ➞ | |
| Too many stocks? View smallcap stocks filtered by marketcap & sector |
| Marketcap: All SmallCap Stocks (default-no microcap), Large, Mid-Range, Small & MicroCap |
| Sector: Tech, Finance, Energy, Staples, Retail, Industrial, Materials, Utilities & Medical |
|
Best Stocks Today 12Stocks.com |
© 2024 12Stocks.com Terms & Conditions Privacy Contact Us
All Information Provided Only For Education And Not To Be Used For Investing or Trading. See Terms & Conditions


One More Thing ... Get Best Stocks Delivered Daily!
Never Ever Miss A Move With Our Top Ten Stocks Lists
Find Best Stocks In Any Market - Bull or Bear Market
Take A Peek At Our Top Ten Stocks Lists: Daily, Weekly, Year-to-Date & Top Trends
Find Best Stocks In Any Market - Bull or Bear Market
Take A Peek At Our Top Ten Stocks Lists: Daily, Weekly, Year-to-Date & Top Trends
Smallcap Stocks With Best Up Trends [0-bearish to 100-bullish]: B. Riley[100], Central Pacific[100], California Water[100], Cricut [100], Carpenter [100], Haemonetics [100], Sanmina [100], Trustmark [100], Comstock Resources[100], EchoStar [100], Mueller Industries[100]
Best Smallcap Stocks Year-to-Date:
CareMax [490.72%], Janux [338.34%], Viking [270.02%], Alpine Immune[239.52%], Longboard [218%], Super Micro[177%], Arcutis Bio[166.56%], Avidity Biosciences[159.79%], Vera [149.94%], Hippo [128.87%], Stoke [122.15%] Best Smallcap Stocks This Week:
Matterport [168.97%], B. Riley[73.54%], Impinj [33.73%], ProKidney [32.84%], Seres [32.65%], Riot Blockchain[32.64%], Ribbon [25.58%], Cullinan Oncology[22.92%], P.A.M. Transportation[22.85%], NuScale Power[21.44%], Hibbett Sports[21.03%] Best Smallcap Stocks Daily:
Impinj [28.65%], P.A.M. Transportation[17.95%], B. Riley[16.61%], Strategic Education[16.28%], OptiNose [14.56%], JELD-WEN Holding[11.54%], Sonic Automotive[10.86%], Intevac [10.54%], SiTime [8.84%], Noodles & [8.08%], ProKidney [7.75%]