
 Login Sign Up


| |||||
 |  | ||||

| 12Stocks.com Market Intelligence |
Best SmallCap Stocks
|
| In a hurry? Small Cap Stock Lists: Performance Trends Table, Stock Charts
Sort Small Cap stocks: Daily, Weekly, Year-to-Date, Market Cap & Trends. Filter Small Cap stocks list by sector: Show all, Tech, Finance, Energy, Staples, Retail, Industrial, Materials, Utilities and HealthCare Filter Small Cap stocks list by size: All Large Medium Small and MicroCap |
| 12Stocks.com Small Cap Stocks Performances & Trends Daily | |||||||||
|
|  The overall Smart Investing & Trading Score is 23 (0-bearish to 100-bullish) which puts Small Cap index in short term bearish to neutral trend. The Smart Investing & Trading Score from previous trading session is 13 and an improvement of trend continues.
| ||||||||
Here are the Smart Investing & Trading Scores of the most requested small cap stocks at 12Stocks.com (click stock name for detailed review):
|


| 12Stocks.com: Investing in Smallcap Index with Stocks | |
|
The following table helps investors and traders sort through current performance and trends (as measured by Smart Investing & Trading Score) of various
stocks in the Smallcap Index. Quick View: Move mouse or cursor over stock symbol (ticker) to view short-term technical chart and over stock name to view long term chart. Click on  to add stock symbol to your watchlist and to add stock symbol to your watchlist and  to view watchlist. Click on any ticker or stock name for detailed market intelligence report for that stock. to view watchlist. Click on any ticker or stock name for detailed market intelligence report for that stock. |
12Stocks.com Performance of Stocks in Smallcap Index
| Ticker | Stock Name | Watchlist | Category | Recent Price | Smart Investing & Trading Score | Change % | YTD Change% |
| CHGG | Chegg |   | Services & Goods | 7.21 | 47 | 2.49% | -36.58% |
| IAS | Integral Ad | | Services & Goods | 9.18 | 10 | -3.37% | -36.82% |
| ACRE | Ares Commercial | | Financials | 6.53 | 35 | 1.87% | -36.97% |
| DCGO | DocGo | | Health Care | 3.52 | 47 | 0.72% | -37.03% |
| DMRC | Digimarc | | Technology | 22.74 | 27 | -1.09% | -37.04% |
| AMPH | Amphastar | | Health Care | 38.92 | 10 | 0.70% | -37.07% |
| EXFY | Expensify | | Technology | 1.59 | 47 | -8.91% | -37.10% |
| DHC | Diversified Healthcare | | Financials | 2.35 | 0 | -0.42% | -37.17% |
| SAGE | Sage | | Health Care | 13.49 | 17 | 3.49% | -37.75% |
| EXTR | Extreme s | | Technology | 10.91 | 10 | -0.23% | -38.12% |
| COUR | Coursera | | Consumer Staples | 12.16 | 42 | 1.12% | -38.16% |
| KLTR | Kaltura | | Technology | 1.21 | 17 | 1.68% | -38.27% |
| EB | Eventbrite | | Technology | 5.16 | 25 | 0.19% | -38.28% |
| ACHR | Archer Aviation | | Industrials | 3.75 | 10 | -1.57% | -38.64% |
| HCAT | Health Catalyst | | Technology | 5.67 | 32 | -0.44% | -38.77% |
| BBIO | BridgeBio Pharma | | Health Care | 24.71 | 10 | -0.96% | -38.79% |
| AKTS | Akoustis | | Technology | 0.51 | 25 | -3.70% | -38.85% |
| SFIX | Stitch Fix | | Services & Goods | 2.18 | 15 | -0.46% | -38.94% |
| BIGC | BigCommerce | | Technology | 5.95 | 32 | 0.25% | -38.96% |
| PSTX | Poseida | | Health Care | 2.05 | 32 | 2.24% | -39.08% |
| ME | 23andMe Holding | | Health Care | 0.54 | 62 | -8.41% | -39.30% |
| PKST | Peakstone Realty | | Financials | 12.42 | 10 | -0.48% | -39.47% |
| CABA | Cabaletta Bio | | Health Care | 13.73 | 0 | -1.65% | -39.52% |
| GH | Guardant Health | | Health Care | 16.30 | 18 | -2.22% | -39.74% |
| GWH | ESS Tech | | Industrials | 0.69 | 40 | 3.70% | -39.83% |
| For chart view version of above stock list: Chart View ➞ 0 - 25 , 25 - 50 , 50 - 75 , 75 - 100 , 100 - 125 , 125 - 150 , 150 - 175 , 175 - 200 , 200 - 225 , 225 - 250 , 250 - 275 , 275 - 300 , 300 - 325 , 325 - 350 , 350 - 375 , 375 - 400 , 400 - 425 , 425 - 450 , 450 - 475 , 475 - 500 , 500 - 525 , 525 - 550 , 550 - 575 , 575 - 600 , 600 - 625 , 625 - 650 , 650 - 675 , 675 - 700 , 700 - 725 , 725 - 750 , 750 - 775 , 775 - 800 , 800 - 825 , 825 - 850 , 850 - 875 , 875 - 900 , 900 - 925 , 925 - 950 , 950 - 975 , 975 - 1000 , 1000 - 1025 , 1025 - 1050 , 1050 - 1075 , 1075 - 1100 , 1100 - 1125 , 1125 - 1150 , 1150 - 1175 , 1175 - 1200 , 1200 - 1225 , 1225 - 1250 , 1250 - 1275 , 1275 - 1300 , 1300 - 1325 , 1325 - 1350 , 1350 - 1375 , 1375 - 1400 , 1400 - 1425 , 1425 - 1450 , 1450 - 1475 , 1475 - 1500 , 1500 - 1525 , 1525 - 1550 , 1550 - 1575 , 1575 - 1600 , 1600 - 1625 | ||
 | Click To Change The Sort Order: By Market Cap or Company Size Performance: Year-to-date, Week and Day |  |
| Too many stocks? View smallcap stocks filtered by marketcap & sector |
| Marketcap: All SmallCap Stocks (default-no microcap), Large, Mid-Range, Small |
| Smallcap Sector: Tech, Finance, Energy, Staples, Retail, Industrial, Materials, & Medical |
|
Get the most comprehensive stock market coverage daily at 12Stocks.com ➞ Best Stocks Today ➞ Best Stocks Weekly ➞ Best Stocks Year-to-Date ➞ Best Stocks Trends ➞  Best Stocks Today 12Stocks.com Best Nasdaq Stocks ➞ Best S&P 500 Stocks ➞ Best Tech Stocks ➞ Best Biotech Stocks ➞ |
| Detailed Overview of SmallCap Stocks |
| SmallCap Technical Overview, Leaders & Laggards, Top SmallCap ETF Funds & Detailed SmallCap Stocks List, Charts, Trends & More |
| Smallcap: Technical Analysis, Trends & YTD Performance | |
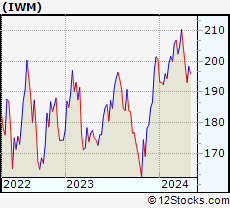
| SmallCap segment as represented by
IWM, an exchange-traded fund [ETF], holds basket of thousands of smallcap stocks from across all major sectors of the US stock market. The smallcap index (contains stocks like Riverbed & Sotheby's) is down by -3.67% and is currently underperforming the overall market by -7.75% year-to-date. Below is a quick view of technical charts and trends: | |
 IWM Weekly Chart |
|
| Long Term Trend: Good | |
| Medium Term Trend: Not Good | |
 IWM Daily Chart |
|
| Short Term Trend: Deteriorating | |
| Overall Trend Score: 23 | |
| YTD Performance: -3.67% | |
| **Trend Scores & Views Are Only For Educational Purposes And Not For Investing | |
| 12Stocks.com: Top Performing Small Cap Index Stocks | ||||||||||||||||||||||||||||||||||||||||||||||||
 The top performing Small Cap Index stocks year to date are
Now, more recently, over last week, the top performing Small Cap Index stocks on the move are


|
||||||||||||||||||||||||||||||||||||||||||||||||
| 12Stocks.com: Investing in Smallcap Index using Exchange Traded Funds | |
|
The following table shows list of key exchange traded funds (ETF) that
help investors track Smallcap index. The following list also includes leveraged ETF funds that track twice or thrice the daily returns of Smallcap indices. Short or inverse ETF funds move in the opposite direction to the index they track and are useful during market pullbacks or during bear markets. Quick View: Move mouse or cursor over ETF symbol (ticker) to view short-term technical chart and over ETF name to view long term chart. Click on ticker or stock name for detailed view. Click on to add stock symbol to your watchlist and to view watchlist. |
12Stocks.com List of ETFs that track Smallcap Index
| Ticker | ETF Name | Watchlist | Recent Price | Smart Investing & Trading Score | Change % | Week % | Year-to-date % |
| IWM | iShares Russell 2000 | | 193.34 | 23 | 0.26 | -2.69 | -3.67% |
| SAA | ProShares Ultra SmallCap600 | | 21.83 | 18 | 0.97 | -3.24 | -12.51% |
| SDD | ProShares UltraShort SmallCap600 | | 20.42 | 76 | -1.30 | 2.97 | 10.82% |
| SMLV | SPDR SSGA US Small Cap Low Volatil ETF | | 105.38 | 32 | 1.49 | 0.35 | -6.35% |
| SBB | ProShares Short SmallCap600 | | 16.80 | 76 | -1.08 | 1.51 | 5.44% |
| 12Stocks.com: Charts, Trends, Fundamental Data and Performances of SmallCap Stocks | |
|
We now take in-depth look at all SmallCap stocks including charts, multi-period performances and overall trends (as measured by Smart Investing & Trading Score). One can sort SmallCap stocks (click link to choose) by Daily, Weekly and by Year-to-Date performances. Also, one can sort by size of the company or by market capitalization. |
| Select Your Default Chart Type: | |||||
| |||||
| Click on stock symbol or name for detailed view. Click on to add stock symbol to your watchlist and to view watchlist. Quick View: Move mouse or cursor over "Daily" to quickly view daily technical stock chart and over "Weekly" to view weekly technical stock chart. | |||||

 | CHGG Chegg, Inc. |
| Sector: Services & Goods | |
| SubSector: Education & Training Services | |
| MarketCap: 3606.86 Millions | |
| Recent Price: 7.21 Smart Investing & Trading Score: 47 | |
| Day Percent Change: 2.49% Day Change: 0.17 | |
| Week Change: 0.77% Year-to-date Change: -36.6% | |
| CHGG Links: Profile News Message Board | |
| Charts:- Daily , Weekly | |
| Add CHGG to Watchlist: View: Get Complete CHGG Trend Analysis ➞ | |
 | IAS Integral Ad Science Holding Corp. |
| Sector: Services & Goods | |
| SubSector: Advertising Agencies | |
| MarketCap: 2760 Millions | |
| Recent Price: 9.18 Smart Investing & Trading Score: 10 | |
| Day Percent Change: -3.37% Day Change: -0.32 | |
| Week Change: -6.99% Year-to-date Change: -36.8% | |
| IAS Links: Profile News Message Board | |
| Charts:- Daily , Weekly | |
| Add IAS to Watchlist: View: Get Complete IAS Trend Analysis ➞ | |
 | ACRE Ares Commercial Real Estate Corporation |
| Sector: Financials | |
| SubSector: Mortgage Investment | |
| MarketCap: 242.339 Millions | |
| Recent Price: 6.53 Smart Investing & Trading Score: 35 | |
| Day Percent Change: 1.87% Day Change: 0.12 | |
| Week Change: -6.98% Year-to-date Change: -37.0% | |
| ACRE Links: Profile News Message Board | |
| Charts:- Daily , Weekly | |
| Add ACRE to Watchlist: View: Get Complete ACRE Trend Analysis ➞ | |
 | DCGO DocGo Inc. |
| Sector: Health Care | |
| SubSector: Medical Care Facilities | |
| MarketCap: 972 Millions | |
| Recent Price: 3.52 Smart Investing & Trading Score: 47 | |
| Day Percent Change: 0.72% Day Change: 0.02 | |
| Week Change: 7.98% Year-to-date Change: -37.0% | |
| DCGO Links: Profile News Message Board | |
| Charts:- Daily , Weekly | |
| Add DCGO to Watchlist: View: Get Complete DCGO Trend Analysis ➞ | |
 | DMRC Digimarc Corporation |
| Sector: Technology | |
| SubSector: Information Technology Services | |
| MarketCap: 222.268 Millions | |
| Recent Price: 22.74 Smart Investing & Trading Score: 27 | |
| Day Percent Change: -1.09% Day Change: -0.25 | |
| Week Change: -2.94% Year-to-date Change: -37.0% | |
| DMRC Links: Profile News Message Board | |
| Charts:- Daily , Weekly | |
| Add DMRC to Watchlist: View: Get Complete DMRC Trend Analysis ➞ | |
 | AMPH Amphastar Pharmaceuticals, Inc. |
| Sector: Health Care | |
| SubSector: Drug Manufacturers - Other | |
| MarketCap: 655.533 Millions | |
| Recent Price: 38.92 Smart Investing & Trading Score: 10 | |
| Day Percent Change: 0.70% Day Change: 0.27 | |
| Week Change: -1.77% Year-to-date Change: -37.1% | |
| AMPH Links: Profile News Message Board | |
| Charts:- Daily , Weekly | |
| Add AMPH to Watchlist: View: Get Complete AMPH Trend Analysis ➞ | |
 | EXFY Expensify, Inc. |
| Sector: Technology | |
| SubSector: Software - Application | |
| MarketCap: 678 Millions | |
| Recent Price: 1.59 Smart Investing & Trading Score: 47 | |
| Day Percent Change: -8.91% Day Change: -0.16 | |
| Week Change: 7.82% Year-to-date Change: -37.1% | |
| EXFY Links: Profile News Message Board | |
| Charts:- Daily , Weekly | |
| Add EXFY to Watchlist: View: Get Complete EXFY Trend Analysis ➞ | |
 | DHC Diversified Healthcare Trust |
| Sector: Financials | |
| SubSector: REIT - Healthcare Facilities | |
| MarketCap: 814.114 Millions | |
| Recent Price: 2.35 Smart Investing & Trading Score: 0 | |
| Day Percent Change: -0.42% Day Change: -0.01 | |
| Week Change: -7.11% Year-to-date Change: -37.2% | |
| DHC Links: Profile News Message Board | |
| Charts:- Daily , Weekly | |
| Add DHC to Watchlist: View: Get Complete DHC Trend Analysis ➞ | |
 | SAGE Sage Therapeutics, Inc. |
| Sector: Health Care | |
| SubSector: Biotechnology | |
| MarketCap: 1683.75 Millions | |
| Recent Price: 13.49 Smart Investing & Trading Score: 17 | |
| Day Percent Change: 3.49% Day Change: 0.46 | |
| Week Change: -12.63% Year-to-date Change: -37.8% | |
| SAGE Links: Profile News Message Board | |
| Charts:- Daily , Weekly | |
| Add SAGE to Watchlist: View: Get Complete SAGE Trend Analysis ➞ | |
 | EXTR Extreme Networks, Inc. |
| Sector: Technology | |
| SubSector: Communication Equipment | |
| MarketCap: 339.939 Millions | |
| Recent Price: 10.91 Smart Investing & Trading Score: 10 | |
| Day Percent Change: -0.23% Day Change: -0.03 | |
| Week Change: -1.4% Year-to-date Change: -38.1% | |
| EXTR Links: Profile News Message Board | |
| Charts:- Daily , Weekly | |
| Add EXTR to Watchlist: View: Get Complete EXTR Trend Analysis ➞ | |
 | COUR Coursera, Inc. |
| Sector: Consumer Staples | |
| SubSector: Education & Training Services | |
| MarketCap: 1990 Millions | |
| Recent Price: 12.16 Smart Investing & Trading Score: 42 | |
| Day Percent Change: 1.12% Day Change: 0.13 | |
| Week Change: -7.18% Year-to-date Change: -38.2% | |
| COUR Links: Profile News Message Board | |
| Charts:- Daily , Weekly | |
| Add COUR to Watchlist: View: Get Complete COUR Trend Analysis ➞ | |
 | KLTR Kaltura, Inc. |
| Sector: Technology | |
| SubSector: Software - Application | |
| MarketCap: 293 Millions | |
| Recent Price: 1.21 Smart Investing & Trading Score: 17 | |
| Day Percent Change: 1.68% Day Change: 0.02 | |
| Week Change: -8.33% Year-to-date Change: -38.3% | |
| KLTR Links: Profile News Message Board | |
| Charts:- Daily , Weekly | |
| Add KLTR to Watchlist: View: Get Complete KLTR Trend Analysis ➞ | |
 | EB Eventbrite, Inc. |
| Sector: Technology | |
| SubSector: Application Software | |
| MarketCap: 805.262 Millions | |
| Recent Price: 5.16 Smart Investing & Trading Score: 25 | |
| Day Percent Change: 0.19% Day Change: 0.01 | |
| Week Change: -5.32% Year-to-date Change: -38.3% | |
| EB Links: Profile News Message Board | |
| Charts:- Daily , Weekly | |
| Add EB to Watchlist: View: Get Complete EB Trend Analysis ➞ | |
 | ACHR Archer Aviation Inc. |
| Sector: Industrials | |
| SubSector: Aerospace & Defense | |
| MarketCap: 976 Millions | |
| Recent Price: 3.75 Smart Investing & Trading Score: 10 | |
| Day Percent Change: -1.57% Day Change: -0.06 | |
| Week Change: -6.36% Year-to-date Change: -38.6% | |
| ACHR Links: Profile News Message Board | |
| Charts:- Daily , Weekly | |
| Add ACHR to Watchlist: View: Get Complete ACHR Trend Analysis ➞ | |
 | HCAT Health Catalyst, Inc. |
| Sector: Technology | |
| SubSector: Healthcare Information Services | |
| MarketCap: 983.955 Millions | |
| Recent Price: 5.67 Smart Investing & Trading Score: 32 | |
| Day Percent Change: -0.44% Day Change: -0.03 | |
| Week Change: -6.9% Year-to-date Change: -38.8% | |
| HCAT Links: Profile News Message Board | |
| Charts:- Daily , Weekly | |
| Add HCAT to Watchlist: View: Get Complete HCAT Trend Analysis ➞ | |
 | BBIO BridgeBio Pharma, Inc. |
| Sector: Health Care | |
| SubSector: Biotechnology | |
| MarketCap: 3879.35 Millions | |
| Recent Price: 24.71 Smart Investing & Trading Score: 10 | |
| Day Percent Change: -0.96% Day Change: -0.24 | |
| Week Change: -7.9% Year-to-date Change: -38.8% | |
| BBIO Links: Profile News Message Board | |
| Charts:- Daily , Weekly | |
| Add BBIO to Watchlist: View: Get Complete BBIO Trend Analysis ➞ | |
 | AKTS Akoustis Technologies, Inc. |
| Sector: Technology | |
| SubSector: Communication Equipment | |
| MarketCap: 197.039 Millions | |
| Recent Price: 0.51 Smart Investing & Trading Score: 25 | |
| Day Percent Change: -3.70% Day Change: -0.02 | |
| Week Change: -11.01% Year-to-date Change: -38.9% | |
| AKTS Links: Profile News Message Board | |
| Charts:- Daily , Weekly | |
| Add AKTS to Watchlist: View: Get Complete AKTS Trend Analysis ➞ | |
 | SFIX Stitch Fix, Inc. |
| Sector: Services & Goods | |
| SubSector: Specialty Retail, Other | |
| MarketCap: 1693.64 Millions | |
| Recent Price: 2.18 Smart Investing & Trading Score: 15 | |
| Day Percent Change: -0.46% Day Change: -0.01 | |
| Week Change: -5.63% Year-to-date Change: -38.9% | |
| SFIX Links: Profile News Message Board | |
| Charts:- Daily , Weekly | |
| Add SFIX to Watchlist: View: Get Complete SFIX Trend Analysis ➞ | |
 | BIGC BigCommerce Holdings, Inc. |
| Sector: Technology | |
| SubSector: Software Application | |
| MarketCap: 47587 Millions | |
| Recent Price: 5.95 Smart Investing & Trading Score: 32 | |
| Day Percent Change: 0.25% Day Change: 0.02 | |
| Week Change: -4.27% Year-to-date Change: -39.0% | |
| BIGC Links: Profile News Message Board | |
| Charts:- Daily , Weekly | |
| Add BIGC to Watchlist: View: Get Complete BIGC Trend Analysis ➞ | |
 | PSTX Poseida Therapeutics, Inc. |
| Sector: Health Care | |
| SubSector: Biotechnology | |
| MarketCap: 64487 Millions | |
| Recent Price: 2.05 Smart Investing & Trading Score: 32 | |
| Day Percent Change: 2.24% Day Change: 0.04 | |
| Week Change: -24.91% Year-to-date Change: -39.1% | |
| PSTX Links: Profile News Message Board | |
| Charts:- Daily , Weekly | |
| Add PSTX to Watchlist: View: Get Complete PSTX Trend Analysis ➞ | |
 | ME 23andMe Holding Co. |
| Sector: Health Care | |
| SubSector: Diagnostics & Research | |
| MarketCap: 802 Millions | |
| Recent Price: 0.54 Smart Investing & Trading Score: 62 | |
| Day Percent Change: -8.41% Day Change: -0.05 | |
| Week Change: 22.09% Year-to-date Change: -39.3% | |
| ME Links: Profile News Message Board | |
| Charts:- Daily , Weekly | |
| Add ME to Watchlist: View: Get Complete ME Trend Analysis ➞ | |
 | PKST Peakstone Realty Trust |
| Sector: Financials | |
| SubSector: REIT - Diversified | |
| MarketCap: 1050 Millions | |
| Recent Price: 12.42 Smart Investing & Trading Score: 10 | |
| Day Percent Change: -0.48% Day Change: -0.06 | |
| Week Change: -9.8% Year-to-date Change: -39.5% | |
| PKST Links: Profile News Message Board | |
| Charts:- Daily , Weekly | |
| Add PKST to Watchlist: View: Get Complete PKST Trend Analysis ➞ | |
 | CABA Cabaletta Bio, Inc. |
| Sector: Health Care | |
| SubSector: Biotechnology | |
| MarketCap: 222.085 Millions | |
| Recent Price: 13.73 Smart Investing & Trading Score: 0 | |
| Day Percent Change: -1.65% Day Change: -0.23 | |
| Week Change: -19.38% Year-to-date Change: -39.5% | |
| CABA Links: Profile News Message Board | |
| Charts:- Daily , Weekly | |
| Add CABA to Watchlist: View: Get Complete CABA Trend Analysis ➞ | |
 | GH Guardant Health, Inc. |
| Sector: Health Care | |
| SubSector: Medical Laboratories & Research | |
| MarketCap: 5678.7 Millions | |
| Recent Price: 16.30 Smart Investing & Trading Score: 18 | |
| Day Percent Change: -2.22% Day Change: -0.37 | |
| Week Change: -12.74% Year-to-date Change: -39.7% | |
| GH Links: Profile News Message Board | |
| Charts:- Daily , Weekly | |
| Add GH to Watchlist: View: Get Complete GH Trend Analysis ➞ | |
 | GWH ESS Tech, Inc. |
| Sector: Industrials | |
| SubSector: Electrical Equipment & Parts | |
| MarketCap: 239 Millions | |
| Recent Price: 0.69 Smart Investing & Trading Score: 40 | |
| Day Percent Change: 3.70% Day Change: 0.02 | |
| Week Change: 2.29% Year-to-date Change: -39.8% | |
| GWH Links: Profile News Message Board | |
| Charts:- Daily , Weekly | |
| Add GWH to Watchlist: View: Get Complete GWH Trend Analysis ➞ | |
| Too many stocks? View smallcap stocks filtered by marketcap & sector |
| Marketcap: All SmallCap Stocks (default-no microcap), Large, Mid-Range, Small & MicroCap |
| Sector: Tech, Finance, Energy, Staples, Retail, Industrial, Materials, Utilities & Medical |
|
Best Stocks Today 12Stocks.com |
© 2024 12Stocks.com Terms & Conditions Privacy Contact Us
All Information Provided Only For Education And Not To Be Used For Investing or Trading. See Terms & Conditions


One More Thing ... Get Best Stocks Delivered Daily!
Never Ever Miss A Move With Our Top Ten Stocks Lists
Find Best Stocks In Any Market - Bull or Bear Market
Take A Peek At Our Top Ten Stocks Lists: Daily, Weekly, Year-to-Date & Top Trends
Find Best Stocks In Any Market - Bull or Bear Market
Take A Peek At Our Top Ten Stocks Lists: Daily, Weekly, Year-to-Date & Top Trends
Smallcap Stocks With Best Up Trends [0-bearish to 100-bullish]: Humacyte [100], Victory Capital[100], Century Aluminum[100], Oscar Health[100], Mercury General[100], United Fire[100], Gannett Co[100], Old Second[100], Portland General[100], Lantheus [100], Target Hospitality[100]
Best Smallcap Stocks Year-to-Date:
Agenus [581.24%], CareMax [456.7%], Janux [343.37%], Alpine Immune[238.42%], Longboard [194.11%], Arcutis Bio[184.06%], Super Micro[176.22%], Avidity Biosciences[153.65%], Vera [147.87%], Hippo [123.38%], Stoke [121.48%] Best Smallcap Stocks This Week:
Macatawa Bank[44.89%], Humacyte [39.24%], ProKidney [37.43%], Snap One[29.79%], ALX Oncology[22.49%], 23andMe Holding[22.09%], Vanda [21.12%], ContextLogic [20%], Badger Meter[17.13%], Oscar Health[15.4%], Accolade [13.45%] Best Smallcap Stocks Daily:
Humacyte [23.57%], Metropolitan Bank[17.73%], Agenus [13.48%], Origin Materials[11.12%], Chemung Financial[9.48%], Pacific Biosciences[8.56%], Cohen & Steers[8.35%], Urban One[8.21%], Riot Blockchain[7.84%], Bar Harbor[7.71%], CareMax [7.57%]