
 Login Sign Up


| |||||
 |  | ||||

| 12Stocks.com Market Intelligence |
Best SmallCap Stocks
|
| In a hurry? Small Cap Stock Lists: Performance Trends Table, Stock Charts
Sort Small Cap stocks: Daily, Weekly, Year-to-Date, Market Cap & Trends. Filter Small Cap stocks list by sector: Show all, Tech, Finance, Energy, Staples, Retail, Industrial, Materials, Utilities and HealthCare Filter Small Cap stocks list by size: All Large Medium Small and MicroCap |
| 12Stocks.com Small Cap Stocks Performances & Trends Daily | |||||||||
|
|  The overall Smart Investing & Trading Score is 39 (0-bearish to 100-bullish) which puts Small Cap index in short term bearish to neutral trend. The Smart Investing & Trading Score from previous trading session is 41 and hence a deterioration of trend.
| ||||||||
Here are the Smart Investing & Trading Scores of the most requested small cap stocks at 12Stocks.com (click stock name for detailed review):
|


| 12Stocks.com: Investing in Smallcap Index with Stocks | |
|
The following table helps investors and traders sort through current performance and trends (as measured by Smart Investing & Trading Score) of various
stocks in the Smallcap Index. Quick View: Move mouse or cursor over stock symbol (ticker) to view short-term technical chart and over stock name to view long term chart. Click on  to add stock symbol to your watchlist and to add stock symbol to your watchlist and  to view watchlist. Click on any ticker or stock name for detailed market intelligence report for that stock. to view watchlist. Click on any ticker or stock name for detailed market intelligence report for that stock. |
12Stocks.com Performance of Stocks in Smallcap Index
| Ticker | Stock Name | Watchlist | Category | Recent Price | Smart Investing & Trading Score | Change % | YTD Change% |
| HBCP | Home Bancorp |   | Financials | 36.35 | 50 | 3.86% | -13.47% |
| PDLB | PDL Community | | Financials | 8.45 | 25 | 5.04% | -13.47% |
| CURV | Torrid | | Services & Goods | 5.06 | 50 | -0.20% | -13.50% |
| SMBK | SmartFinancial | | Financials | 21.18 | 62 | 3.07% | -13.52% |
| SBSI | Southside Bancshares | | Financials | 27.08 | 42 | 1.58% | -13.54% |
| ALKS | Alkermes | | Health Care | 23.98 | 7 | -2.28% | -13.55% |
| AURA | Aura Biosciences | | Health Care | 7.65 | 67 | 3.38% | -13.56% |
| TDS | Telephone and | | Technology | 15.85 | 90 | 1.28% | -13.62% |
| NBTB | NBT Bancorp | | Financials | 36.18 | 93 | 3.34% | -13.67% |
| NKSH | National Bankshares | | Financials | 27.92 | 10 | 4.14% | -13.69% |
| SMMF | Summit Financial | | Financials | 26.47 | 25 | 0.00% | -13.75% |
| NEO | NeoGenomics | | Health Care | 13.95 | 17 | 0.22% | -13.78% |
| LOVE | Lovesac | | Consumer Staples | 22.02 | 25 | -0.72% | -13.82% |
| CSGS | CSG Systems | | Technology | 45.78 | 0 | -3.09% | -13.96% |
| FSBW | FS Bancorp | | Financials | 31.80 | 17 | 0.38% | -13.96% |
| OLO | Olo | | Technology | 4.92 | 45 | 2.50% | -13.99% |
| WINA | Winmark | | Services & Goods | 358.86 | 33 | -0.13% | -14.06% |
| DEA | Easterly Government | | Financials | 11.55 | 43 | -1.20% | -14.06% |
| PLBC | Plumas Bancorp | | Financials | 35.53 | 93 | 0.95% | -14.07% |
| AKRO | Akero | | Health Care | 20.07 | 20 | 0.88% | -14.07% |
| ASO | Academy Sports | | Services & Goods | 56.68 | 7 | -2.78% | -14.14% |
| FMAO | Farmers & Merchants Bancorp | | Financials | 21.29 | 78 | 3.85% | -14.15% |
| VRA | Vera Bradley | | Consumer Staples | 6.61 | 32 | 0.30% | -14.16% |
| VBTX | Veritex | | Financials | 19.97 | 68 | 2.52% | -14.18% |
| PLAB | Photronics | | Technology | 26.92 | 17 | -1.79% | -14.19% |


| Too many stocks? View smallcap stocks filtered by marketcap & sector |
| Marketcap: All SmallCap Stocks (default-no microcap), Large, Mid-Range, Small |
| Smallcap Sector: Tech, Finance, Energy, Staples, Retail, Industrial, Materials, & Medical |
|
Get the most comprehensive stock market coverage daily at 12Stocks.com ➞ Best Stocks Today ➞ Best Stocks Weekly ➞ Best Stocks Year-to-Date ➞ Best Stocks Trends ➞  Best Stocks Today 12Stocks.com Best Nasdaq Stocks ➞ Best S&P 500 Stocks ➞ Best Tech Stocks ➞ Best Biotech Stocks ➞ |
| Detailed Overview of SmallCap Stocks |
| SmallCap Technical Overview, Leaders & Laggards, Top SmallCap ETF Funds & Detailed SmallCap Stocks List, Charts, Trends & More |
| Smallcap: Technical Analysis, Trends & YTD Performance | |
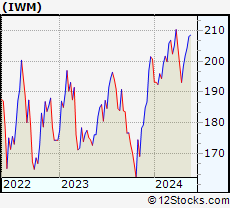
| SmallCap segment as represented by
IWM, an exchange-traded fund [ETF], holds basket of thousands of smallcap stocks from across all major sectors of the US stock market. The smallcap index (contains stocks like Riverbed & Sotheby's) is down by -2.19% and is currently underperforming the overall market by -6.73% year-to-date. Below is a quick view of technical charts and trends: | |
 IWM Weekly Chart |
|
| Long Term Trend: Not Good | |
| Medium Term Trend: Good | |
 IWM Daily Chart |
|
| Short Term Trend: Very Good | |
| Overall Trend Score: 39 | |
| YTD Performance: -2.19% | |
| **Trend Scores & Views Are Only For Educational Purposes And Not For Investing | |
| 12Stocks.com: Top Performing Small Cap Index Stocks | ||||||||||||||||||||||||||||||||||||||||||||||||
 The top performing Small Cap Index stocks year to date are
Now, more recently, over last week, the top performing Small Cap Index stocks on the move are


|
||||||||||||||||||||||||||||||||||||||||||||||||
| 12Stocks.com: Investing in Smallcap Index using Exchange Traded Funds | |
|
The following table shows list of key exchange traded funds (ETF) that
help investors track Smallcap index. The following list also includes leveraged ETF funds that track twice or thrice the daily returns of Smallcap indices. Short or inverse ETF funds move in the opposite direction to the index they track and are useful during market pullbacks or during bear markets. Quick View: Move mouse or cursor over ETF symbol (ticker) to view short-term technical chart and over ETF name to view long term chart. Click on ticker or stock name for detailed view. Click on to add stock symbol to your watchlist and to view watchlist. |
12Stocks.com List of ETFs that track Smallcap Index
| Ticker | ETF Name | Watchlist | Recent Price | Smart Investing & Trading Score | Change % | Week % | Year-to-date % |
| IWM | iShares Russell 2000 | | 196.31 | 39 | 0.21 | -1.05 | -2.19% |
| IJR | iShares Core S&P Small-Cap | | 104.75 | 22 | 0.34 | -0.85 | -3.23% |
| VTWO | Vanguard Russell 2000 ETF | | 79.37 | 14 | 0.27 | -1.06 | -2.13% |
| IWN | iShares Russell 2000 Value | | 149.91 | 22 | 0.58 | -0.81 | -3.49% |
| IJS | iShares S&P Small-Cap 600 Value | | 96.40 | 15 | 0.33 | -0.81 | -6.47% |
| IWO | iShares Russell 2000 Growth | | 249.70 | 7 | -0.25 | -1.34 | -1% |
| IJT | iShares S&P Small-Cap 600 Growth | | 124.90 | 15 | 0.24 | -0.94 | -0.19% |
| XSLV | PowerShares S&P SmallCap Low Volatil ETF | | 42.89 | 45 | 0.82 | 0.4 | -2.85% |
| SDD | ProShares UltraShort SmallCap600 | | 19.55 | 37 | -0.10 | 1.03 | 6.1% |
| SMLV | SPDR SSGA US Small Cap Low Volatil ETF | | 107.07 | 22 | 0.76 | -0.42 | -4.84% |
| SBB | ProShares Short SmallCap600 | | 16.50 | 27 | -0.30 | 0.7 | 3.58% |
| SAA | ProShares Ultra SmallCap600 | | 22.53 | 13 | -0.31 | -2.21 | -9.7% |
| 12Stocks.com: Charts, Trends, Fundamental Data and Performances of SmallCap Stocks | |
|
We now take in-depth look at all SmallCap stocks including charts, multi-period performances and overall trends (as measured by Smart Investing & Trading Score). One can sort SmallCap stocks (click link to choose) by Daily, Weekly and by Year-to-Date performances. Also, one can sort by size of the company or by market capitalization. |
| Select Your Default Chart Type: | |||||
| |||||
| Click on stock symbol or name for detailed view. Click on to add stock symbol to your watchlist and to view watchlist. Quick View: Move mouse or cursor over "Daily" to quickly view daily technical stock chart and over "Weekly" to view weekly technical stock chart. | |||||

 | HBCP Home Bancorp, Inc. |
| Sector: Financials | |
| SubSector: Savings & Loans | |
| MarketCap: 206.83 Millions | |
| Recent Price: 36.35 Smart Investing & Trading Score: 50 | |
| Day Percent Change: 3.86% Day Change: 1.35 | |
| Week Change: 2.16% Year-to-date Change: -13.5% | |
| HBCP Links: Profile News Message Board | |
| Charts:- Daily , Weekly | |
| Add HBCP to Watchlist: View: Get Complete HBCP Trend Analysis ➞ | |
 | PDLB PDL Community Bancorp |
| Sector: Financials | |
| SubSector: REIT - Retail | |
| MarketCap: 206.114 Millions | |
| Recent Price: 8.45 Smart Investing & Trading Score: 25 | |
| Day Percent Change: 5.04% Day Change: 0.41 | |
| Week Change: 3.62% Year-to-date Change: -13.5% | |
| PDLB Links: Profile News Message Board | |
| Charts:- Daily , Weekly | |
| Add PDLB to Watchlist: View: Get Complete PDLB Trend Analysis ➞ | |
 | CURV Torrid Holdings Inc. |
| Sector: Services & Goods | |
| SubSector: Apparel Retail | |
| MarketCap: 278 Millions | |
| Recent Price: 5.06 Smart Investing & Trading Score: 50 | |
| Day Percent Change: -0.20% Day Change: -0.01 | |
| Week Change: 1.2% Year-to-date Change: -13.5% | |
| CURV Links: Profile News Message Board | |
| Charts:- Daily , Weekly | |
| Add CURV to Watchlist: View: Get Complete CURV Trend Analysis ➞ | |
 | SMBK SmartFinancial, Inc. |
| Sector: Financials | |
| SubSector: Regional - Southeast Banks | |
| MarketCap: 174.035 Millions | |
| Recent Price: 21.18 Smart Investing & Trading Score: 62 | |
| Day Percent Change: 3.07% Day Change: 0.63 | |
| Week Change: 2.52% Year-to-date Change: -13.5% | |
| SMBK Links: Profile News Message Board | |
| Charts:- Daily , Weekly | |
| Add SMBK to Watchlist: View: Get Complete SMBK Trend Analysis ➞ | |
 | SBSI Southside Bancshares, Inc. |
| Sector: Financials | |
| SubSector: Regional - Mid-Atlantic Banks | |
| MarketCap: 971.259 Millions | |
| Recent Price: 27.08 Smart Investing & Trading Score: 42 | |
| Day Percent Change: 1.58% Day Change: 0.42 | |
| Week Change: -0.7% Year-to-date Change: -13.5% | |
| SBSI Links: Profile News Message Board | |
| Charts:- Daily , Weekly | |
| Add SBSI to Watchlist: View: Get Complete SBSI Trend Analysis ➞ | |
 | ALKS Alkermes plc |
| Sector: Health Care | |
| SubSector: Biotechnology | |
| MarketCap: 2311.95 Millions | |
| Recent Price: 23.98 Smart Investing & Trading Score: 7 | |
| Day Percent Change: -2.28% Day Change: -0.56 | |
| Week Change: -2.84% Year-to-date Change: -13.6% | |
| ALKS Links: Profile News Message Board | |
| Charts:- Daily , Weekly | |
| Add ALKS to Watchlist: View: Get Complete ALKS Trend Analysis ➞ | |
 | AURA Aura Biosciences, Inc. |
| Sector: Health Care | |
| SubSector: Biotechnology | |
| MarketCap: 469 Millions | |
| Recent Price: 7.65 Smart Investing & Trading Score: 67 | |
| Day Percent Change: 3.38% Day Change: 0.25 | |
| Week Change: 5.96% Year-to-date Change: -13.6% | |
| AURA Links: Profile News Message Board | |
| Charts:- Daily , Weekly | |
| Add AURA to Watchlist: View: Get Complete AURA Trend Analysis ➞ | |
 | TDS Telephone and Data Systems, Inc. |
| Sector: Technology | |
| SubSector: Wireless Communications | |
| MarketCap: 1851.87 Millions | |
| Recent Price: 15.85 Smart Investing & Trading Score: 90 | |
| Day Percent Change: 1.28% Day Change: 0.20 | |
| Week Change: 0.44% Year-to-date Change: -13.6% | |
| TDS Links: Profile News Message Board | |
| Charts:- Daily , Weekly | |
| Add TDS to Watchlist: View: Get Complete TDS Trend Analysis ➞ | |
 | NBTB NBT Bancorp Inc. |
| Sector: Financials | |
| SubSector: Regional - Northeast Banks | |
| MarketCap: 1451.89 Millions | |
| Recent Price: 36.18 Smart Investing & Trading Score: 93 | |
| Day Percent Change: 3.34% Day Change: 1.17 | |
| Week Change: 0.58% Year-to-date Change: -13.7% | |
| NBTB Links: Profile News Message Board | |
| Charts:- Daily , Weekly | |
| Add NBTB to Watchlist: View: Get Complete NBTB Trend Analysis ➞ | |
 | NKSH National Bankshares, Inc. |
| Sector: Financials | |
| SubSector: Regional - Mid-Atlantic Banks | |
| MarketCap: 209.759 Millions | |
| Recent Price: 27.92 Smart Investing & Trading Score: 10 | |
| Day Percent Change: 4.14% Day Change: 1.11 | |
| Week Change: 2.84% Year-to-date Change: -13.7% | |
| NKSH Links: Profile News Message Board | |
| Charts:- Daily , Weekly | |
| Add NKSH to Watchlist: View: Get Complete NKSH Trend Analysis ➞ | |
 | SMMF Summit Financial Group, Inc. |
| Sector: Financials | |
| SubSector: Regional - Mid-Atlantic Banks | |
| MarketCap: 228.959 Millions | |
| Recent Price: 26.47 Smart Investing & Trading Score: 25 | |
| Day Percent Change: 0.00% Day Change: 0.00 | |
| Week Change: -3.57% Year-to-date Change: -13.8% | |
| SMMF Links: Profile News Message Board | |
| Charts:- Daily , Weekly | |
| Add SMMF to Watchlist: View: Get Complete SMMF Trend Analysis ➞ | |
 | NEO NeoGenomics, Inc. |
| Sector: Health Care | |
| SubSector: Medical Laboratories & Research | |
| MarketCap: 2763.8 Millions | |
| Recent Price: 13.95 Smart Investing & Trading Score: 17 | |
| Day Percent Change: 0.22% Day Change: 0.03 | |
| Week Change: -1.34% Year-to-date Change: -13.8% | |
| NEO Links: Profile News Message Board | |
| Charts:- Daily , Weekly | |
| Add NEO to Watchlist: View: Get Complete NEO Trend Analysis ➞ | |
 | LOVE The Lovesac Company |
| Sector: Consumer Staples | |
| SubSector: Home Furnishings & Fixtures | |
| MarketCap: 112.835 Millions | |
| Recent Price: 22.02 Smart Investing & Trading Score: 25 | |
| Day Percent Change: -0.72% Day Change: -0.16 | |
| Week Change: 0.82% Year-to-date Change: -13.8% | |
| LOVE Links: Profile News Message Board | |
| Charts:- Daily , Weekly | |
| Add LOVE to Watchlist: View: Get Complete LOVE Trend Analysis ➞ | |
 | CSGS CSG Systems International, Inc. |
| Sector: Technology | |
| SubSector: Business Software & Services | |
| MarketCap: 1336.78 Millions | |
| Recent Price: 45.78 Smart Investing & Trading Score: 0 | |
| Day Percent Change: -3.09% Day Change: -1.46 | |
| Week Change: -4.74% Year-to-date Change: -14.0% | |
| CSGS Links: Profile News Message Board | |
| Charts:- Daily , Weekly | |
| Add CSGS to Watchlist: View: Get Complete CSGS Trend Analysis ➞ | |
 | FSBW FS Bancorp, Inc. |
| Sector: Financials | |
| SubSector: Regional - Pacific Banks | |
| MarketCap: 140.429 Millions | |
| Recent Price: 31.80 Smart Investing & Trading Score: 17 | |
| Day Percent Change: 0.38% Day Change: 0.12 | |
| Week Change: 1.05% Year-to-date Change: -14.0% | |
| FSBW Links: Profile News Message Board | |
| Charts:- Daily , Weekly | |
| Add FSBW to Watchlist: View: Get Complete FSBW Trend Analysis ➞ | |
 | OLO Olo Inc. |
| Sector: Technology | |
| SubSector: Software - Application | |
| MarketCap: 1030 Millions | |
| Recent Price: 4.92 Smart Investing & Trading Score: 45 | |
| Day Percent Change: 2.50% Day Change: 0.12 | |
| Week Change: -1.6% Year-to-date Change: -14.0% | |
| OLO Links: Profile News Message Board | |
| Charts:- Daily , Weekly | |
| Add OLO to Watchlist: View: Get Complete OLO Trend Analysis ➞ | |
 | WINA Winmark Corporation |
| Sector: Services & Goods | |
| SubSector: Specialty Retail, Other | |
| MarketCap: 520.444 Millions | |
| Recent Price: 358.86 Smart Investing & Trading Score: 33 | |
| Day Percent Change: -0.13% Day Change: -0.46 | |
| Week Change: -0.32% Year-to-date Change: -14.1% | |
| WINA Links: Profile News Message Board | |
| Charts:- Daily , Weekly | |
| Add WINA to Watchlist: View: Get Complete WINA Trend Analysis ➞ | |
 | DEA Easterly Government Properties, Inc. |
| Sector: Financials | |
| SubSector: REIT - Office | |
| MarketCap: 1832.56 Millions | |
| Recent Price: 11.55 Smart Investing & Trading Score: 43 | |
| Day Percent Change: -1.20% Day Change: -0.14 | |
| Week Change: -1.2% Year-to-date Change: -14.1% | |
| DEA Links: Profile News Message Board | |
| Charts:- Daily , Weekly | |
| Add DEA to Watchlist: View: Get Complete DEA Trend Analysis ➞ | |
 | PLBC Plumas Bancorp |
| Sector: Financials | |
| SubSector: Regional - Pacific Banks | |
| MarketCap: 85.0829 Millions | |
| Recent Price: 35.53 Smart Investing & Trading Score: 93 | |
| Day Percent Change: 0.95% Day Change: 0.33 | |
| Week Change: 0.59% Year-to-date Change: -14.1% | |
| PLBC Links: Profile News Message Board | |
| Charts:- Daily , Weekly | |
| Add PLBC to Watchlist: View: Get Complete PLBC Trend Analysis ➞ | |
 | AKRO Akero Therapeutics, Inc. |
| Sector: Health Care | |
| SubSector: Biotechnology | |
| MarketCap: 675.085 Millions | |
| Recent Price: 20.07 Smart Investing & Trading Score: 20 | |
| Day Percent Change: 0.88% Day Change: 0.18 | |
| Week Change: 1.65% Year-to-date Change: -14.1% | |
| AKRO Links: Profile News Message Board | |
| Charts:- Daily , Weekly | |
| Add AKRO to Watchlist: View: Get Complete AKRO Trend Analysis ➞ | |
 | ASO Academy Sports and Outdoors, Inc. |
| Sector: Services & Goods | |
| SubSector: Specialty Retail | |
| MarketCap: 16027 Millions | |
| Recent Price: 56.68 Smart Investing & Trading Score: 7 | |
| Day Percent Change: -2.78% Day Change: -1.62 | |
| Week Change: -6.65% Year-to-date Change: -14.1% | |
| ASO Links: Profile News Message Board | |
| Charts:- Daily , Weekly | |
| Add ASO to Watchlist: View: Get Complete ASO Trend Analysis ➞ | |
 | FMAO Farmers & Merchants Bancorp, Inc. |
| Sector: Financials | |
| SubSector: Regional - Midwest Banks | |
| MarketCap: 280.27 Millions | |
| Recent Price: 21.29 Smart Investing & Trading Score: 78 | |
| Day Percent Change: 3.85% Day Change: 0.79 | |
| Week Change: -1.98% Year-to-date Change: -14.2% | |
| FMAO Links: Profile News Message Board | |
| Charts:- Daily , Weekly | |
| Add FMAO to Watchlist: View: Get Complete FMAO Trend Analysis ➞ | |
 | VRA Vera Bradley, Inc. |
| Sector: Consumer Staples | |
| SubSector: Textile - Apparel Footwear & Accessories | |
| MarketCap: 151.17 Millions | |
| Recent Price: 6.61 Smart Investing & Trading Score: 32 | |
| Day Percent Change: 0.30% Day Change: 0.02 | |
| Week Change: -2% Year-to-date Change: -14.2% | |
| VRA Links: Profile News Message Board | |
| Charts:- Daily , Weekly | |
| Add VRA to Watchlist: View: Get Complete VRA Trend Analysis ➞ | |
 | VBTX Veritex Holdings, Inc. |
| Sector: Financials | |
| SubSector: Regional - Southwest Banks | |
| MarketCap: 625.165 Millions | |
| Recent Price: 19.97 Smart Investing & Trading Score: 68 | |
| Day Percent Change: 2.52% Day Change: 0.49 | |
| Week Change: -0.99% Year-to-date Change: -14.2% | |
| VBTX Links: Profile News Message Board | |
| Charts:- Daily , Weekly | |
| Add VBTX to Watchlist: View: Get Complete VBTX Trend Analysis ➞ | |
 | PLAB Photronics, Inc. |
| Sector: Technology | |
| SubSector: Semiconductor Equipment & Materials | |
| MarketCap: 709.018 Millions | |
| Recent Price: 26.92 Smart Investing & Trading Score: 17 | |
| Day Percent Change: -1.79% Day Change: -0.49 | |
| Week Change: -4.81% Year-to-date Change: -14.2% | |
| PLAB Links: Profile News Message Board | |
| Charts:- Daily , Weekly | |
| Add PLAB to Watchlist: View: Get Complete PLAB Trend Analysis ➞ | |
| Too many stocks? View smallcap stocks filtered by marketcap & sector |
| Marketcap: All SmallCap Stocks (default-no microcap), Large, Mid-Range, Small & MicroCap |
| Sector: Tech, Finance, Energy, Staples, Retail, Industrial, Materials, Utilities & Medical |
|
Best Stocks Today 12Stocks.com |
© 2024 12Stocks.com Terms & Conditions Privacy Contact Us
All Information Provided Only For Education And Not To Be Used For Investing or Trading. See Terms & Conditions


One More Thing ... Get Best Stocks Delivered Daily!
Never Ever Miss A Move With Our Top Ten Stocks Lists
Find Best Stocks In Any Market - Bull or Bear Market
Take A Peek At Our Top Ten Stocks Lists: Daily, Weekly, Year-to-Date & Top Trends
Find Best Stocks In Any Market - Bull or Bear Market
Take A Peek At Our Top Ten Stocks Lists: Daily, Weekly, Year-to-Date & Top Trends
Smallcap Stocks With Best Up Trends [0-bearish to 100-bullish]: Surmodics [100], Rocky Brands[100], TransMedics Group[100], LendingClub [100], A10 s[100], Carpenter [100], UFP [100], PROCEPT BioRobotics[100], Xencor [100], Trinity Industries[100], TPG RE[100]
Best Smallcap Stocks Year-to-Date:
Janux [441.55%], Viking [310.45%], Longboard [259.25%], Alpine Immune[239.26%], Avidity Biosciences[185.4%], Bakkt [182.96%], Cullinan Oncology[175.33%], Vera [173.32%], Arcutis Bio[173.07%], Super Micro[159.62%], Y-mAbs [141.35%] Best Smallcap Stocks This Week:
Deciphera [73.07%], Eyenovia [44.86%], Cue Biopharma[39.93%], Poseida [30.52%], Seres [30.3%], P3 Health[29.62%], Phibro Animal[28.75%], TransMedics Group[27.69%], Surmodics [27.24%], LendingTree [26.12%], Rocky Brands[24.58%] Best Smallcap Stocks Daily:
Surmodics [29.62%], Rocky Brands[28.06%], TransMedics Group[24.91%], Ventyx Biosciences[24.63%], Eyenovia [21.17%], LendingClub [19.68%], Summit [19.08%], Powell Industries[18.74%], MiMedx Group[18.34%], CareDx [18.04%], A10 s[17.69%]