
 Login Sign Up


| |||||
 |  | ||||

| 12Stocks.com Market Intelligence |
Best SmallCap Stocks
|
| In a hurry? Small Cap Stock Lists: Performance Trends Table, Stock Charts
Sort Small Cap stocks: Daily, Weekly, Year-to-Date, Market Cap & Trends. Filter Small Cap stocks list by sector: Show all, Tech, Finance, Energy, Staples, Retail, Industrial, Materials, Utilities and HealthCare Filter Small Cap stocks list by size: All Large Medium Small and MicroCap |
| 12Stocks.com Small Cap Stocks Performances & Trends Daily | |||||||||
|
|  The overall Smart Investing & Trading Score is 63 (0-bearish to 100-bullish) which puts Small Cap index in short term neutral to bullish trend. The Smart Investing & Trading Score from previous trading session is 58 and hence an improvement of trend.
| ||||||||
Here are the Smart Investing & Trading Scores of the most requested small cap stocks at 12Stocks.com (click stock name for detailed review):
|


| 12Stocks.com: Investing in Smallcap Index with Stocks | |
|
The following table helps investors and traders sort through current performance and trends (as measured by Smart Investing & Trading Score) of various
stocks in the Smallcap Index. Quick View: Move mouse or cursor over stock symbol (ticker) to view short-term technical chart and over stock name to view long term chart. Click on  to add stock symbol to your watchlist and to add stock symbol to your watchlist and  to view watchlist. Click on any ticker or stock name for detailed market intelligence report for that stock. to view watchlist. Click on any ticker or stock name for detailed market intelligence report for that stock. |
12Stocks.com Performance of Stocks in Smallcap Index
| Ticker | Stock Name | Watchlist | Category | Recent Price | Smart Investing & Trading Score | Change % | YTD Change% |
| VAL | Valaris |   | Energy | 69.12 | 63 | 1.41% | 0.80% |
| BKH | Black Hills | | Utilities | 54.37 | 100 | 0.09% | 0.78% |
| WISH | ContextLogic | | Services & Goods | 5.99 | 95 | 2.22% | 0.76% |
| LQDT | Liquidity Services | | Services & Goods | 17.33 | 45 | -0.52% | 0.70% |
| WVE | Wave Life | | Health Care | 5.09 | 58 | 5.06% | 0.69% |
| CSV | Carriage Services | | Services & Goods | 25.18 | 100 | 1.00% | 0.68% |
| FFIN | First Financial | | Financials | 30.50 | 49 | 0.28% | 0.68% |
| KNSA | Kiniksa | | Health Care | 17.66 | 32 | 3.31% | 0.68% |
| TRN | Trinity Industries | | Transports | 26.76 | 61 | 1.25% | 0.64% |
| HLIO | Helios | | Industrials | 45.63 | 54 | 2.13% | 0.62% |
| NVEC | NVE | | Technology | 78.86 | 10 | 0.24% | 0.55% |
| ITOS | iTeos | | Health Care | 11.00 | 46 | 1.95% | 0.55% |
| WNC | Wabash National | | Consumer Staples | 25.75 | 63 | -0.27% | 0.51% |
| MCRI | Monarch Casino | | Services & Goods | 69.50 | 55 | 1.75% | 0.51% |
| BTAI | BioXcel | | Health Care | 2.96 | 49 | 4.04% | 0.51% |
| POR | Portland General | | Utilities | 43.55 | 100 | 0.60% | 0.48% |
| PLUS | ePlus | | Technology | 80.17 | 95 | 3.41% | 0.41% |
| JELD | JELD-WEN Holding | | Industrials | 18.95 | 17 | 3.50% | 0.37% |
| JRVR | James River | | Financials | 9.27 | 74 | -0.11% | 0.32% |
| ALX | Alexander s | | Financials | 214.18 | 42 | 1.25% | 0.29% |
| UMBF | UMB Financial | | Financials | 83.78 | 100 | 0.26% | 0.28% |
| NGVC | Natural Grocers | | Services & Goods | 16.04 | 44 | -1.05% | 0.25% |
| RYAM | Rayonier Advanced | | Materials | 4.06 | 20 | -3.33% | 0.25% |
| WLFC | Willis Lease | | Transports | 48.98 | 17 | -0.37% | 0.20% |
| AMWD | American Woodmark | | Consumer Staples | 93.02 | 58 | 3.01% | 0.18% |


| Too many stocks? View smallcap stocks filtered by marketcap & sector |
| Marketcap: All SmallCap Stocks (default-no microcap), Large, Mid-Range, Small |
| Smallcap Sector: Tech, Finance, Energy, Staples, Retail, Industrial, Materials, & Medical |
|
Get the most comprehensive stock market coverage daily at 12Stocks.com ➞ Best Stocks Today ➞ Best Stocks Weekly ➞ Best Stocks Year-to-Date ➞ Best Stocks Trends ➞  Best Stocks Today 12Stocks.com Best Nasdaq Stocks ➞ Best S&P 500 Stocks ➞ Best Tech Stocks ➞ Best Biotech Stocks ➞ |
| Detailed Overview of SmallCap Stocks |
| SmallCap Technical Overview, Leaders & Laggards, Top SmallCap ETF Funds & Detailed SmallCap Stocks List, Charts, Trends & More |
| Smallcap: Technical Analysis, Trends & YTD Performance | |
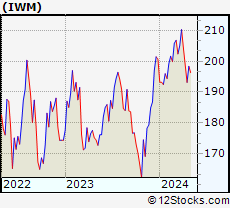
| SmallCap segment as represented by
IWM, an exchange-traded fund [ETF], holds basket of thousands of smallcap stocks from across all major sectors of the US stock market. The smallcap index (contains stocks like Riverbed & Sotheby's) is down by -1.07% and is currently underperforming the overall market by -6.71% year-to-date. Below is a quick view of technical charts and trends: | |
 IWM Weekly Chart |
|
| Long Term Trend: Good | |
| Medium Term Trend: Not Good | |
 IWM Daily Chart |
|
| Short Term Trend: Very Good | |
| Overall Trend Score: 63 | |
| YTD Performance: -1.07% | |
| **Trend Scores & Views Are Only For Educational Purposes And Not For Investing | |
| 12Stocks.com: Top Performing Small Cap Index Stocks | ||||||||||||||||||||||||||||||||||||||||||||||||
 The top performing Small Cap Index stocks year to date are
Now, more recently, over last week, the top performing Small Cap Index stocks on the move are


|
||||||||||||||||||||||||||||||||||||||||||||||||
| 12Stocks.com: Investing in Smallcap Index using Exchange Traded Funds | |
|
The following table shows list of key exchange traded funds (ETF) that
help investors track Smallcap index. The following list also includes leveraged ETF funds that track twice or thrice the daily returns of Smallcap indices. Short or inverse ETF funds move in the opposite direction to the index they track and are useful during market pullbacks or during bear markets. Quick View: Move mouse or cursor over ETF symbol (ticker) to view short-term technical chart and over ETF name to view long term chart. Click on ticker or stock name for detailed view. Click on to add stock symbol to your watchlist and to view watchlist. |
12Stocks.com List of ETFs that track Smallcap Index
| Ticker | ETF Name | Watchlist | Recent Price | Smart Investing & Trading Score | Change % | Week % | Year-to-date % |
| IWM | iShares Russell 2000 | | 198.57 | 63 | 1.67 | 2.81 | -1.07% |
| VTWO | Vanguard Russell 2000 ETF | | 80.53 | 70 | 2.04 | 3.14 | -0.7% |
| IJR | iShares Core S&P Small-Cap | | 105.44 | 75 | 1.91 | 2.16 | -2.59% |
| IJS | iShares S&P Small-Cap 600 Value | | 98.50 | 67 | 2.15 | 3.02 | -4.43% |
| IWN | iShares Russell 2000 Value | | 151.50 | 68 | 1.33 | 2.52 | -2.47% |
| IJT | iShares S&P Small-Cap 600 Growth | | 125.91 | 70 | 2.07 | 3.03 | 0.62% |
| IWO | iShares Russell 2000 Growth | | 252.16 | 58 | 1.71 | 2.8 | -0.02% |
| XSLV | PowerShares S&P SmallCap Low Volatil ETF | | 43.09 | 80 | 1.53 | 2.16 | -2.4% |
| SMLV | SPDR SSGA US Small Cap Low Volatil ETF | | 108.46 | 72 | 0.91 | 2.23 | -3.61% |
| SAA | ProShares Ultra SmallCap600 | | 23.15 | 24 | 3.49 | 6.19 | -7.21% |
| SBB | ProShares Short SmallCap600 | | 16.28 | 40 | -2.05 | -3.33 | 2.2% |
| SDD | ProShares UltraShort SmallCap600 | | 19.31 | 40 | -2.23 | -5.06 | 4.79% |
| 12Stocks.com: Charts, Trends, Fundamental Data and Performances of SmallCap Stocks | |
|
We now take in-depth look at all SmallCap stocks including charts, multi-period performances and overall trends (as measured by Smart Investing & Trading Score). One can sort SmallCap stocks (click link to choose) by Daily, Weekly and by Year-to-Date performances. Also, one can sort by size of the company or by market capitalization. |
| Select Your Default Chart Type: | |||||
| |||||
| Click on stock symbol or name for detailed view. Click on to add stock symbol to your watchlist and to view watchlist. Quick View: Move mouse or cursor over "Daily" to quickly view daily technical stock chart and over "Weekly" to view weekly technical stock chart. | |||||

 | VAL Valaris Limited |
| Sector: Energy | |
| SubSector: Oil & Gas Equipment & Services | |
| MarketCap: 4520 Millions | |
| Recent Price: 69.12 Smart Investing & Trading Score: 63 | |
| Day Percent Change: 1.41% Day Change: 0.96 | |
| Week Change: 0.93% Year-to-date Change: 0.8% | |
| VAL Links: Profile News Message Board | |
| Charts:- Daily , Weekly | |
| Add VAL to Watchlist: View: Get Complete VAL Trend Analysis ➞ | |
 | BKH Black Hills Corporation |
| Sector: Utilities | |
| SubSector: Electric Utilities | |
| MarketCap: 3666.94 Millions | |
| Recent Price: 54.37 Smart Investing & Trading Score: 100 | |
| Day Percent Change: 0.09% Day Change: 0.05 | |
| Week Change: 0.69% Year-to-date Change: 0.8% | |
| BKH Links: Profile News Message Board | |
| Charts:- Daily , Weekly | |
| Add BKH to Watchlist: View: Get Complete BKH Trend Analysis ➞ | |
 | WISH ContextLogic Inc. |
| Sector: Services & Goods | |
| SubSector: Internet Retail | |
| MarketCap: 165 Millions | |
| Recent Price: 5.99 Smart Investing & Trading Score: 95 | |
| Day Percent Change: 2.22% Day Change: 0.13 | |
| Week Change: 2.57% Year-to-date Change: 0.8% | |
| WISH Links: Profile News Message Board | |
| Charts:- Daily , Weekly | |
| Add WISH to Watchlist: View: Get Complete WISH Trend Analysis ➞ | |
 | LQDT Liquidity Services, Inc. |
| Sector: Services & Goods | |
| SubSector: Catalog & Mail Order Houses | |
| MarketCap: 144.492 Millions | |
| Recent Price: 17.33 Smart Investing & Trading Score: 45 | |
| Day Percent Change: -0.52% Day Change: -0.09 | |
| Week Change: 1.64% Year-to-date Change: 0.7% | |
| LQDT Links: Profile News Message Board | |
| Charts:- Daily , Weekly | |
| Add LQDT to Watchlist: View: Get Complete LQDT Trend Analysis ➞ | |
 | WVE Wave Life Sciences Ltd. |
| Sector: Health Care | |
| SubSector: Biotechnology | |
| MarketCap: 452.785 Millions | |
| Recent Price: 5.09 Smart Investing & Trading Score: 58 | |
| Day Percent Change: 5.06% Day Change: 0.25 | |
| Week Change: 4.41% Year-to-date Change: 0.7% | |
| WVE Links: Profile News Message Board | |
| Charts:- Daily , Weekly | |
| Add WVE to Watchlist: View: Get Complete WVE Trend Analysis ➞ | |
 | CSV Carriage Services, Inc. |
| Sector: Services & Goods | |
| SubSector: Personal Services | |
| MarketCap: 304.725 Millions | |
| Recent Price: 25.18 Smart Investing & Trading Score: 100 | |
| Day Percent Change: 1.00% Day Change: 0.25 | |
| Week Change: 4.92% Year-to-date Change: 0.7% | |
| CSV Links: Profile News Message Board | |
| Charts:- Daily , Weekly | |
| Add CSV to Watchlist: View: Get Complete CSV Trend Analysis ➞ | |
 | FFIN First Financial Bankshares, Inc. |
| Sector: Financials | |
| SubSector: Regional - Southwest Banks | |
| MarketCap: 3503.75 Millions | |
| Recent Price: 30.50 Smart Investing & Trading Score: 49 | |
| Day Percent Change: 0.28% Day Change: 0.08 | |
| Week Change: 1.65% Year-to-date Change: 0.7% | |
| FFIN Links: Profile News Message Board | |
| Charts:- Daily , Weekly | |
| Add FFIN to Watchlist: View: Get Complete FFIN Trend Analysis ➞ | |
 | KNSA Kiniksa Pharmaceuticals, Ltd. |
| Sector: Health Care | |
| SubSector: Biotechnology | |
| MarketCap: 780.285 Millions | |
| Recent Price: 17.66 Smart Investing & Trading Score: 32 | |
| Day Percent Change: 3.31% Day Change: 0.57 | |
| Week Change: 4.31% Year-to-date Change: 0.7% | |
| KNSA Links: Profile News Message Board | |
| Charts:- Daily , Weekly | |
| Add KNSA to Watchlist: View: Get Complete KNSA Trend Analysis ➞ | |
 | TRN Trinity Industries, Inc. |
| Sector: Transports | |
| SubSector: Railroads | |
| MarketCap: 2058.22 Millions | |
| Recent Price: 26.76 Smart Investing & Trading Score: 61 | |
| Day Percent Change: 1.25% Day Change: 0.33 | |
| Week Change: 0.83% Year-to-date Change: 0.6% | |
| TRN Links: Profile News Message Board | |
| Charts:- Daily , Weekly | |
| Add TRN to Watchlist: View: Get Complete TRN Trend Analysis ➞ | |
 | HLIO Helios Technologies, Inc. |
| Sector: Industrials | |
| SubSector: Diversified Machinery | |
| MarketCap: 1455.66 Millions | |
| Recent Price: 45.63 Smart Investing & Trading Score: 54 | |
| Day Percent Change: 2.13% Day Change: 0.95 | |
| Week Change: -0.67% Year-to-date Change: 0.6% | |
| HLIO Links: Profile News Message Board | |
| Charts:- Daily , Weekly | |
| Add HLIO to Watchlist: View: Get Complete HLIO Trend Analysis ➞ | |
 | NVEC NVE Corporation |
| Sector: Technology | |
| SubSector: Semiconductor - Specialized | |
| MarketCap: 231.26 Millions | |
| Recent Price: 78.86 Smart Investing & Trading Score: 10 | |
| Day Percent Change: 0.24% Day Change: 0.19 | |
| Week Change: 1.1% Year-to-date Change: 0.6% | |
| NVEC Links: Profile News Message Board | |
| Charts:- Daily , Weekly | |
| Add NVEC to Watchlist: View: Get Complete NVEC Trend Analysis ➞ | |
 | ITOS iTeos Therapeutics, Inc. |
| Sector: Health Care | |
| SubSector: Biotechnology | |
| MarketCap: 10487 Millions | |
| Recent Price: 11.00 Smart Investing & Trading Score: 46 | |
| Day Percent Change: 1.95% Day Change: 0.21 | |
| Week Change: 7.37% Year-to-date Change: 0.6% | |
| ITOS Links: Profile News Message Board | |
| Charts:- Daily , Weekly | |
| Add ITOS to Watchlist: View: Get Complete ITOS Trend Analysis ➞ | |
 | WNC Wabash National Corporation |
| Sector: Consumer Staples | |
| SubSector: Trucks & Other Vehicles | |
| MarketCap: 482.597 Millions | |
| Recent Price: 25.75 Smart Investing & Trading Score: 63 | |
| Day Percent Change: -0.27% Day Change: -0.07 | |
| Week Change: 1.54% Year-to-date Change: 0.5% | |
| WNC Links: Profile News Message Board | |
| Charts:- Daily , Weekly | |
| Add WNC to Watchlist: View: Get Complete WNC Trend Analysis ➞ | |
 | MCRI Monarch Casino & Resort, Inc. |
| Sector: Services & Goods | |
| SubSector: Resorts & Casinos | |
| MarketCap: 352.894 Millions | |
| Recent Price: 69.50 Smart Investing & Trading Score: 55 | |
| Day Percent Change: 1.75% Day Change: 1.19 | |
| Week Change: 3.22% Year-to-date Change: 0.5% | |
| MCRI Links: Profile News Message Board | |
| Charts:- Daily , Weekly | |
| Add MCRI to Watchlist: View: Get Complete MCRI Trend Analysis ➞ | |
 | BTAI BioXcel Therapeutics, Inc. |
| Sector: Health Care | |
| SubSector: Biotechnology | |
| MarketCap: 487.485 Millions | |
| Recent Price: 2.96 Smart Investing & Trading Score: 49 | |
| Day Percent Change: 4.04% Day Change: 0.11 | |
| Week Change: 7.04% Year-to-date Change: 0.5% | |
| BTAI Links: Profile News Message Board | |
| Charts:- Daily , Weekly | |
| Add BTAI to Watchlist: View: Get Complete BTAI Trend Analysis ➞ | |
 | POR Portland General Electric Company |
| Sector: Utilities | |
| SubSector: Electric Utilities | |
| MarketCap: 4291.84 Millions | |
| Recent Price: 43.55 Smart Investing & Trading Score: 100 | |
| Day Percent Change: 0.60% Day Change: 0.26 | |
| Week Change: 1.75% Year-to-date Change: 0.5% | |
| POR Links: Profile News Message Board | |
| Charts:- Daily , Weekly | |
| Add POR to Watchlist: View: Get Complete POR Trend Analysis ➞ | |
 | PLUS ePlus inc. |
| Sector: Technology | |
| SubSector: Application Software | |
| MarketCap: 728.262 Millions | |
| Recent Price: 80.17 Smart Investing & Trading Score: 95 | |
| Day Percent Change: 3.41% Day Change: 2.64 | |
| Week Change: 6.37% Year-to-date Change: 0.4% | |
| PLUS Links: Profile News Message Board | |
| Charts:- Daily , Weekly | |
| Add PLUS to Watchlist: View: Get Complete PLUS Trend Analysis ➞ | |
 | JELD JELD-WEN Holding, Inc. |
| Sector: Industrials | |
| SubSector: General Building Materials | |
| MarketCap: 1022.53 Millions | |
| Recent Price: 18.95 Smart Investing & Trading Score: 17 | |
| Day Percent Change: 3.50% Day Change: 0.64 | |
| Week Change: 3.61% Year-to-date Change: 0.4% | |
| JELD Links: Profile News Message Board | |
| Charts:- Daily , Weekly | |
| Add JELD to Watchlist: View: Get Complete JELD Trend Analysis ➞ | |
 | JRVR James River Group Holdings, Ltd. |
| Sector: Financials | |
| SubSector: Property & Casualty Insurance | |
| MarketCap: 978.312 Millions | |
| Recent Price: 9.27 Smart Investing & Trading Score: 74 | |
| Day Percent Change: -0.11% Day Change: -0.01 | |
| Week Change: -0.75% Year-to-date Change: 0.3% | |
| JRVR Links: Profile News Message Board | |
| Charts:- Daily , Weekly | |
| Add JRVR to Watchlist: View: Get Complete JRVR Trend Analysis ➞ | |
 | ALX Alexander s, Inc. |
| Sector: Financials | |
| SubSector: REIT - Retail | |
| MarketCap: 1251.54 Millions | |
| Recent Price: 214.18 Smart Investing & Trading Score: 42 | |
| Day Percent Change: 1.25% Day Change: 2.64 | |
| Week Change: 1.73% Year-to-date Change: 0.3% | |
| ALX Links: Profile News Message Board | |
| Charts:- Daily , Weekly | |
| Add ALX to Watchlist: View: Get Complete ALX Trend Analysis ➞ | |
 | UMBF UMB Financial Corporation |
| Sector: Financials | |
| SubSector: Regional - Southwest Banks | |
| MarketCap: 2207.35 Millions | |
| Recent Price: 83.78 Smart Investing & Trading Score: 100 | |
| Day Percent Change: 0.26% Day Change: 0.22 | |
| Week Change: 2.87% Year-to-date Change: 0.3% | |
| UMBF Links: Profile News Message Board | |
| Charts:- Daily , Weekly | |
| Add UMBF to Watchlist: View: Get Complete UMBF Trend Analysis ➞ | |
 | NGVC Natural Grocers by Vitamin Cottage, Inc. |
| Sector: Services & Goods | |
| SubSector: Grocery Stores | |
| MarketCap: 185.475 Millions | |
| Recent Price: 16.04 Smart Investing & Trading Score: 44 | |
| Day Percent Change: -1.05% Day Change: -0.17 | |
| Week Change: -2.67% Year-to-date Change: 0.3% | |
| NGVC Links: Profile News Message Board | |
| Charts:- Daily , Weekly | |
| Add NGVC to Watchlist: View: Get Complete NGVC Trend Analysis ➞ | |
 | RYAM Rayonier Advanced Materials Inc. |
| Sector: Materials | |
| SubSector: Chemicals - Major Diversified | |
| MarketCap: 116.736 Millions | |
| Recent Price: 4.06 Smart Investing & Trading Score: 20 | |
| Day Percent Change: -3.33% Day Change: -0.14 | |
| Week Change: -5.58% Year-to-date Change: 0.3% | |
| RYAM Links: Profile News Message Board | |
| Charts:- Daily , Weekly | |
| Add RYAM to Watchlist: View: Get Complete RYAM Trend Analysis ➞ | |
 | WLFC Willis Lease Finance Corporation |
| Sector: Transports | |
| SubSector: Rental & Leasing Services | |
| MarketCap: 122.044 Millions | |
| Recent Price: 48.98 Smart Investing & Trading Score: 17 | |
| Day Percent Change: -0.37% Day Change: -0.18 | |
| Week Change: -1.82% Year-to-date Change: 0.2% | |
| WLFC Links: Profile News Message Board | |
| Charts:- Daily , Weekly | |
| Add WLFC to Watchlist: View: Get Complete WLFC Trend Analysis ➞ | |
 | AMWD American Woodmark Corporation |
| Sector: Consumer Staples | |
| SubSector: Home Furnishings & Fixtures | |
| MarketCap: 958.435 Millions | |
| Recent Price: 93.02 Smart Investing & Trading Score: 58 | |
| Day Percent Change: 3.01% Day Change: 2.72 | |
| Week Change: 3.13% Year-to-date Change: 0.2% | |
| AMWD Links: Profile News Message Board | |
| Charts:- Daily , Weekly | |
| Add AMWD to Watchlist: View: Get Complete AMWD Trend Analysis ➞ | |
| Too many stocks? View smallcap stocks filtered by marketcap & sector |
| Marketcap: All SmallCap Stocks (default-no microcap), Large, Mid-Range, Small & MicroCap |
| Sector: Tech, Finance, Energy, Staples, Retail, Industrial, Materials, Utilities & Medical |
|
Best Stocks Today 12Stocks.com |
© 2024 12Stocks.com Terms & Conditions Privacy Contact Us
All Information Provided Only For Education And Not To Be Used For Investing or Trading. See Terms & Conditions


One More Thing ... Get Best Stocks Delivered Daily!
Never Ever Miss A Move With Our Top Ten Stocks Lists
Find Best Stocks In Any Market - Bull or Bear Market
Take A Peek At Our Top Ten Stocks Lists: Daily, Weekly, Year-to-Date & Top Trends
Find Best Stocks In Any Market - Bull or Bear Market
Take A Peek At Our Top Ten Stocks Lists: Daily, Weekly, Year-to-Date & Top Trends
Smallcap Stocks With Best Up Trends [0-bearish to 100-bullish]: Hibbett Sports[100], AZZ [100], Day One[100], BioLife Solutions[100], Oscar Health[100], Mueller Industries[100], Gannett Co[100], Dillard s[100], Riot Blockchain[100], Agios [100], Brookdale Senior[100]
Best Smallcap Stocks Year-to-Date:
Janux [364.03%], Viking [258.89%], Alpine Immune[238.94%], Longboard [231.75%], Avidity Biosciences[177.88%], Arcutis Bio[170.43%], Super Micro[168.16%], Vera [154.91%], Hippo [134.14%], Y-mAbs [125.37%], Stoke [113.69%] Best Smallcap Stocks This Week:
Matterport [164.37%], Seres [36.26%], Riot Blockchain[29.74%], Cipher Mining[25%], ProKidney [24.75%], Braemar Hotels[21.3%], Akoustis [21.27%], Hibbett Sports[21.1%], Assertio [19.02%], Generation Bio[18.05%], BigBear.ai [17.93%] Best Smallcap Stocks Daily:
Virgin Galactic[22.38%], Seres [22.14%], Hibbett Sports[18.84%], Marathon Patent[18.12%], Generation Bio[16.37%], IGM Biosciences[14.52%], Braemar Hotels[12.96%], SES AI[12.17%], NuScale Power[11.16%], FuelCell Energy[10.86%], Cutera [10.82%]