
 Login Sign Up


| |||||
 |  | ||||

| 12Stocks.com Market Intelligence |
Best SmallCap Stocks
|
| In a hurry? Small Cap Stock Lists: Performance Trends Table, Stock Charts
Sort Small Cap stocks: Daily, Weekly, Year-to-Date, Market Cap & Trends. Filter Small Cap stocks list by sector: Show all, Tech, Finance, Energy, Staples, Retail, Industrial, Materials, Utilities and HealthCare Filter Small Cap stocks list by size: All Large Medium Small and MicroCap |
| 12Stocks.com Small Cap Stocks Performances & Trends Daily | |||||||||
|
|  The overall Smart Investing & Trading Score is 58 (0-bearish to 100-bullish) which puts Small Cap index in short term neutral trend. The Smart Investing & Trading Score from previous trading session is 63 and hence a deterioration of trend.
| ||||||||
Here are the Smart Investing & Trading Scores of the most requested small cap stocks at 12Stocks.com (click stock name for detailed review):
|


| 12Stocks.com: Investing in Smallcap Index with Stocks | |
|
The following table helps investors and traders sort through current performance and trends (as measured by Smart Investing & Trading Score) of various
stocks in the Smallcap Index. Quick View: Move mouse or cursor over stock symbol (ticker) to view short-term technical chart and over stock name to view long term chart. Click on  to add stock symbol to your watchlist and to add stock symbol to your watchlist and  to view watchlist. Click on any ticker or stock name for detailed market intelligence report for that stock. to view watchlist. Click on any ticker or stock name for detailed market intelligence report for that stock. |
12Stocks.com Performance of Stocks in Smallcap Index
| Ticker | Stock Name | Watchlist | Category | Recent Price | Smart Investing & Trading Score | Change % | YTD Change% |
| COCO | Vita Coco |   | Consumer Staples | 24.09 | 51 | 1.86% | -6.45% |
| CNS | Cohen & Steers | | Financials | 70.79 | 35 | -1.10% | -6.52% |
| SYBT | Stock Yards | | Financials | 48.11 | 67 | 5.30% | -6.56% |
| NSP | Insperity | | Services & Goods | 109.52 | 50 | 0.80% | -6.57% |
| YEXT | Yext | | Technology | 5.50 | 0 | -0.72% | -6.62% |
| FCPT | Four Corners | | Financials | 23.61 | 71 | -0.17% | -6.68% |
| INN | Summit Hotel | | Financials | 6.27 | 45 | -1.57% | -6.70% |
| TOWN | TowneBank | | Financials | 27.75 | 74 | -0.25% | -6.75% |
| FBNC | First Bancorp | | Financials | 34.50 | 67 | 1.14% | -6.78% |
| BUSE | First Busey | | Financials | 23.12 | 35 | -0.64% | -6.85% |
| CVGW | Calavo Growers | | Consumer Staples | 27.38 | 80 | -2.60% | -6.90% |
| PLPC | Preformed Line | | Industrials | 124.61 | 43 | 1.09% | -6.91% |
| TCBI | Texas Capital | | Financials | 60.12 | 74 | -0.07% | -6.98% |
| ACA | Arcosa | | Industrials | 76.86 | 10 | -0.98% | -6.99% |
| OMER | Omeros | | Health Care | 3.04 | 8 | -1.62% | -7.03% |
| VSH | Vishay Inter | | Technology | 22.28 | 100 | 3.24% | -7.05% |
| SEAT | Vivid Seats | | Services & Goods | 5.80 | 69 | -0.60% | -7.05% |
| WRBY | Warby Parker | | Health Care | 13.10 | 88 | -2.24% | -7.13% |
| NUVL | Nuvalent | | Health Care | 68.18 | 49 | 0.92% | -7.23% |
| VRCA | Verrica | | Health Care | 6.79 | 49 | -0.88% | -7.24% |
| SRCE | 1st Source | | Financials | 50.96 | 54 | 0.37% | -7.26% |
| GWRS | Global Water | | Utilities | 12.13 | 20 | -0.82% | -7.26% |
| BSRR | Sierra Bancorp | | Financials | 20.90 | 74 | 4.71% | -7.32% |
| CCBG | Capital City | | Financials | 27.26 | 52 | 0.29% | -7.37% |
| WSR | Whitestone REIT | | Financials | 11.38 | 42 | -1.04% | -7.40% |


| Too many stocks? View smallcap stocks filtered by marketcap & sector |
| Marketcap: All SmallCap Stocks (default-no microcap), Large, Mid-Range, Small |
| Smallcap Sector: Tech, Finance, Energy, Staples, Retail, Industrial, Materials, & Medical |
|
Get the most comprehensive stock market coverage daily at 12Stocks.com ➞ Best Stocks Today ➞ Best Stocks Weekly ➞ Best Stocks Year-to-Date ➞ Best Stocks Trends ➞  Best Stocks Today 12Stocks.com Best Nasdaq Stocks ➞ Best S&P 500 Stocks ➞ Best Tech Stocks ➞ Best Biotech Stocks ➞ |
| Detailed Overview of SmallCap Stocks |
| SmallCap Technical Overview, Leaders & Laggards, Top SmallCap ETF Funds & Detailed SmallCap Stocks List, Charts, Trends & More |
| Smallcap: Technical Analysis, Trends & YTD Performance | |
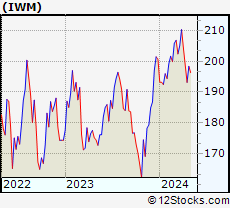
| SmallCap segment as represented by
IWM, an exchange-traded fund [ETF], holds basket of thousands of smallcap stocks from across all major sectors of the US stock market. The smallcap index (contains stocks like Riverbed & Sotheby's) is down by -1.51% and is currently underperforming the overall market by -7.17% year-to-date. Below is a quick view of technical charts and trends: | |
 IWM Weekly Chart |
|
| Long Term Trend: Good | |
| Medium Term Trend: Not Good | |
 IWM Daily Chart |
|
| Short Term Trend: Very Good | |
| Overall Trend Score: 58 | |
| YTD Performance: -1.51% | |
| **Trend Scores & Views Are Only For Educational Purposes And Not For Investing | |
| 12Stocks.com: Top Performing Small Cap Index Stocks | ||||||||||||||||||||||||||||||||||||||||||||||||
 The top performing Small Cap Index stocks year to date are
Now, more recently, over last week, the top performing Small Cap Index stocks on the move are


|
||||||||||||||||||||||||||||||||||||||||||||||||
| 12Stocks.com: Investing in Smallcap Index using Exchange Traded Funds | |
|
The following table shows list of key exchange traded funds (ETF) that
help investors track Smallcap index. The following list also includes leveraged ETF funds that track twice or thrice the daily returns of Smallcap indices. Short or inverse ETF funds move in the opposite direction to the index they track and are useful during market pullbacks or during bear markets. Quick View: Move mouse or cursor over ETF symbol (ticker) to view short-term technical chart and over ETF name to view long term chart. Click on ticker or stock name for detailed view. Click on to add stock symbol to your watchlist and to view watchlist. |
12Stocks.com List of ETFs that track Smallcap Index
| Ticker | ETF Name | Watchlist | Recent Price | Smart Investing & Trading Score | Change % | Week % | Year-to-date % |
| IWM | iShares Russell 2000 | | 197.68 | 58 | -0.45 | 2.35 | -1.51% |
| IJR | iShares Core S&P Small-Cap | | 105.71 | 85 | -0.24 | 2.41 | -2.35% |
| VTWO | Vanguard Russell 2000 ETF | | 79.93 | 48 | -0.45 | 2.37 | -1.44% |
| IWN | iShares Russell 2000 Value | | 151.28 | 75 | -0.30 | 2.37 | -2.61% |
| IWO | iShares Russell 2000 Growth | | 251.27 | 58 | -0.44 | 2.44 | -0.38% |
| IJS | iShares S&P Small-Cap 600 Value | | 97.71 | 45 | -0.43 | 2.2 | -5.2% |
| IJT | iShares S&P Small-Cap 600 Growth | | 125.37 | 48 | -0.28 | 2.59 | 0.18% |
| XSLV | PowerShares S&P SmallCap Low Volatil ETF | | 42.94 | 48 | -0.26 | 1.8 | -2.74% |
| SBB | ProShares Short SmallCap600 | | 16.37 | 33 | -0.02 | -2.79 | 2.76% |
| SMLV | SPDR SSGA US Small Cap Low Volatil ETF | | 108.43 | 73 | -0.31 | 2.21 | -3.63% |
| SAA | ProShares Ultra SmallCap600 | | 23.01 | 58 | -0.60 | 5.55 | -7.78% |
| SDD | ProShares UltraShort SmallCap600 | | 19.49 | 42 | 1.35 | -4.18 | 5.77% |
| 12Stocks.com: Charts, Trends, Fundamental Data and Performances of SmallCap Stocks | |
|
We now take in-depth look at all SmallCap stocks including charts, multi-period performances and overall trends (as measured by Smart Investing & Trading Score). One can sort SmallCap stocks (click link to choose) by Daily, Weekly and by Year-to-Date performances. Also, one can sort by size of the company or by market capitalization. |
| Select Your Default Chart Type: | |||||
| |||||
| Click on stock symbol or name for detailed view. Click on to add stock symbol to your watchlist and to view watchlist. Quick View: Move mouse or cursor over "Daily" to quickly view daily technical stock chart and over "Weekly" to view weekly technical stock chart. | |||||

 | COCO The Vita Coco Company, Inc. |
| Sector: Consumer Staples | |
| SubSector: Beverages - Non-Alcoholic | |
| MarketCap: 1510 Millions | |
| Recent Price: 24.09 Smart Investing & Trading Score: 51 | |
| Day Percent Change: 1.86% Day Change: 0.44 | |
| Week Change: 3.04% Year-to-date Change: -6.5% | |
| COCO Links: Profile News Message Board | |
| Charts:- Daily , Weekly | |
| Add COCO to Watchlist: View: Get Complete COCO Trend Analysis ➞ | |
 | CNS Cohen & Steers, Inc. |
| Sector: Financials | |
| SubSector: Asset Management | |
| MarketCap: 2082.43 Millions | |
| Recent Price: 70.79 Smart Investing & Trading Score: 35 | |
| Day Percent Change: -1.10% Day Change: -0.79 | |
| Week Change: -2.21% Year-to-date Change: -6.5% | |
| CNS Links: Profile News Message Board | |
| Charts:- Daily , Weekly | |
| Add CNS to Watchlist: View: Get Complete CNS Trend Analysis ➞ | |
 | SYBT Stock Yards Bancorp, Inc. |
| Sector: Financials | |
| SubSector: Regional - Southeast Banks | |
| MarketCap: 629.235 Millions | |
| Recent Price: 48.11 Smart Investing & Trading Score: 67 | |
| Day Percent Change: 5.30% Day Change: 2.42 | |
| Week Change: 6.23% Year-to-date Change: -6.6% | |
| SYBT Links: Profile News Message Board | |
| Charts:- Daily , Weekly | |
| Add SYBT to Watchlist: View: Get Complete SYBT Trend Analysis ➞ | |
 | NSP Insperity, Inc. |
| Sector: Services & Goods | |
| SubSector: Business Services | |
| MarketCap: 1385.32 Millions | |
| Recent Price: 109.52 Smart Investing & Trading Score: 50 | |
| Day Percent Change: 0.80% Day Change: 0.87 | |
| Week Change: 1.08% Year-to-date Change: -6.6% | |
| NSP Links: Profile News Message Board | |
| Charts:- Daily , Weekly | |
| Add NSP to Watchlist: View: Get Complete NSP Trend Analysis ➞ | |
 | YEXT Yext, Inc. |
| Sector: Technology | |
| SubSector: Internet Software & Services | |
| MarketCap: 1414.91 Millions | |
| Recent Price: 5.50 Smart Investing & Trading Score: 0 | |
| Day Percent Change: -0.72% Day Change: -0.04 | |
| Week Change: 0.73% Year-to-date Change: -6.6% | |
| YEXT Links: Profile News Message Board | |
| Charts:- Daily , Weekly | |
| Add YEXT to Watchlist: View: Get Complete YEXT Trend Analysis ➞ | |
 | FCPT Four Corners Property Trust, Inc. |
| Sector: Financials | |
| SubSector: REIT - Hotel/Motel | |
| MarketCap: 1218.94 Millions | |
| Recent Price: 23.61 Smart Investing & Trading Score: 71 | |
| Day Percent Change: -0.17% Day Change: -0.04 | |
| Week Change: 2.52% Year-to-date Change: -6.7% | |
| FCPT Links: Profile News Message Board | |
| Charts:- Daily , Weekly | |
| Add FCPT to Watchlist: View: Get Complete FCPT Trend Analysis ➞ | |
 | INN Summit Hotel Properties, Inc. |
| Sector: Financials | |
| SubSector: Real Estate Development | |
| MarketCap: 402.019 Millions | |
| Recent Price: 6.27 Smart Investing & Trading Score: 45 | |
| Day Percent Change: -1.57% Day Change: -0.10 | |
| Week Change: 1.95% Year-to-date Change: -6.7% | |
| INN Links: Profile News Message Board | |
| Charts:- Daily , Weekly | |
| Add INN to Watchlist: View: Get Complete INN Trend Analysis ➞ | |
 | TOWN TowneBank |
| Sector: Financials | |
| SubSector: Regional - Mid-Atlantic Banks | |
| MarketCap: 1344.09 Millions | |
| Recent Price: 27.75 Smart Investing & Trading Score: 74 | |
| Day Percent Change: -0.25% Day Change: -0.07 | |
| Week Change: 2.78% Year-to-date Change: -6.8% | |
| TOWN Links: Profile News Message Board | |
| Charts:- Daily , Weekly | |
| Add TOWN to Watchlist: View: Get Complete TOWN Trend Analysis ➞ | |
 | FBNC First Bancorp |
| Sector: Financials | |
| SubSector: Regional - Mid-Atlantic Banks | |
| MarketCap: 664.959 Millions | |
| Recent Price: 34.50 Smart Investing & Trading Score: 67 | |
| Day Percent Change: 1.14% Day Change: 0.39 | |
| Week Change: 6.78% Year-to-date Change: -6.8% | |
| FBNC Links: Profile News Message Board | |
| Charts:- Daily , Weekly | |
| Add FBNC to Watchlist: View: Get Complete FBNC Trend Analysis ➞ | |
 | BUSE First Busey Corporation |
| Sector: Financials | |
| SubSector: Regional - Midwest Banks | |
| MarketCap: 876.97 Millions | |
| Recent Price: 23.12 Smart Investing & Trading Score: 35 | |
| Day Percent Change: -0.64% Day Change: -0.15 | |
| Week Change: 1.36% Year-to-date Change: -6.9% | |
| BUSE Links: Profile News Message Board | |
| Charts:- Daily , Weekly | |
| Add BUSE to Watchlist: View: Get Complete BUSE Trend Analysis ➞ | |
 | CVGW Calavo Growers, Inc. |
| Sector: Consumer Staples | |
| SubSector: Farm Products | |
| MarketCap: 935.287 Millions | |
| Recent Price: 27.38 Smart Investing & Trading Score: 80 | |
| Day Percent Change: -2.60% Day Change: -0.73 | |
| Week Change: -3.63% Year-to-date Change: -6.9% | |
| CVGW Links: Profile News Message Board | |
| Charts:- Daily , Weekly | |
| Add CVGW to Watchlist: View: Get Complete CVGW Trend Analysis ➞ | |
 | PLPC Preformed Line Products Company |
| Sector: Industrials | |
| SubSector: Industrial Electrical Equipment | |
| MarketCap: 221.779 Millions | |
| Recent Price: 124.61 Smart Investing & Trading Score: 43 | |
| Day Percent Change: 1.09% Day Change: 1.34 | |
| Week Change: -0.04% Year-to-date Change: -6.9% | |
| PLPC Links: Profile News Message Board | |
| Charts:- Daily , Weekly | |
| Add PLPC to Watchlist: View: Get Complete PLPC Trend Analysis ➞ | |
 | TCBI Texas Capital Bancshares, Inc. |
| Sector: Financials | |
| SubSector: Regional - Southwest Banks | |
| MarketCap: 1202.75 Millions | |
| Recent Price: 60.12 Smart Investing & Trading Score: 74 | |
| Day Percent Change: -0.07% Day Change: -0.04 | |
| Week Change: 2.45% Year-to-date Change: -7.0% | |
| TCBI Links: Profile News Message Board | |
| Charts:- Daily , Weekly | |
| Add TCBI to Watchlist: View: Get Complete TCBI Trend Analysis ➞ | |
 | ACA Arcosa, Inc. |
| Sector: Industrials | |
| SubSector: Farm & Construction Machinery | |
| MarketCap: 1692.57 Millions | |
| Recent Price: 76.86 Smart Investing & Trading Score: 10 | |
| Day Percent Change: -0.98% Day Change: -0.76 | |
| Week Change: 1.29% Year-to-date Change: -7.0% | |
| ACA Links: Profile News Message Board | |
| Charts:- Daily , Weekly | |
| Add ACA to Watchlist: View: Get Complete ACA Trend Analysis ➞ | |
 | OMER Omeros Corporation |
| Sector: Health Care | |
| SubSector: Biotechnology | |
| MarketCap: 759.585 Millions | |
| Recent Price: 3.04 Smart Investing & Trading Score: 8 | |
| Day Percent Change: -1.62% Day Change: -0.05 | |
| Week Change: -0.33% Year-to-date Change: -7.0% | |
| OMER Links: Profile News Message Board | |
| Charts:- Daily , Weekly | |
| Add OMER to Watchlist: View: Get Complete OMER Trend Analysis ➞ | |
 | VSH Vishay Intertechnology, Inc. |
| Sector: Technology | |
| SubSector: Semiconductor - Broad Line | |
| MarketCap: 2132.52 Millions | |
| Recent Price: 22.28 Smart Investing & Trading Score: 100 | |
| Day Percent Change: 3.24% Day Change: 0.70 | |
| Week Change: 6.6% Year-to-date Change: -7.1% | |
| VSH Links: Profile News Message Board | |
| Charts:- Daily , Weekly | |
| Add VSH to Watchlist: View: Get Complete VSH Trend Analysis ➞ | |
 | SEAT Vivid Seats Inc. |
| Sector: Services & Goods | |
| SubSector: Internet Content & Information | |
| MarketCap: 1560 Millions | |
| Recent Price: 5.80 Smart Investing & Trading Score: 69 | |
| Day Percent Change: -0.60% Day Change: -0.04 | |
| Week Change: -1.53% Year-to-date Change: -7.1% | |
| SEAT Links: Profile News Message Board | |
| Charts:- Daily , Weekly | |
| Add SEAT to Watchlist: View: Get Complete SEAT Trend Analysis ➞ | |
 | WRBY Warby Parker Inc. |
| Sector: Health Care | |
| SubSector: Medical Instruments & Supplies | |
| MarketCap: 1380 Millions | |
| Recent Price: 13.10 Smart Investing & Trading Score: 88 | |
| Day Percent Change: -2.24% Day Change: -0.30 | |
| Week Change: 8.71% Year-to-date Change: -7.1% | |
| WRBY Links: Profile News Message Board | |
| Charts:- Daily , Weekly | |
| Add WRBY to Watchlist: View: Get Complete WRBY Trend Analysis ➞ | |
 | NUVL Nuvalent, Inc. |
| Sector: Health Care | |
| SubSector: Biotechnology | |
| MarketCap: 2400 Millions | |
| Recent Price: 68.18 Smart Investing & Trading Score: 49 | |
| Day Percent Change: 0.92% Day Change: 0.62 | |
| Week Change: 8.64% Year-to-date Change: -7.2% | |
| NUVL Links: Profile News Message Board | |
| Charts:- Daily , Weekly | |
| Add NUVL to Watchlist: View: Get Complete NUVL Trend Analysis ➞ | |
 | VRCA Verrica Pharmaceuticals Inc. |
| Sector: Health Care | |
| SubSector: Biotechnology | |
| MarketCap: 289.585 Millions | |
| Recent Price: 6.79 Smart Investing & Trading Score: 49 | |
| Day Percent Change: -0.88% Day Change: -0.06 | |
| Week Change: -2.44% Year-to-date Change: -7.2% | |
| VRCA Links: Profile News Message Board | |
| Charts:- Daily , Weekly | |
| Add VRCA to Watchlist: View: Get Complete VRCA Trend Analysis ➞ | |
 | SRCE 1st Source Corporation |
| Sector: Financials | |
| SubSector: Regional - Midwest Banks | |
| MarketCap: 784.77 Millions | |
| Recent Price: 50.96 Smart Investing & Trading Score: 54 | |
| Day Percent Change: 0.37% Day Change: 0.19 | |
| Week Change: 1.9% Year-to-date Change: -7.3% | |
| SRCE Links: Profile News Message Board | |
| Charts:- Daily , Weekly | |
| Add SRCE to Watchlist: View: Get Complete SRCE Trend Analysis ➞ | |
 | GWRS Global Water Resources, Inc. |
| Sector: Utilities | |
| SubSector: Water Utilities | |
| MarketCap: 253.502 Millions | |
| Recent Price: 12.13 Smart Investing & Trading Score: 20 | |
| Day Percent Change: -0.82% Day Change: -0.10 | |
| Week Change: -2.57% Year-to-date Change: -7.3% | |
| GWRS Links: Profile News Message Board | |
| Charts:- Daily , Weekly | |
| Add GWRS to Watchlist: View: Get Complete GWRS Trend Analysis ➞ | |
 | BSRR Sierra Bancorp |
| Sector: Financials | |
| SubSector: Regional - Pacific Banks | |
| MarketCap: 256.929 Millions | |
| Recent Price: 20.90 Smart Investing & Trading Score: 74 | |
| Day Percent Change: 4.71% Day Change: 0.94 | |
| Week Change: 11.47% Year-to-date Change: -7.3% | |
| BSRR Links: Profile News Message Board | |
| Charts:- Daily , Weekly | |
| Add BSRR to Watchlist: View: Get Complete BSRR Trend Analysis ➞ | |
 | CCBG Capital City Bank Group, Inc. |
| Sector: Financials | |
| SubSector: Regional - Mid-Atlantic Banks | |
| MarketCap: 314.459 Millions | |
| Recent Price: 27.26 Smart Investing & Trading Score: 52 | |
| Day Percent Change: 0.29% Day Change: 0.08 | |
| Week Change: 0.63% Year-to-date Change: -7.4% | |
| CCBG Links: Profile News Message Board | |
| Charts:- Daily , Weekly | |
| Add CCBG to Watchlist: View: Get Complete CCBG Trend Analysis ➞ | |
 | WSR Whitestone REIT |
| Sector: Financials | |
| SubSector: REIT - Retail | |
| MarketCap: 316.114 Millions | |
| Recent Price: 11.38 Smart Investing & Trading Score: 42 | |
| Day Percent Change: -1.04% Day Change: -0.12 | |
| Week Change: 1.43% Year-to-date Change: -7.4% | |
| WSR Links: Profile News Message Board | |
| Charts:- Daily , Weekly | |
| Add WSR to Watchlist: View: Get Complete WSR Trend Analysis ➞ | |
| Too many stocks? View smallcap stocks filtered by marketcap & sector |
| Marketcap: All SmallCap Stocks (default-no microcap), Large, Mid-Range, Small & MicroCap |
| Sector: Tech, Finance, Energy, Staples, Retail, Industrial, Materials, Utilities & Medical |
|
Best Stocks Today 12Stocks.com |
© 2024 12Stocks.com Terms & Conditions Privacy Contact Us
All Information Provided Only For Education And Not To Be Used For Investing or Trading. See Terms & Conditions


One More Thing ... Get Best Stocks Delivered Daily!
Never Ever Miss A Move With Our Top Ten Stocks Lists
Find Best Stocks In Any Market - Bull or Bear Market
Take A Peek At Our Top Ten Stocks Lists: Daily, Weekly, Year-to-Date & Top Trends
Find Best Stocks In Any Market - Bull or Bear Market
Take A Peek At Our Top Ten Stocks Lists: Daily, Weekly, Year-to-Date & Top Trends
Smallcap Stocks With Best Up Trends [0-bearish to 100-bullish]: B. Riley[100], Ribbon [100], Group 1[100], Trustmark [100], MBIA [100], Integer [100], EchoStar [100], Comstock Resources[100], Vishay Inter[100], Jamf Holding[100], SunOpta [100]
Best Smallcap Stocks Year-to-Date:
CareMax [574.23%], Janux [352.07%], Viking [249.65%], Alpine Immune[239.13%], Longboard [223.4%], Avidity Biosciences[177.71%], Arcutis Bio[170.9%], Super Micro[165.5%], Vera [149.61%], Hippo [130.79%], Y-mAbs [124.19%] Best Smallcap Stocks This Week:
Matterport [166.09%], B. Riley[48.82%], Seres [30.29%], Riot Blockchain[30.12%], CareMax [27.24%], Ribbon [25.97%], ProKidney [23.28%], SoundHound AI[22.54%], Cipher Mining[22.14%], Hibbett Sports[21.61%], Cullinan Oncology[20.69%] Best Smallcap Stocks Daily:
B. Riley[36.97%], Ribbon [26.46%], Babcock & Wilcox Enterprises[15.57%], Cullinan Oncology[13.55%], Amneal [12.04%], Comtech Tele[10.76%], Innodata [10.28%], Gritstone Oncology[10.06%], Navitas Semiconductor[8.83%], Eyenovia [8.68%], K12 [8.64%]