
 Login Sign Up


| |||||
 |  | ||||

| 12Stocks.com Market Intelligence |
Best SmallCap Stocks
|
| In a hurry? Small Cap Stock Lists: Performance Trends Table, Stock Charts
Sort Small Cap stocks: Daily, Weekly, Year-to-Date, Market Cap & Trends. Filter Small Cap stocks list by sector: Show all, Tech, Finance, Energy, Staples, Retail, Industrial, Materials, Utilities and HealthCare Filter Small Cap stocks list by size: All Large Medium Small and MicroCap |
| 12Stocks.com Small Cap Stocks Performances & Trends Daily | |||||||||
|
|  The overall Smart Investing & Trading Score is 13 (0-bearish to 100-bullish) which puts Small Cap index in short term bearish trend. The Smart Investing & Trading Score from previous trading session is 26 and hence a deterioration of trend.
| ||||||||
Here are the Smart Investing & Trading Scores of the most requested small cap stocks at 12Stocks.com (click stock name for detailed review):
|


| 12Stocks.com: Investing in Smallcap Index with Stocks | |
|
The following table helps investors and traders sort through current performance and trends (as measured by Smart Investing & Trading Score) of various
stocks in the Smallcap Index. Quick View: Move mouse or cursor over stock symbol (ticker) to view short-term technical chart and over stock name to view long term chart. Click on  to add stock symbol to your watchlist and to add stock symbol to your watchlist and  to view watchlist. Click on any ticker or stock name for detailed market intelligence report for that stock. to view watchlist. Click on any ticker or stock name for detailed market intelligence report for that stock. |
12Stocks.com Performance of Stocks in Smallcap Index
| Ticker | Stock Name | Watchlist | Category | Recent Price | Smart Investing & Trading Score | Change % | YTD Change% |
| HTH | Hilltop |   | Financials | 28.64 | 0 | -0.38% | -18.66% |
| GOGO | Gogo | | Technology | 8.24 | 25 | 1.48% | -18.66% |
| DAN | Dana | | Consumer Staples | 11.88 | 17 | 0.08% | -18.69% |
| ARVN | Arvinas | | Health Care | 33.45 | 10 | 0.03% | -18.73% |
| ECPG | Encore Capital | | Financials | 41.22 | 7 | 1.68% | -18.78% |
| CLPT | ClearPoint Neuro | | Health Care | 5.53 | 20 | -0.90% | -18.86% |
| VIAV | Viavi Solutions | | Technology | 8.17 | 17 | -1.80% | -18.87% |
| UUUU | Energy Fuels | | Materials | 5.83 | 0 | 0.52% | -18.92% |
| PANL | Pangaea Logistics | | Transports | 6.68 | 35 | 2.30% | -18.93% |
| HFWA | Heritage Financial | | Financials | 17.34 | 35 | 1.29% | -18.93% |
| NVAX | Novavax | | Health Care | 3.89 | 10 | -2.51% | -18.96% |
| WAFD | Washington Federal | | Financials | 26.70 | 35 | -0.15% | -18.99% |
| TGTX | TG | | Health Care | 13.82 | 0 | -1.29% | -19.09% |
| MHO | M/I Homes | | Industrials | 111.40 | 0 | -1.34% | -19.12% |
| BHB | Bar Harbor | | Financials | 23.72 | 15 | -3.66% | -19.21% |
| MIRM | Mirum | | Health Care | 23.85 | 0 | -0.67% | -19.21% |
| ANGO | AngioDynamics | | Health Care | 6.33 | 63 | -2.76% | -19.26% |
| DLTH | Duluth | | Services & Goods | 4.34 | 0 | -2.25% | -19.33% |
| WABC | Westamerica Ban | | Financials | 45.50 | 0 | -0.26% | -19.34% |
| IPI | Intrepid Potash | | Materials | 19.27 | 43 | 1.21% | -19.34% |
| PETQ | PetIQ | | Health Care | 15.93 | 7 | -1.67% | -19.34% |
| LOB | Live Oak | | Financials | 36.68 | 33 | -0.54% | -19.38% |
| PEBO | Peoples Bancorp | | Financials | 27.21 | 7 | 0.15% | -19.40% |
| CUBI | Customers Bancorp | | Financials | 46.43 | 7 | 0.19% | -19.42% |
| BANR | Banner | | Financials | 43.15 | 27 | 0.42% | -19.44% |


| Too many stocks? View smallcap stocks filtered by marketcap & sector |
| Marketcap: All SmallCap Stocks (default-no microcap), Large, Mid-Range, Small |
| Smallcap Sector: Tech, Finance, Energy, Staples, Retail, Industrial, Materials, & Medical |
|
Get the most comprehensive stock market coverage daily at 12Stocks.com ➞ Best Stocks Today ➞ Best Stocks Weekly ➞ Best Stocks Year-to-Date ➞ Best Stocks Trends ➞  Best Stocks Today 12Stocks.com Best Nasdaq Stocks ➞ Best S&P 500 Stocks ➞ Best Tech Stocks ➞ Best Biotech Stocks ➞ |
| Detailed Overview of SmallCap Stocks |
| SmallCap Technical Overview, Leaders & Laggards, Top SmallCap ETF Funds & Detailed SmallCap Stocks List, Charts, Trends & More |
| Smallcap: Technical Analysis, Trends & YTD Performance | |
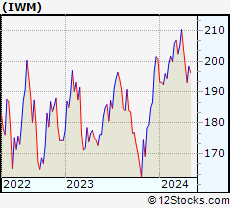
| SmallCap segment as represented by
IWM, an exchange-traded fund [ETF], holds basket of thousands of smallcap stocks from across all major sectors of the US stock market. The smallcap index (contains stocks like Riverbed & Sotheby's) is down by -3.84% and is currently underperforming the overall market by -8.25% year-to-date. Below is a quick view of technical charts and trends: | |
 IWM Weekly Chart |
|
| Long Term Trend: Good | |
| Medium Term Trend: Not Good | |
 IWM Daily Chart |
|
| Short Term Trend: Not Good | |
| Overall Trend Score: 13 | |
| YTD Performance: -3.84% | |
| **Trend Scores & Views Are Only For Educational Purposes And Not For Investing | |
| 12Stocks.com: Top Performing Small Cap Index Stocks | ||||||||||||||||||||||||||||||||||||||||||||||||
 The top performing Small Cap Index stocks year to date are
Now, more recently, over last week, the top performing Small Cap Index stocks on the move are


|
||||||||||||||||||||||||||||||||||||||||||||||||
| 12Stocks.com: Investing in Smallcap Index using Exchange Traded Funds | |
|
The following table shows list of key exchange traded funds (ETF) that
help investors track Smallcap index. The following list also includes leveraged ETF funds that track twice or thrice the daily returns of Smallcap indices. Short or inverse ETF funds move in the opposite direction to the index they track and are useful during market pullbacks or during bear markets. Quick View: Move mouse or cursor over ETF symbol (ticker) to view short-term technical chart and over ETF name to view long term chart. Click on ticker or stock name for detailed view. Click on to add stock symbol to your watchlist and to view watchlist. |
12Stocks.com List of ETFs that track Smallcap Index
| Ticker | ETF Name | Watchlist | Recent Price | Smart Investing & Trading Score | Change % | Week % | Year-to-date % |
| IWM | iShares Russell 2000 | | 193.00 | 13 | -1.06 | -2.86 | -3.84% |
| IJR | iShares Core S&P Small-Cap | | 102.13 | 7 | -0.58 | -2.28 | -5.65% |
| VTWO | Vanguard Russell 2000 ETF | | 78.05 | 13 | -1.04 | -2.83 | -3.76% |
| IWN | iShares Russell 2000 Value | | 146.03 | 0 | -0.77 | -2.89 | -5.99% |
| IWO | iShares Russell 2000 Growth | | 248.02 | 26 | -0.90 | -2.87 | -1.67% |
| IJS | iShares S&P Small-Cap 600 Value | | 94.12 | 7 | -0.57 | -2.13 | -8.68% |
| IJT | iShares S&P Small-Cap 600 Growth | | 121.84 | 13 | -1.02 | -2.36 | -2.64% |
| XSLV | PowerShares S&P SmallCap Low Volatil ETF | | 41.42 | 0 | -0.38 | -1.59 | -6.18% |
| SAA | ProShares Ultra SmallCap600 | | 21.66 | 0 | -1.19 | -3.99 | -13.19% |
| SMLV | SPDR SSGA US Small Cap Low Volatil ETF | | 103.66 | 10 | -0.17 | -1.29 | -7.87% |
| SBB | ProShares Short SmallCap600 | | 16.85 | 93 | 0.42 | 1.83 | 5.78% |
| SDD | ProShares UltraShort SmallCap600 | | 20.60 | 93 | 1.23 | 3.88 | 11.8% |
| 12Stocks.com: Charts, Trends, Fundamental Data and Performances of SmallCap Stocks | |
|
We now take in-depth look at all SmallCap stocks including charts, multi-period performances and overall trends (as measured by Smart Investing & Trading Score). One can sort SmallCap stocks (click link to choose) by Daily, Weekly and by Year-to-Date performances. Also, one can sort by size of the company or by market capitalization. |
| Select Your Default Chart Type: | |||||
| |||||
| Click on stock symbol or name for detailed view. Click on to add stock symbol to your watchlist and to view watchlist. Quick View: Move mouse or cursor over "Daily" to quickly view daily technical stock chart and over "Weekly" to view weekly technical stock chart. | |||||

 | HTH Hilltop Holdings Inc. |
| Sector: Financials | |
| SubSector: Mortgage Investment | |
| MarketCap: 1317.89 Millions | |
| Recent Price: 28.64 Smart Investing & Trading Score: 0 | |
| Day Percent Change: -0.38% Day Change: -0.11 | |
| Week Change: -2.98% Year-to-date Change: -18.7% | |
| HTH Links: Profile News Message Board | |
| Charts:- Daily , Weekly | |
| Add HTH to Watchlist: View: Get Complete HTH Trend Analysis ➞ | |
 | GOGO Gogo Inc. |
| Sector: Technology | |
| SubSector: Diversified Communication Services | |
| MarketCap: 307.064 Millions | |
| Recent Price: 8.24 Smart Investing & Trading Score: 25 | |
| Day Percent Change: 1.48% Day Change: 0.12 | |
| Week Change: -0.84% Year-to-date Change: -18.7% | |
| GOGO Links: Profile News Message Board | |
| Charts:- Daily , Weekly | |
| Add GOGO to Watchlist: View: Get Complete GOGO Trend Analysis ➞ | |
 | DAN Dana Incorporated |
| Sector: Consumer Staples | |
| SubSector: Auto Parts | |
| MarketCap: 1052.59 Millions | |
| Recent Price: 11.88 Smart Investing & Trading Score: 17 | |
| Day Percent Change: 0.08% Day Change: 0.01 | |
| Week Change: -1.08% Year-to-date Change: -18.7% | |
| DAN Links: Profile News Message Board | |
| Charts:- Daily , Weekly | |
| Add DAN to Watchlist: View: Get Complete DAN Trend Analysis ➞ | |
 | ARVN Arvinas, Inc. |
| Sector: Health Care | |
| SubSector: Biotechnology | |
| MarketCap: 3469.85 Millions | |
| Recent Price: 33.45 Smart Investing & Trading Score: 10 | |
| Day Percent Change: 0.03% Day Change: 0.01 | |
| Week Change: -7.83% Year-to-date Change: -18.7% | |
| ARVN Links: Profile News Message Board | |
| Charts:- Daily , Weekly | |
| Add ARVN to Watchlist: View: Get Complete ARVN Trend Analysis ➞ | |
 | ECPG Encore Capital Group, Inc. |
| Sector: Financials | |
| SubSector: Asset Management | |
| MarketCap: 661.503 Millions | |
| Recent Price: 41.22 Smart Investing & Trading Score: 7 | |
| Day Percent Change: 1.68% Day Change: 0.68 | |
| Week Change: -3.74% Year-to-date Change: -18.8% | |
| ECPG Links: Profile News Message Board | |
| Charts:- Daily , Weekly | |
| Add ECPG to Watchlist: View: Get Complete ECPG Trend Analysis ➞ | |
 | CLPT ClearPoint Neuro, Inc. |
| Sector: Health Care | |
| SubSector: Medical Appliances & Equipment | |
| MarketCap: 55.108 Millions | |
| Recent Price: 5.53 Smart Investing & Trading Score: 20 | |
| Day Percent Change: -0.90% Day Change: -0.05 | |
| Week Change: -4.82% Year-to-date Change: -18.9% | |
| CLPT Links: Profile News Message Board | |
| Charts:- Daily , Weekly | |
| Add CLPT to Watchlist: View: Get Complete CLPT Trend Analysis ➞ | |
 | VIAV Viavi Solutions Inc. |
| Sector: Technology | |
| SubSector: Communication Equipment | |
| MarketCap: 2653.29 Millions | |
| Recent Price: 8.17 Smart Investing & Trading Score: 17 | |
| Day Percent Change: -1.80% Day Change: -0.15 | |
| Week Change: -3.31% Year-to-date Change: -18.9% | |
| VIAV Links: Profile News Message Board | |
| Charts:- Daily , Weekly | |
| Add VIAV to Watchlist: View: Get Complete VIAV Trend Analysis ➞ | |
 | UUUU Energy Fuels Inc. |
| Sector: Materials | |
| SubSector: Industrial Metals & Minerals | |
| MarketCap: 107.61 Millions | |
| Recent Price: 5.83 Smart Investing & Trading Score: 0 | |
| Day Percent Change: 0.52% Day Change: 0.03 | |
| Week Change: -5.97% Year-to-date Change: -18.9% | |
| UUUU Links: Profile News Message Board | |
| Charts:- Daily , Weekly | |
| Add UUUU to Watchlist: View: Get Complete UUUU Trend Analysis ➞ | |
 | PANL Pangaea Logistics Solutions, Ltd. |
| Sector: Transports | |
| SubSector: Shipping | |
| MarketCap: 80 Millions | |
| Recent Price: 6.68 Smart Investing & Trading Score: 35 | |
| Day Percent Change: 2.30% Day Change: 0.15 | |
| Week Change: -0.45% Year-to-date Change: -18.9% | |
| PANL Links: Profile News Message Board | |
| Charts:- Daily , Weekly | |
| Add PANL to Watchlist: View: Get Complete PANL Trend Analysis ➞ | |
 | HFWA Heritage Financial Corporation |
| Sector: Financials | |
| SubSector: Regional - Pacific Banks | |
| MarketCap: 752.829 Millions | |
| Recent Price: 17.34 Smart Investing & Trading Score: 35 | |
| Day Percent Change: 1.29% Day Change: 0.22 | |
| Week Change: 0.17% Year-to-date Change: -18.9% | |
| HFWA Links: Profile News Message Board | |
| Charts:- Daily , Weekly | |
| Add HFWA to Watchlist: View: Get Complete HFWA Trend Analysis ➞ | |
 | NVAX Novavax, Inc. |
| Sector: Health Care | |
| SubSector: Biotechnology | |
| MarketCap: 376.185 Millions | |
| Recent Price: 3.89 Smart Investing & Trading Score: 10 | |
| Day Percent Change: -2.51% Day Change: -0.10 | |
| Week Change: -9.11% Year-to-date Change: -19.0% | |
| NVAX Links: Profile News Message Board | |
| Charts:- Daily , Weekly | |
| Add NVAX to Watchlist: View: Get Complete NVAX Trend Analysis ➞ | |
 | WAFD Washington Federal, Inc. |
| Sector: Financials | |
| SubSector: Savings & Loans | |
| MarketCap: 2219.2 Millions | |
| Recent Price: 26.70 Smart Investing & Trading Score: 35 | |
| Day Percent Change: -0.15% Day Change: -0.04 | |
| Week Change: -0.56% Year-to-date Change: -19.0% | |
| WAFD Links: Profile News Message Board | |
| Charts:- Daily , Weekly | |
| Add WAFD to Watchlist: View: Get Complete WAFD Trend Analysis ➞ | |
 | TGTX TG Therapeutics, Inc. |
| Sector: Health Care | |
| SubSector: Biotechnology | |
| MarketCap: 1022.85 Millions | |
| Recent Price: 13.82 Smart Investing & Trading Score: 0 | |
| Day Percent Change: -1.29% Day Change: -0.18 | |
| Week Change: -2.4% Year-to-date Change: -19.1% | |
| TGTX Links: Profile News Message Board | |
| Charts:- Daily , Weekly | |
| Add TGTX to Watchlist: View: Get Complete TGTX Trend Analysis ➞ | |
 | MHO M/I Homes, Inc. |
| Sector: Industrials | |
| SubSector: Residential Construction | |
| MarketCap: 437.106 Millions | |
| Recent Price: 111.40 Smart Investing & Trading Score: 0 | |
| Day Percent Change: -1.34% Day Change: -1.51 | |
| Week Change: -5.4% Year-to-date Change: -19.1% | |
| MHO Links: Profile News Message Board | |
| Charts:- Daily , Weekly | |
| Add MHO to Watchlist: View: Get Complete MHO Trend Analysis ➞ | |
 | BHB Bar Harbor Bankshares |
| Sector: Financials | |
| SubSector: Regional - Northeast Banks | |
| MarketCap: 298.099 Millions | |
| Recent Price: 23.72 Smart Investing & Trading Score: 15 | |
| Day Percent Change: -3.66% Day Change: -0.90 | |
| Week Change: -0.67% Year-to-date Change: -19.2% | |
| BHB Links: Profile News Message Board | |
| Charts:- Daily , Weekly | |
| Add BHB to Watchlist: View: Get Complete BHB Trend Analysis ➞ | |
 | MIRM Mirum Pharmaceuticals, Inc. |
| Sector: Health Care | |
| SubSector: Biotechnology | |
| MarketCap: 309.585 Millions | |
| Recent Price: 23.85 Smart Investing & Trading Score: 0 | |
| Day Percent Change: -0.67% Day Change: -0.16 | |
| Week Change: -2.97% Year-to-date Change: -19.2% | |
| MIRM Links: Profile News Message Board | |
| Charts:- Daily , Weekly | |
| Add MIRM to Watchlist: View: Get Complete MIRM Trend Analysis ➞ | |
 | ANGO AngioDynamics, Inc. |
| Sector: Health Care | |
| SubSector: Medical Instruments & Supplies | |
| MarketCap: 370.86 Millions | |
| Recent Price: 6.33 Smart Investing & Trading Score: 63 | |
| Day Percent Change: -2.76% Day Change: -0.18 | |
| Week Change: -0.63% Year-to-date Change: -19.3% | |
| ANGO Links: Profile News Message Board | |
| Charts:- Daily , Weekly | |
| Add ANGO to Watchlist: View: Get Complete ANGO Trend Analysis ➞ | |
 | DLTH Duluth Holdings Inc. |
| Sector: Services & Goods | |
| SubSector: Apparel Stores | |
| MarketCap: 180.008 Millions | |
| Recent Price: 4.34 Smart Investing & Trading Score: 0 | |
| Day Percent Change: -2.25% Day Change: -0.10 | |
| Week Change: -2.25% Year-to-date Change: -19.3% | |
| DLTH Links: Profile News Message Board | |
| Charts:- Daily , Weekly | |
| Add DLTH to Watchlist: View: Get Complete DLTH Trend Analysis ➞ | |
 | WABC Westamerica Bancorporation |
| Sector: Financials | |
| SubSector: Regional - Pacific Banks | |
| MarketCap: 1557.69 Millions | |
| Recent Price: 45.50 Smart Investing & Trading Score: 0 | |
| Day Percent Change: -0.26% Day Change: -0.12 | |
| Week Change: -2.4% Year-to-date Change: -19.3% | |
| WABC Links: Profile News Message Board | |
| Charts:- Daily , Weekly | |
| Add WABC to Watchlist: View: Get Complete WABC Trend Analysis ➞ | |
 | IPI Intrepid Potash, Inc. |
| Sector: Materials | |
| SubSector: Agricultural Chemicals | |
| MarketCap: 160.329 Millions | |
| Recent Price: 19.27 Smart Investing & Trading Score: 43 | |
| Day Percent Change: 1.21% Day Change: 0.23 | |
| Week Change: -5.59% Year-to-date Change: -19.3% | |
| IPI Links: Profile News Message Board | |
| Charts:- Daily , Weekly | |
| Add IPI to Watchlist: View: Get Complete IPI Trend Analysis ➞ | |
 | PETQ PetIQ, Inc. |
| Sector: Health Care | |
| SubSector: Drugs - Generic | |
| MarketCap: 587.585 Millions | |
| Recent Price: 15.93 Smart Investing & Trading Score: 7 | |
| Day Percent Change: -1.67% Day Change: -0.27 | |
| Week Change: -3.22% Year-to-date Change: -19.3% | |
| PETQ Links: Profile News Message Board | |
| Charts:- Daily , Weekly | |
| Add PETQ to Watchlist: View: Get Complete PETQ Trend Analysis ➞ | |
 | LOB Live Oak Bancshares, Inc. |
| Sector: Financials | |
| SubSector: Savings & Loans | |
| MarketCap: 394.23 Millions | |
| Recent Price: 36.68 Smart Investing & Trading Score: 33 | |
| Day Percent Change: -0.54% Day Change: -0.20 | |
| Week Change: -3.3% Year-to-date Change: -19.4% | |
| LOB Links: Profile News Message Board | |
| Charts:- Daily , Weekly | |
| Add LOB to Watchlist: View: Get Complete LOB Trend Analysis ➞ | |
 | PEBO Peoples Bancorp Inc. |
| Sector: Financials | |
| SubSector: Regional - Midwest Banks | |
| MarketCap: 449.77 Millions | |
| Recent Price: 27.21 Smart Investing & Trading Score: 7 | |
| Day Percent Change: 0.15% Day Change: 0.04 | |
| Week Change: -2.09% Year-to-date Change: -19.4% | |
| PEBO Links: Profile News Message Board | |
| Charts:- Daily , Weekly | |
| Add PEBO to Watchlist: View: Get Complete PEBO Trend Analysis ➞ | |
 | CUBI Customers Bancorp, Inc. |
| Sector: Financials | |
| SubSector: Regional - Northeast Banks | |
| MarketCap: 385.399 Millions | |
| Recent Price: 46.43 Smart Investing & Trading Score: 7 | |
| Day Percent Change: 0.19% Day Change: 0.09 | |
| Week Change: -5.28% Year-to-date Change: -19.4% | |
| CUBI Links: Profile News Message Board | |
| Charts:- Daily , Weekly | |
| Add CUBI to Watchlist: View: Get Complete CUBI Trend Analysis ➞ | |
 | BANR Banner Corporation |
| Sector: Financials | |
| SubSector: Regional - Mid-Atlantic Banks | |
| MarketCap: 1187.09 Millions | |
| Recent Price: 43.15 Smart Investing & Trading Score: 27 | |
| Day Percent Change: 0.42% Day Change: 0.18 | |
| Week Change: -1.75% Year-to-date Change: -19.4% | |
| BANR Links: Profile News Message Board | |
| Charts:- Daily , Weekly | |
| Add BANR to Watchlist: View: Get Complete BANR Trend Analysis ➞ | |
| Too many stocks? View smallcap stocks filtered by marketcap & sector |
| Marketcap: All SmallCap Stocks (default-no microcap), Large, Mid-Range, Small & MicroCap |
| Sector: Tech, Finance, Energy, Staples, Retail, Industrial, Materials, Utilities & Medical |
|
Best Stocks Today 12Stocks.com |
© 2024 12Stocks.com Terms & Conditions Privacy Contact Us
All Information Provided Only For Education And Not To Be Used For Investing or Trading. See Terms & Conditions


One More Thing ... Get Best Stocks Delivered Daily!
Never Ever Miss A Move With Our Top Ten Stocks Lists
Find Best Stocks In Any Market - Bull or Bear Market
Take A Peek At Our Top Ten Stocks Lists: Daily, Weekly, Year-to-Date & Top Trends
Find Best Stocks In Any Market - Bull or Bear Market
Take A Peek At Our Top Ten Stocks Lists: Daily, Weekly, Year-to-Date & Top Trends
Smallcap Stocks With Best Up Trends [0-bearish to 100-bullish]: Vanda [100], Zuora [100], ALX Oncology[100], ProKidney [100], PrimeEnergy Resources[100], IMAX [100], Envestnet [100], Intra-Cellular Therapies[100], Dorian LPG[95], Victory Capital[95], Oscar Health[95]
Best Smallcap Stocks Year-to-Date:
Agenus [552.25%], CareMax [416.49%], Janux [346.07%], Viking [257.17%], Alpine Immune[238.55%], Super Micro[237.75%], Arcutis Bio[217.34%], Longboard [177.91%], Avidity Biosciences[160.56%], Vera [158.46%], Stoke [122.81%] Best Smallcap Stocks This Week:
ProKidney [61.71%], Macatawa Bank[42.75%], Snap One[29.85%], Vanda [27.18%], ALX Oncology[23.41%], Intra-Cellular Therapies[16.41%], Escalade [13.71%], Karyopharm [13.11%], Encore Wire[10.06%], Zuora [10%], Direxion Daily[8.81%] Best Smallcap Stocks Daily:
Vanda [29.38%], Karyopharm [25.45%], Cutera [18.41%], Children s[16.46%], WW [14.10%], Lineage Cell[12.17%], Zuora [11.69%], ALX Oncology[10.97%], Marinus [10.77%], Acrivon [9.19%], Cue Biopharma[9.03%]