
 Login Sign Up


| |||||
 |  | ||||

| 12Stocks.com Market Intelligence |
Best SmallCap Stocks
|
| In a hurry? Small Cap Stock Lists: Performance Trends Table, Stock Charts
Sort Small Cap stocks: Daily, Weekly, Year-to-Date, Market Cap & Trends. Filter Small Cap stocks list by sector: Show all, Tech, Finance, Energy, Staples, Retail, Industrial, Materials, Utilities and HealthCare Filter Small Cap stocks list by size: All Large Medium Small and MicroCap |
| 12Stocks.com Small Cap Stocks Performances & Trends Daily | |||||||||
|
|  The overall Smart Investing & Trading Score is 23 (0-bearish to 100-bullish) which puts Small Cap index in short term bearish to neutral trend. The Smart Investing & Trading Score from previous trading session is 13 and an improvement of trend continues.
| ||||||||
Here are the Smart Investing & Trading Scores of the most requested small cap stocks at 12Stocks.com (click stock name for detailed review):
|


| 12Stocks.com: Investing in Smallcap Index with Stocks | |
|
The following table helps investors and traders sort through current performance and trends (as measured by Smart Investing & Trading Score) of various
stocks in the Smallcap Index. Quick View: Move mouse or cursor over stock symbol (ticker) to view short-term technical chart and over stock name to view long term chart. Click on  to add stock symbol to your watchlist and to add stock symbol to your watchlist and  to view watchlist. Click on any ticker or stock name for detailed market intelligence report for that stock. to view watchlist. Click on any ticker or stock name for detailed market intelligence report for that stock. |
12Stocks.com Performance of Stocks in Smallcap Index
| Ticker | Stock Name | Watchlist | Category | Recent Price | Smart Investing & Trading Score | Change % | YTD Change% |
| VOR | Vor Biopharma |   | Health Care | 1.71 | 22 | 1.48% | -22.97% |
| BKE | Buckle | | Services & Goods | 36.59 | 25 | -0.25% | -23.00% |
| CRMT | America s | | Services & Goods | 58.24 | 37 | 3.70% | -23.14% |
| INDB | Independent Bank | | Financials | 50.56 | 59 | 2.24% | -23.17% |
| REPL | Replimune Group | | Health Care | 6.47 | 10 | -7.17% | -23.25% |
| WK | Workiva | | Technology | 77.86 | 42 | -0.23% | -23.31% |
| VALU | Value Line | | Services & Goods | 37.37 | 28 | 0.97% | -23.34% |
| RWT | Redwood Trust | | Financials | 5.68 | 32 | 0.89% | -23.35% |
| POWI | Power Integrations | | Technology | 62.89 | 0 | -1.67% | -23.41% |
| PRVA | Privia Health | | Health Care | 18.08 | 32 | 1.23% | -23.49% |
| PPBI | Pacific Premier | | Financials | 22.27 | 52 | 4.50% | -23.50% |
| CRSR | Corsair Gaming | | Technology | 10.79 | 17 | 0.37% | -23.53% |
| UVV | Universal | | Consumer Staples | 51.46 | 57 | 1.90% | -23.56% |
| EYPT | EyePoint | | Health Care | 17.66 | 7 | 1.00% | -23.56% |
| III | Information Services | | Technology | 3.60 | 0 | -1.10% | -23.57% |
| RCUS | Arcus Biosciences | | Health Care | 14.59 | 17 | -1.68% | -23.61% |
| GSHD | Goosehead Insurance | | Financials | 57.83 | 32 | 1.99% | -23.71% |
| TLYS | Tilly s | | Services & Goods | 5.75 | 32 | 3.05% | -23.74% |
| OCN | Ocwen Financial | | Financials | 23.45 | 32 | 1.69% | -23.76% |
| SASR | Sandy Spring | | Financials | 20.76 | 52 | 4.06% | -23.79% |
| CBRL | Cracker Barrel | | Services & Goods | 58.70 | 17 | 4.11% | -23.85% |
| RCKT | Rocket | | Health Care | 22.82 | 0 | -2.81% | -23.86% |
| AIRS | AirSculpt | | Health Care | 5.70 | 42 | 5.17% | -23.90% |
| AMN | AMN Healthcare | | Industrials | 56.95 | 45 | 1.15% | -23.94% |
| TMP | Tompkins Financial | | Financials | 45.72 | 52 | 4.65% | -24.09% |


| Too many stocks? View smallcap stocks filtered by marketcap & sector |
| Marketcap: All SmallCap Stocks (default-no microcap), Large, Mid-Range, Small |
| Smallcap Sector: Tech, Finance, Energy, Staples, Retail, Industrial, Materials, & Medical |
|
Get the most comprehensive stock market coverage daily at 12Stocks.com ➞ Best Stocks Today ➞ Best Stocks Weekly ➞ Best Stocks Year-to-Date ➞ Best Stocks Trends ➞  Best Stocks Today 12Stocks.com Best Nasdaq Stocks ➞ Best S&P 500 Stocks ➞ Best Tech Stocks ➞ Best Biotech Stocks ➞ |
| Detailed Overview of SmallCap Stocks |
| SmallCap Technical Overview, Leaders & Laggards, Top SmallCap ETF Funds & Detailed SmallCap Stocks List, Charts, Trends & More |
| Smallcap: Technical Analysis, Trends & YTD Performance | |
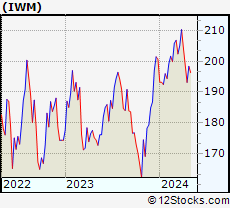
| SmallCap segment as represented by
IWM, an exchange-traded fund [ETF], holds basket of thousands of smallcap stocks from across all major sectors of the US stock market. The smallcap index (contains stocks like Riverbed & Sotheby's) is down by -3.77% and is currently underperforming the overall market by -7.15% year-to-date. Below is a quick view of technical charts and trends: | |
 IWM Weekly Chart |
|
| Long Term Trend: Good | |
| Medium Term Trend: Not Good | |
 IWM Daily Chart |
|
| Short Term Trend: Deteriorating | |
| Overall Trend Score: 23 | |
| YTD Performance: -3.77% | |
| **Trend Scores & Views Are Only For Educational Purposes And Not For Investing | |
| 12Stocks.com: Top Performing Small Cap Index Stocks | ||||||||||||||||||||||||||||||||||||||||||||||||
 The top performing Small Cap Index stocks year to date are
Now, more recently, over last week, the top performing Small Cap Index stocks on the move are


|
||||||||||||||||||||||||||||||||||||||||||||||||
| 12Stocks.com: Investing in Smallcap Index using Exchange Traded Funds | |
|
The following table shows list of key exchange traded funds (ETF) that
help investors track Smallcap index. The following list also includes leveraged ETF funds that track twice or thrice the daily returns of Smallcap indices. Short or inverse ETF funds move in the opposite direction to the index they track and are useful during market pullbacks or during bear markets. Quick View: Move mouse or cursor over ETF symbol (ticker) to view short-term technical chart and over ETF name to view long term chart. Click on ticker or stock name for detailed view. Click on to add stock symbol to your watchlist and to view watchlist. |
12Stocks.com List of ETFs that track Smallcap Index
| Ticker | ETF Name | Watchlist | Recent Price | Smart Investing & Trading Score | Change % | Week % | Year-to-date % |
| IWM | iShares Russell 2000 | | 193.14 | 23 | 0.16 | -2.79 | -3.77% |
| IJR | iShares Core S&P Small-Cap | | 103.22 | 31 | 0.86 | -1.23 | -4.65% |
| IWN | iShares Russell 2000 Value | | 147.78 | 31 | 0.99 | -1.73 | -4.86% |
| VTWO | Vanguard Russell 2000 ETF | | 78.08 | 23 | 0.17 | -2.79 | -3.72% |
| IWO | iShares Russell 2000 Growth | | 245.29 | 23 | -0.67 | -3.94 | -2.75% |
| IJS | iShares S&P Small-Cap 600 Value | | 95.61 | 32 | 1.16 | -0.58 | -7.24% |
| IJT | iShares S&P Small-Cap 600 Growth | | 122.21 | 31 | 0.53 | -2.06 | -2.34% |
| XSLV | PowerShares S&P SmallCap Low Volatil ETF | | 42.18 | 42 | 1.27 | 0.21 | -4.46% |
| SAA | ProShares Ultra SmallCap600 | | 21.80 | 18 | 0.83 | -3.37 | -12.63% |
| SMLV | SPDR SSGA US Small Cap Low Volatil ETF | | 106.09 | 37 | 2.18 | 1.03 | -5.71% |
| SDD | ProShares UltraShort SmallCap600 | | 20.34 | 76 | -1.69 | 2.57 | 10.38% |
| SBB | ProShares Short SmallCap600 | | 16.84 | 76 | -0.82 | 1.77 | 5.71% |
| 12Stocks.com: Charts, Trends, Fundamental Data and Performances of SmallCap Stocks | |
|
We now take in-depth look at all SmallCap stocks including charts, multi-period performances and overall trends (as measured by Smart Investing & Trading Score). One can sort SmallCap stocks (click link to choose) by Daily, Weekly and by Year-to-Date performances. Also, one can sort by size of the company or by market capitalization. |
| Select Your Default Chart Type: | |||||
| |||||
| Click on stock symbol or name for detailed view. Click on to add stock symbol to your watchlist and to view watchlist. Quick View: Move mouse or cursor over "Daily" to quickly view daily technical stock chart and over "Weekly" to view weekly technical stock chart. | |||||

 | VOR Vor Biopharma Inc. |
| Sector: Health Care | |
| SubSector: Biotechnology | |
| MarketCap: 224 Millions | |
| Recent Price: 1.71 Smart Investing & Trading Score: 22 | |
| Day Percent Change: 1.48% Day Change: 0.02 | |
| Week Change: -10% Year-to-date Change: -23.0% | |
| VOR Links: Profile News Message Board | |
| Charts:- Daily , Weekly | |
| Add VOR to Watchlist: View: Get Complete VOR Trend Analysis ➞ | |
 | BKE The Buckle, Inc. |
| Sector: Services & Goods | |
| SubSector: Apparel Stores | |
| MarketCap: 913.808 Millions | |
| Recent Price: 36.59 Smart Investing & Trading Score: 25 | |
| Day Percent Change: -0.25% Day Change: -0.09 | |
| Week Change: -0.65% Year-to-date Change: -23.0% | |
| BKE Links: Profile News Message Board | |
| Charts:- Daily , Weekly | |
| Add BKE to Watchlist: View: Get Complete BKE Trend Analysis ➞ | |
 | CRMT America s Car-Mart, Inc. |
| Sector: Services & Goods | |
| SubSector: Auto Dealerships | |
| MarketCap: 329.921 Millions | |
| Recent Price: 58.24 Smart Investing & Trading Score: 37 | |
| Day Percent Change: 3.70% Day Change: 2.08 | |
| Week Change: 2.79% Year-to-date Change: -23.1% | |
| CRMT Links: Profile News Message Board | |
| Charts:- Daily , Weekly | |
| Add CRMT to Watchlist: View: Get Complete CRMT Trend Analysis ➞ | |
 | INDB Independent Bank Corp. |
| Sector: Financials | |
| SubSector: Regional - Northeast Banks | |
| MarketCap: 2347.09 Millions | |
| Recent Price: 50.56 Smart Investing & Trading Score: 59 | |
| Day Percent Change: 2.24% Day Change: 1.11 | |
| Week Change: 3.95% Year-to-date Change: -23.2% | |
| INDB Links: Profile News Message Board | |
| Charts:- Daily , Weekly | |
| Add INDB to Watchlist: View: Get Complete INDB Trend Analysis ➞ | |
 | REPL Replimune Group, Inc. |
| Sector: Health Care | |
| SubSector: Biotechnology | |
| MarketCap: 367.885 Millions | |
| Recent Price: 6.47 Smart Investing & Trading Score: 10 | |
| Day Percent Change: -7.17% Day Change: -0.50 | |
| Week Change: -9.38% Year-to-date Change: -23.3% | |
| REPL Links: Profile News Message Board | |
| Charts:- Daily , Weekly | |
| Add REPL to Watchlist: View: Get Complete REPL Trend Analysis ➞ | |
 | WK Workiva Inc. |
| Sector: Technology | |
| SubSector: Application Software | |
| MarketCap: 1537.42 Millions | |
| Recent Price: 77.86 Smart Investing & Trading Score: 42 | |
| Day Percent Change: -0.23% Day Change: -0.18 | |
| Week Change: -0.78% Year-to-date Change: -23.3% | |
| WK Links: Profile News Message Board | |
| Charts:- Daily , Weekly | |
| Add WK to Watchlist: View: Get Complete WK Trend Analysis ➞ | |
 | VALU Value Line, Inc. |
| Sector: Services & Goods | |
| SubSector: Publishing - Periodicals | |
| MarketCap: 254.3 Millions | |
| Recent Price: 37.37 Smart Investing & Trading Score: 28 | |
| Day Percent Change: 0.97% Day Change: 0.36 | |
| Week Change: -5.03% Year-to-date Change: -23.3% | |
| VALU Links: Profile News Message Board | |
| Charts:- Daily , Weekly | |
| Add VALU to Watchlist: View: Get Complete VALU Trend Analysis ➞ | |
 | RWT Redwood Trust, Inc. |
| Sector: Financials | |
| SubSector: Mortgage Investment | |
| MarketCap: 674.739 Millions | |
| Recent Price: 5.68 Smart Investing & Trading Score: 32 | |
| Day Percent Change: 0.89% Day Change: 0.05 | |
| Week Change: -0.87% Year-to-date Change: -23.4% | |
| RWT Links: Profile News Message Board | |
| Charts:- Daily , Weekly | |
| Add RWT to Watchlist: View: Get Complete RWT Trend Analysis ➞ | |
 | POWI Power Integrations, Inc. |
| Sector: Technology | |
| SubSector: Semiconductor - Integrated Circuits | |
| MarketCap: 2612.1 Millions | |
| Recent Price: 62.89 Smart Investing & Trading Score: 0 | |
| Day Percent Change: -1.67% Day Change: -1.07 | |
| Week Change: -7.57% Year-to-date Change: -23.4% | |
| POWI Links: Profile News Message Board | |
| Charts:- Daily , Weekly | |
| Add POWI to Watchlist: View: Get Complete POWI Trend Analysis ➞ | |
 | PRVA Privia Health Group, Inc. |
| Sector: Health Care | |
| SubSector: Health Information Services | |
| MarketCap: 3130 Millions | |
| Recent Price: 18.08 Smart Investing & Trading Score: 32 | |
| Day Percent Change: 1.23% Day Change: 0.22 | |
| Week Change: -2.48% Year-to-date Change: -23.5% | |
| PRVA Links: Profile News Message Board | |
| Charts:- Daily , Weekly | |
| Add PRVA to Watchlist: View: Get Complete PRVA Trend Analysis ➞ | |
 | PPBI Pacific Premier Bancorp, Inc. |
| Sector: Financials | |
| SubSector: Regional - Pacific Banks | |
| MarketCap: 978.029 Millions | |
| Recent Price: 22.27 Smart Investing & Trading Score: 52 | |
| Day Percent Change: 4.50% Day Change: 0.96 | |
| Week Change: 1.88% Year-to-date Change: -23.5% | |
| PPBI Links: Profile News Message Board | |
| Charts:- Daily , Weekly | |
| Add PPBI to Watchlist: View: Get Complete PPBI Trend Analysis ➞ | |
 | CRSR Corsair Gaming, Inc. |
| Sector: Technology | |
| SubSector: Computer Hardware | |
| MarketCap: 32187 Millions | |
| Recent Price: 10.79 Smart Investing & Trading Score: 17 | |
| Day Percent Change: 0.37% Day Change: 0.04 | |
| Week Change: -6.5% Year-to-date Change: -23.5% | |
| CRSR Links: Profile News Message Board | |
| Charts:- Daily , Weekly | |
| Add CRSR to Watchlist: View: Get Complete CRSR Trend Analysis ➞ | |
 | UVV Universal Corporation |
| Sector: Consumer Staples | |
| SubSector: Tobacco Products, Other | |
| MarketCap: 1107.7 Millions | |
| Recent Price: 51.46 Smart Investing & Trading Score: 57 | |
| Day Percent Change: 1.90% Day Change: 0.96 | |
| Week Change: 5.99% Year-to-date Change: -23.6% | |
| UVV Links: Profile News Message Board | |
| Charts:- Daily , Weekly | |
| Add UVV to Watchlist: View: Get Complete UVV Trend Analysis ➞ | |
 | EYPT EyePoint Pharmaceuticals, Inc. |
| Sector: Health Care | |
| SubSector: Biotechnology | |
| MarketCap: 125.085 Millions | |
| Recent Price: 17.66 Smart Investing & Trading Score: 7 | |
| Day Percent Change: 1.00% Day Change: 0.18 | |
| Week Change: -22.83% Year-to-date Change: -23.6% | |
| EYPT Links: Profile News Message Board | |
| Charts:- Daily , Weekly | |
| Add EYPT to Watchlist: View: Get Complete EYPT Trend Analysis ➞ | |
 | III Information Services Group, Inc. |
| Sector: Technology | |
| SubSector: Information Technology Services | |
| MarketCap: 166.968 Millions | |
| Recent Price: 3.60 Smart Investing & Trading Score: 0 | |
| Day Percent Change: -1.10% Day Change: -0.04 | |
| Week Change: -2.44% Year-to-date Change: -23.6% | |
| III Links: Profile News Message Board | |
| Charts:- Daily , Weekly | |
| Add III to Watchlist: View: Get Complete III Trend Analysis ➞ | |
 | RCUS Arcus Biosciences, Inc. |
| Sector: Health Care | |
| SubSector: Biotechnology | |
| MarketCap: 539.285 Millions | |
| Recent Price: 14.59 Smart Investing & Trading Score: 17 | |
| Day Percent Change: -1.68% Day Change: -0.25 | |
| Week Change: -12% Year-to-date Change: -23.6% | |
| RCUS Links: Profile News Message Board | |
| Charts:- Daily , Weekly | |
| Add RCUS to Watchlist: View: Get Complete RCUS Trend Analysis ➞ | |
 | GSHD Goosehead Insurance, Inc |
| Sector: Financials | |
| SubSector: Insurance Brokers | |
| MarketCap: 1863.57 Millions | |
| Recent Price: 57.83 Smart Investing & Trading Score: 32 | |
| Day Percent Change: 1.99% Day Change: 1.13 | |
| Week Change: -0.43% Year-to-date Change: -23.7% | |
| GSHD Links: Profile News Message Board | |
| Charts:- Daily , Weekly | |
| Add GSHD to Watchlist: View: Get Complete GSHD Trend Analysis ➞ | |
 | TLYS Tilly s, Inc. |
| Sector: Services & Goods | |
| SubSector: Apparel Stores | |
| MarketCap: 127.408 Millions | |
| Recent Price: 5.75 Smart Investing & Trading Score: 32 | |
| Day Percent Change: 3.05% Day Change: 0.17 | |
| Week Change: -1.54% Year-to-date Change: -23.7% | |
| TLYS Links: Profile News Message Board | |
| Charts:- Daily , Weekly | |
| Add TLYS to Watchlist: View: Get Complete TLYS Trend Analysis ➞ | |
 | OCN Ocwen Financial Corporation |
| Sector: Financials | |
| SubSector: Mortgage Investment | |
| MarketCap: 73.7739 Millions | |
| Recent Price: 23.45 Smart Investing & Trading Score: 32 | |
| Day Percent Change: 1.69% Day Change: 0.39 | |
| Week Change: -0.55% Year-to-date Change: -23.8% | |
| OCN Links: Profile News Message Board | |
| Charts:- Daily , Weekly | |
| Add OCN to Watchlist: View: Get Complete OCN Trend Analysis ➞ | |
 | SASR Sandy Spring Bancorp, Inc. |
| Sector: Financials | |
| SubSector: Regional - Mid-Atlantic Banks | |
| MarketCap: 764.659 Millions | |
| Recent Price: 20.76 Smart Investing & Trading Score: 52 | |
| Day Percent Change: 4.06% Day Change: 0.81 | |
| Week Change: 2.27% Year-to-date Change: -23.8% | |
| SASR Links: Profile News Message Board | |
| Charts:- Daily , Weekly | |
| Add SASR to Watchlist: View: Get Complete SASR Trend Analysis ➞ | |
 | CBRL Cracker Barrel Old Country Store, Inc. |
| Sector: Services & Goods | |
| SubSector: Restaurants | |
| MarketCap: 1839.6 Millions | |
| Recent Price: 58.70 Smart Investing & Trading Score: 17 | |
| Day Percent Change: 4.11% Day Change: 2.32 | |
| Week Change: -0.78% Year-to-date Change: -23.9% | |
| CBRL Links: Profile News Message Board | |
| Charts:- Daily , Weekly | |
| Add CBRL to Watchlist: View: Get Complete CBRL Trend Analysis ➞ | |
 | RCKT Rocket Pharmaceuticals, Inc. |
| Sector: Health Care | |
| SubSector: Biotechnology | |
| MarketCap: 899.585 Millions | |
| Recent Price: 22.82 Smart Investing & Trading Score: 0 | |
| Day Percent Change: -2.81% Day Change: -0.66 | |
| Week Change: -5.66% Year-to-date Change: -23.9% | |
| RCKT Links: Profile News Message Board | |
| Charts:- Daily , Weekly | |
| Add RCKT to Watchlist: View: Get Complete RCKT Trend Analysis ➞ | |
 | AIRS AirSculpt Technologies, Inc. |
| Sector: Health Care | |
| SubSector: Medical Care Facilities | |
| MarketCap: 497 Millions | |
| Recent Price: 5.70 Smart Investing & Trading Score: 42 | |
| Day Percent Change: 5.17% Day Change: 0.28 | |
| Week Change: 4.78% Year-to-date Change: -23.9% | |
| AIRS Links: Profile News Message Board | |
| Charts:- Daily , Weekly | |
| Add AIRS to Watchlist: View: Get Complete AIRS Trend Analysis ➞ | |
 | AMN AMN Healthcare Services, Inc. |
| Sector: Industrials | |
| SubSector: General Building Materials | |
| MarketCap: 3064.03 Millions | |
| Recent Price: 56.95 Smart Investing & Trading Score: 45 | |
| Day Percent Change: 1.15% Day Change: 0.65 | |
| Week Change: 0.57% Year-to-date Change: -23.9% | |
| AMN Links: Profile News Message Board | |
| Charts:- Daily , Weekly | |
| Add AMN to Watchlist: View: Get Complete AMN Trend Analysis ➞ | |
 | TMP Tompkins Financial Corporation |
| Sector: Financials | |
| SubSector: Regional - Northeast Banks | |
| MarketCap: 1144.79 Millions | |
| Recent Price: 45.72 Smart Investing & Trading Score: 52 | |
| Day Percent Change: 4.65% Day Change: 2.03 | |
| Week Change: 3.14% Year-to-date Change: -24.1% | |
| TMP Links: Profile News Message Board | |
| Charts:- Daily , Weekly | |
| Add TMP to Watchlist: View: Get Complete TMP Trend Analysis ➞ | |
| Too many stocks? View smallcap stocks filtered by marketcap & sector |
| Marketcap: All SmallCap Stocks (default-no microcap), Large, Mid-Range, Small & MicroCap |
| Sector: Tech, Finance, Energy, Staples, Retail, Industrial, Materials, Utilities & Medical |
|
Best Stocks Today 12Stocks.com |
© 2024 12Stocks.com Terms & Conditions Privacy Contact Us
All Information Provided Only For Education And Not To Be Used For Investing or Trading. See Terms & Conditions


One More Thing ... Get Best Stocks Delivered Daily!
Never Ever Miss A Move With Our Top Ten Stocks Lists
Find Best Stocks In Any Market - Bull or Bear Market
Take A Peek At Our Top Ten Stocks Lists: Daily, Weekly, Year-to-Date & Top Trends
Find Best Stocks In Any Market - Bull or Bear Market
Take A Peek At Our Top Ten Stocks Lists: Daily, Weekly, Year-to-Date & Top Trends
Smallcap Stocks With Best Up Trends [0-bearish to 100-bullish]: Vertex Energy[100], BancFirst [100], Calavo Growers[100], Old Second[100], Excelerate Energy[100], Gannett Co[100], Core Molding[100], Angel Oak[100], Tejon Ranch[100], United Fire[100], Victory Capital[100]
Best Smallcap Stocks Year-to-Date:
Agenus [541.38%], CareMax [429.9%], Janux [353.14%], Viking [240.78%], Alpine Immune[238.94%], Longboard [185.43%], Arcutis Bio[181.42%], Avidity Biosciences[153.65%], Super Micro[151.06%], Vera [145.48%], Stoke [129.66%] Best Smallcap Stocks This Week:
Macatawa Bank[47.34%], Vertex Energy[43.27%], Snap One[29.73%], Humacyte [28.47%], Vanda [24.03%], ALX Oncology[22.49%], ContextLogic [16.8%], ProKidney [16.57%], Calavo Growers[16.24%], Badger Meter[15.61%], Accolade [13.45%] Best Smallcap Stocks Daily:
Tellurian [28.11%], Origin Materials[19.59%], Metropolitan Bank[18.01%], Genelux [14.25%], Humacyte [14.02%], Vertex Energy[13.74%], Chemung Financial[10.29%], Gevo [10.14%], Riot Blockchain[10.13%], Marathon Patent[9.78%], Emergent BioSolutions[9.68%]