
 Login Sign Up


| |||||
 |  | ||||

| 12Stocks.com Market Intelligence |
Best SmallCap Stocks
|
| In a hurry? Small Cap Stock Lists: Performance Trends Table, Stock Charts
Sort Small Cap stocks: Daily, Weekly, Year-to-Date, Market Cap & Trends. Filter Small Cap stocks list by sector: Show all, Tech, Finance, Energy, Staples, Retail, Industrial, Materials, Utilities and HealthCare Filter Small Cap stocks list by size: All Large Medium Small and MicroCap |
| 12Stocks.com Small Cap Stocks Performances & Trends Daily | |||||||||
|
|  The overall Smart Investing & Trading Score is 13 (0-bearish to 100-bullish) which puts Small Cap index in short term bearish trend. The Smart Investing & Trading Score from previous trading session is 26 and hence a deterioration of trend.
| ||||||||
Here are the Smart Investing & Trading Scores of the most requested small cap stocks at 12Stocks.com (click stock name for detailed review):
|


| 12Stocks.com: Investing in Smallcap Index with Stocks | |
|
The following table helps investors and traders sort through current performance and trends (as measured by Smart Investing & Trading Score) of various
stocks in the Smallcap Index. Quick View: Move mouse or cursor over stock symbol (ticker) to view short-term technical chart and over stock name to view long term chart. Click on  to add stock symbol to your watchlist and to add stock symbol to your watchlist and  to view watchlist. Click on any ticker or stock name for detailed market intelligence report for that stock. to view watchlist. Click on any ticker or stock name for detailed market intelligence report for that stock. |
12Stocks.com Performance of Stocks in Smallcap Index
| Ticker | Stock Name | Watchlist | Category | Recent Price | Smart Investing & Trading Score | Change % | YTD Change% |
| ATOM | Atomera |   | Technology | 5.64 | 55 | -6.62% | -19.54% |
| SJW | SJW Group | | Utilities | 52.56 | 35 | 1.19% | -19.57% |
| MPB | Mid Penn | | Financials | 19.52 | 45 | 0.80% | -19.60% |
| JJSF | J & J Snack Foods | | Consumer Staples | 134.22 | 28 | -0.59% | -19.70% |
| UTMD | Utah Medical | | Health Care | 67.62 | 20 | -0.73% | -19.71% |
| GIII | G-III Apparel | | Consumer Staples | 27.28 | 17 | -1.69% | -19.72% |
| USNA | USANA Health | | Health Care | 43.01 | 17 | -0.42% | -19.76% |
| HBCP | Home Bancorp | | Financials | 33.70 | 0 | -1.35% | -19.78% |
| EWCZ | European Wax | | Consumer Staples | 10.86 | 0 | -2.86% | -19.79% |
| SMP | Standard Motor | | Consumer Staples | 31.91 | 25 | -0.34% | -19.84% |
| AKYA | Akoya Biosciences | | Health Care | 3.92 | 0 | -1.51% | -19.84% |
| FLWS | 1-800-FLOWERS.COM | | Services & Goods | 8.64 | 10 | -0.69% | -19.85% |
| ROG | Rogers | | Technology | 105.82 | 10 | -3.57% | -19.88% |
| ABR | Arbor Realty | | Financials | 12.15 | 25 | 0.66% | -19.96% |
| FMAO | Farmers & Merchants Bancorp | | Financials | 19.85 | 0 | -1.88% | -19.96% |
| PRLB | Proto Labs | | Industrials | 31.17 | 0 | -0.76% | -19.99% |
| PKBK | Parke Bancorp | | Financials | 16.20 | 27 | 0.43% | -20.00% |
| PZZA | Papa John | | Services & Goods | 60.95 | 10 | -1.28% | -20.04% |
| FBMS | First Bancshares | | Financials | 23.45 | 27 | 1.30% | -20.05% |
| NYMT | New York | | Financials | 6.82 | 27 | 1.34% | -20.05% |
| CHMG | Chemung Financial | | Financials | 39.80 | 27 | 0.66% | -20.08% |
| CCNE | CNB Financial | | Financials | 18.05 | 0 | -2.22% | -20.10% |
| POWI | Power Integrations | | Technology | 65.59 | 0 | -1.87% | -20.12% |
| OIS | Oil States | | Energy | 5.42 | 0 | -2.69% | -20.18% |
| AMAL | Amalgamated Bank | | Financials | 21.49 | 17 | -0.28% | -20.23% |


| Too many stocks? View smallcap stocks filtered by marketcap & sector |
| Marketcap: All SmallCap Stocks (default-no microcap), Large, Mid-Range, Small |
| Smallcap Sector: Tech, Finance, Energy, Staples, Retail, Industrial, Materials, & Medical |
|
Get the most comprehensive stock market coverage daily at 12Stocks.com ➞ Best Stocks Today ➞ Best Stocks Weekly ➞ Best Stocks Year-to-Date ➞ Best Stocks Trends ➞  Best Stocks Today 12Stocks.com Best Nasdaq Stocks ➞ Best S&P 500 Stocks ➞ Best Tech Stocks ➞ Best Biotech Stocks ➞ |
| Detailed Overview of SmallCap Stocks |
| SmallCap Technical Overview, Leaders & Laggards, Top SmallCap ETF Funds & Detailed SmallCap Stocks List, Charts, Trends & More |
| Smallcap: Technical Analysis, Trends & YTD Performance | |
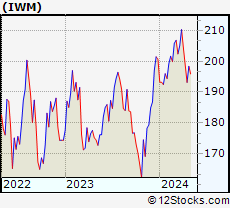
| SmallCap segment as represented by
IWM, an exchange-traded fund [ETF], holds basket of thousands of smallcap stocks from across all major sectors of the US stock market. The smallcap index (contains stocks like Riverbed & Sotheby's) is down by -3.84% and is currently underperforming the overall market by -8.25% year-to-date. Below is a quick view of technical charts and trends: | |
 IWM Weekly Chart |
|
| Long Term Trend: Good | |
| Medium Term Trend: Not Good | |
 IWM Daily Chart |
|
| Short Term Trend: Not Good | |
| Overall Trend Score: 13 | |
| YTD Performance: -3.84% | |
| **Trend Scores & Views Are Only For Educational Purposes And Not For Investing | |
| 12Stocks.com: Top Performing Small Cap Index Stocks | ||||||||||||||||||||||||||||||||||||||||||||||||
 The top performing Small Cap Index stocks year to date are
Now, more recently, over last week, the top performing Small Cap Index stocks on the move are


|
||||||||||||||||||||||||||||||||||||||||||||||||
| 12Stocks.com: Investing in Smallcap Index using Exchange Traded Funds | |
|
The following table shows list of key exchange traded funds (ETF) that
help investors track Smallcap index. The following list also includes leveraged ETF funds that track twice or thrice the daily returns of Smallcap indices. Short or inverse ETF funds move in the opposite direction to the index they track and are useful during market pullbacks or during bear markets. Quick View: Move mouse or cursor over ETF symbol (ticker) to view short-term technical chart and over ETF name to view long term chart. Click on ticker or stock name for detailed view. Click on to add stock symbol to your watchlist and to view watchlist. |
12Stocks.com List of ETFs that track Smallcap Index
| Ticker | ETF Name | Watchlist | Recent Price | Smart Investing & Trading Score | Change % | Week % | Year-to-date % |
| IWM | iShares Russell 2000 | | 193.00 | 13 | -1.06 | -2.86 | -3.84% |
| IJR | iShares Core S&P Small-Cap | | 102.13 | 17 | -0.58 | -2.28 | -5.65% |
| VTWO | Vanguard Russell 2000 ETF | | 78.05 | 36 | -1.04 | -2.83 | -3.76% |
| IWN | iShares Russell 2000 Value | | 146.03 | 23 | -0.77 | -2.89 | -5.99% |
| IWO | iShares Russell 2000 Growth | | 248.02 | 36 | -0.90 | -2.87 | -1.67% |
| IJS | iShares S&P Small-Cap 600 Value | | 94.12 | 17 | -0.57 | -2.13 | -8.68% |
| IJT | iShares S&P Small-Cap 600 Growth | | 121.84 | 41 | -1.02 | -2.36 | -2.64% |
| XSLV | PowerShares S&P SmallCap Low Volatil ETF | | 41.42 | 10 | -0.38 | -1.59 | -6.18% |
| SAA | ProShares Ultra SmallCap600 | | 21.66 | 0 | -1.19 | -3.99 | -13.19% |
| SMLV | SPDR SSGA US Small Cap Low Volatil ETF | | 103.66 | 10 | -0.17 | -1.29 | -7.87% |
| SBB | ProShares Short SmallCap600 | | 16.85 | 93 | 0.42 | 1.83 | 5.78% |
| SDD | ProShares UltraShort SmallCap600 | | 20.60 | 93 | 1.23 | 3.88 | 11.8% |
| 12Stocks.com: Charts, Trends, Fundamental Data and Performances of SmallCap Stocks | |
|
We now take in-depth look at all SmallCap stocks including charts, multi-period performances and overall trends (as measured by Smart Investing & Trading Score). One can sort SmallCap stocks (click link to choose) by Daily, Weekly and by Year-to-Date performances. Also, one can sort by size of the company or by market capitalization. |
| Select Your Default Chart Type: | |||||
| |||||
| Click on stock symbol or name for detailed view. Click on to add stock symbol to your watchlist and to view watchlist. Quick View: Move mouse or cursor over "Daily" to quickly view daily technical stock chart and over "Weekly" to view weekly technical stock chart. | |||||

 | ATOM Atomera Incorporated |
| Sector: Technology | |
| SubSector: Semiconductor Equipment & Materials | |
| MarketCap: 60.6918 Millions | |
| Recent Price: 5.64 Smart Investing & Trading Score: 55 | |
| Day Percent Change: -6.62% Day Change: -0.40 | |
| Week Change: -6.78% Year-to-date Change: -19.5% | |
| ATOM Links: Profile News Message Board | |
| Charts:- Daily , Weekly | |
| Add ATOM to Watchlist: View: Get Complete ATOM Trend Analysis ➞ | |
 | SJW SJW Group |
| Sector: Utilities | |
| SubSector: Water Utilities | |
| MarketCap: 1571.62 Millions | |
| Recent Price: 52.56 Smart Investing & Trading Score: 35 | |
| Day Percent Change: 1.19% Day Change: 0.62 | |
| Week Change: -0.49% Year-to-date Change: -19.6% | |
| SJW Links: Profile News Message Board | |
| Charts:- Daily , Weekly | |
| Add SJW to Watchlist: View: Get Complete SJW Trend Analysis ➞ | |
 | MPB Mid Penn Bancorp, Inc. |
| Sector: Financials | |
| SubSector: Regional - Northeast Banks | |
| MarketCap: 187.699 Millions | |
| Recent Price: 19.52 Smart Investing & Trading Score: 45 | |
| Day Percent Change: 0.80% Day Change: 0.16 | |
| Week Change: -0.81% Year-to-date Change: -19.6% | |
| MPB Links: Profile News Message Board | |
| Charts:- Daily , Weekly | |
| Add MPB to Watchlist: View: Get Complete MPB Trend Analysis ➞ | |
 | JJSF J & J Snack Foods Corp. |
| Sector: Consumer Staples | |
| SubSector: Processed & Packaged Goods | |
| MarketCap: 2706.28 Millions | |
| Recent Price: 134.22 Smart Investing & Trading Score: 28 | |
| Day Percent Change: -0.59% Day Change: -0.80 | |
| Week Change: -0.27% Year-to-date Change: -19.7% | |
| JJSF Links: Profile News Message Board | |
| Charts:- Daily , Weekly | |
| Add JJSF to Watchlist: View: Get Complete JJSF Trend Analysis ➞ | |
 | UTMD Utah Medical Products, Inc. |
| Sector: Health Care | |
| SubSector: Medical Instruments & Supplies | |
| MarketCap: 285.86 Millions | |
| Recent Price: 67.62 Smart Investing & Trading Score: 20 | |
| Day Percent Change: -0.73% Day Change: -0.50 | |
| Week Change: -1.51% Year-to-date Change: -19.7% | |
| UTMD Links: Profile News Message Board | |
| Charts:- Daily , Weekly | |
| Add UTMD to Watchlist: View: Get Complete UTMD Trend Analysis ➞ | |
 | GIII G-III Apparel Group, Ltd. |
| Sector: Consumer Staples | |
| SubSector: Textile - Apparel Clothing | |
| MarketCap: 354.365 Millions | |
| Recent Price: 27.28 Smart Investing & Trading Score: 17 | |
| Day Percent Change: -1.69% Day Change: -0.47 | |
| Week Change: -2.26% Year-to-date Change: -19.7% | |
| GIII Links: Profile News Message Board | |
| Charts:- Daily , Weekly | |
| Add GIII to Watchlist: View: Get Complete GIII Trend Analysis ➞ | |
 | USNA USANA Health Sciences, Inc. |
| Sector: Health Care | |
| SubSector: Drug Related Products | |
| MarketCap: 1185.13 Millions | |
| Recent Price: 43.01 Smart Investing & Trading Score: 17 | |
| Day Percent Change: -0.42% Day Change: -0.18 | |
| Week Change: -2.18% Year-to-date Change: -19.8% | |
| USNA Links: Profile News Message Board | |
| Charts:- Daily , Weekly | |
| Add USNA to Watchlist: View: Get Complete USNA Trend Analysis ➞ | |
 | HBCP Home Bancorp, Inc. |
| Sector: Financials | |
| SubSector: Savings & Loans | |
| MarketCap: 206.83 Millions | |
| Recent Price: 33.70 Smart Investing & Trading Score: 0 | |
| Day Percent Change: -1.35% Day Change: -0.46 | |
| Week Change: -2.88% Year-to-date Change: -19.8% | |
| HBCP Links: Profile News Message Board | |
| Charts:- Daily , Weekly | |
| Add HBCP to Watchlist: View: Get Complete HBCP Trend Analysis ➞ | |
 | EWCZ European Wax Center, Inc. |
| Sector: Consumer Staples | |
| SubSector: Household & Personal Products | |
| MarketCap: 1180 Millions | |
| Recent Price: 10.86 Smart Investing & Trading Score: 0 | |
| Day Percent Change: -2.86% Day Change: -0.32 | |
| Week Change: -9.42% Year-to-date Change: -19.8% | |
| EWCZ Links: Profile News Message Board | |
| Charts:- Daily , Weekly | |
| Add EWCZ to Watchlist: View: Get Complete EWCZ Trend Analysis ➞ | |
 | SMP Standard Motor Products, Inc. |
| Sector: Consumer Staples | |
| SubSector: Auto Parts | |
| MarketCap: 909.939 Millions | |
| Recent Price: 31.91 Smart Investing & Trading Score: 25 | |
| Day Percent Change: -0.34% Day Change: -0.11 | |
| Week Change: -0.65% Year-to-date Change: -19.8% | |
| SMP Links: Profile News Message Board | |
| Charts:- Daily , Weekly | |
| Add SMP to Watchlist: View: Get Complete SMP Trend Analysis ➞ | |
 | AKYA Akoya Biosciences, Inc. |
| Sector: Health Care | |
| SubSector: Medical Instruments & Supplies | |
| MarketCap: 340 Millions | |
| Recent Price: 3.92 Smart Investing & Trading Score: 0 | |
| Day Percent Change: -1.51% Day Change: -0.06 | |
| Week Change: -5.08% Year-to-date Change: -19.8% | |
| AKYA Links: Profile News Message Board | |
| Charts:- Daily , Weekly | |
| Add AKYA to Watchlist: View: Get Complete AKYA Trend Analysis ➞ | |
 | FLWS 1-800-FLOWERS.COM, Inc. |
| Sector: Services & Goods | |
| SubSector: Specialty Retail, Other | |
| MarketCap: 940 Millions | |
| Recent Price: 8.64 Smart Investing & Trading Score: 10 | |
| Day Percent Change: -0.69% Day Change: -0.06 | |
| Week Change: -3.36% Year-to-date Change: -19.9% | |
| FLWS Links: Profile News Message Board | |
| Charts:- Daily , Weekly | |
| Add FLWS to Watchlist: View: Get Complete FLWS Trend Analysis ➞ | |
 | ROG Rogers Corporation |
| Sector: Technology | |
| SubSector: Diversified Electronics | |
| MarketCap: 1756.36 Millions | |
| Recent Price: 105.82 Smart Investing & Trading Score: 10 | |
| Day Percent Change: -3.57% Day Change: -3.92 | |
| Week Change: -4.55% Year-to-date Change: -19.9% | |
| ROG Links: Profile News Message Board | |
| Charts:- Daily , Weekly | |
| Add ROG to Watchlist: View: Get Complete ROG Trend Analysis ➞ | |
 | ABR Arbor Realty Trust, Inc. |
| Sector: Financials | |
| SubSector: Mortgage Investment | |
| MarketCap: 648.939 Millions | |
| Recent Price: 12.15 Smart Investing & Trading Score: 25 | |
| Day Percent Change: 0.66% Day Change: 0.08 | |
| Week Change: -0.41% Year-to-date Change: -20.0% | |
| ABR Links: Profile News Message Board | |
| Charts:- Daily , Weekly | |
| Add ABR to Watchlist: View: Get Complete ABR Trend Analysis ➞ | |
 | FMAO Farmers & Merchants Bancorp, Inc. |
| Sector: Financials | |
| SubSector: Regional - Midwest Banks | |
| MarketCap: 280.27 Millions | |
| Recent Price: 19.85 Smart Investing & Trading Score: 0 | |
| Day Percent Change: -1.88% Day Change: -0.38 | |
| Week Change: -1.98% Year-to-date Change: -20.0% | |
| FMAO Links: Profile News Message Board | |
| Charts:- Daily , Weekly | |
| Add FMAO to Watchlist: View: Get Complete FMAO Trend Analysis ➞ | |
 | PRLB Proto Labs, Inc. |
| Sector: Industrials | |
| SubSector: Machine Tools & Accessories | |
| MarketCap: 1944.78 Millions | |
| Recent Price: 31.17 Smart Investing & Trading Score: 0 | |
| Day Percent Change: -0.76% Day Change: -0.24 | |
| Week Change: -3.35% Year-to-date Change: -20.0% | |
| PRLB Links: Profile News Message Board | |
| Charts:- Daily , Weekly | |
| Add PRLB to Watchlist: View: Get Complete PRLB Trend Analysis ➞ | |
 | PKBK Parke Bancorp, Inc. |
| Sector: Financials | |
| SubSector: Regional - Northeast Banks | |
| MarketCap: 165.799 Millions | |
| Recent Price: 16.20 Smart Investing & Trading Score: 27 | |
| Day Percent Change: 0.43% Day Change: 0.07 | |
| Week Change: -0.06% Year-to-date Change: -20.0% | |
| PKBK Links: Profile News Message Board | |
| Charts:- Daily , Weekly | |
| Add PKBK to Watchlist: View: Get Complete PKBK Trend Analysis ➞ | |
 | PZZA Papa John s International, Inc. |
| Sector: Services & Goods | |
| SubSector: Specialty Eateries | |
| MarketCap: 1925.27 Millions | |
| Recent Price: 60.95 Smart Investing & Trading Score: 10 | |
| Day Percent Change: -1.28% Day Change: -0.79 | |
| Week Change: -1.34% Year-to-date Change: -20.0% | |
| PZZA Links: Profile News Message Board | |
| Charts:- Daily , Weekly | |
| Add PZZA to Watchlist: View: Get Complete PZZA Trend Analysis ➞ | |
 | FBMS The First Bancshares, Inc. |
| Sector: Financials | |
| SubSector: Regional - Southeast Banks | |
| MarketCap: 359.535 Millions | |
| Recent Price: 23.45 Smart Investing & Trading Score: 27 | |
| Day Percent Change: 1.30% Day Change: 0.30 | |
| Week Change: -1.26% Year-to-date Change: -20.1% | |
| FBMS Links: Profile News Message Board | |
| Charts:- Daily , Weekly | |
| Add FBMS to Watchlist: View: Get Complete FBMS Trend Analysis ➞ | |
 | NYMT New York Mortgage Trust, Inc. |
| Sector: Financials | |
| SubSector: Mortgage Investment | |
| MarketCap: 1038.39 Millions | |
| Recent Price: 6.82 Smart Investing & Trading Score: 27 | |
| Day Percent Change: 1.34% Day Change: 0.09 | |
| Week Change: -2.29% Year-to-date Change: -20.1% | |
| NYMT Links: Profile News Message Board | |
| Charts:- Daily , Weekly | |
| Add NYMT to Watchlist: View: Get Complete NYMT Trend Analysis ➞ | |
 | CHMG Chemung Financial Corporation |
| Sector: Financials | |
| SubSector: Regional - Pacific Banks | |
| MarketCap: 142.229 Millions | |
| Recent Price: 39.80 Smart Investing & Trading Score: 27 | |
| Day Percent Change: 0.66% Day Change: 0.26 | |
| Week Change: 0.73% Year-to-date Change: -20.1% | |
| CHMG Links: Profile News Message Board | |
| Charts:- Daily , Weekly | |
| Add CHMG to Watchlist: View: Get Complete CHMG Trend Analysis ➞ | |
 | CCNE CNB Financial Corporation |
| Sector: Financials | |
| SubSector: Regional - Northeast Banks | |
| MarketCap: 286.599 Millions | |
| Recent Price: 18.05 Smart Investing & Trading Score: 0 | |
| Day Percent Change: -2.22% Day Change: -0.41 | |
| Week Change: -6.67% Year-to-date Change: -20.1% | |
| CCNE Links: Profile News Message Board | |
| Charts:- Daily , Weekly | |
| Add CCNE to Watchlist: View: Get Complete CCNE Trend Analysis ➞ | |
 | POWI Power Integrations, Inc. |
| Sector: Technology | |
| SubSector: Semiconductor - Integrated Circuits | |
| MarketCap: 2612.1 Millions | |
| Recent Price: 65.59 Smart Investing & Trading Score: 0 | |
| Day Percent Change: -1.87% Day Change: -1.25 | |
| Week Change: -3.6% Year-to-date Change: -20.1% | |
| POWI Links: Profile News Message Board | |
| Charts:- Daily , Weekly | |
| Add POWI to Watchlist: View: Get Complete POWI Trend Analysis ➞ | |
 | OIS Oil States International, Inc. |
| Sector: Energy | |
| SubSector: Oil & Gas Equipment & Services | |
| MarketCap: 131.061 Millions | |
| Recent Price: 5.42 Smart Investing & Trading Score: 0 | |
| Day Percent Change: -2.69% Day Change: -0.15 | |
| Week Change: -7.67% Year-to-date Change: -20.2% | |
| OIS Links: Profile News Message Board | |
| Charts:- Daily , Weekly | |
| Add OIS to Watchlist: View: Get Complete OIS Trend Analysis ➞ | |
 | AMAL Amalgamated Bank |
| Sector: Financials | |
| SubSector: Regional - Northeast Banks | |
| MarketCap: 321.899 Millions | |
| Recent Price: 21.49 Smart Investing & Trading Score: 17 | |
| Day Percent Change: -0.28% Day Change: -0.06 | |
| Week Change: -2.23% Year-to-date Change: -20.2% | |
| AMAL Links: Profile News Message Board | |
| Charts:- Daily , Weekly | |
| Add AMAL to Watchlist: View: Get Complete AMAL Trend Analysis ➞ | |
| Too many stocks? View smallcap stocks filtered by marketcap & sector |
| Marketcap: All SmallCap Stocks (default-no microcap), Large, Mid-Range, Small & MicroCap |
| Sector: Tech, Finance, Energy, Staples, Retail, Industrial, Materials, Utilities & Medical |
|
Best Stocks Today 12Stocks.com |
© 2024 12Stocks.com Terms & Conditions Privacy Contact Us
All Information Provided Only For Education And Not To Be Used For Investing or Trading. See Terms & Conditions


One More Thing ... Get Best Stocks Delivered Daily!
Never Ever Miss A Move With Our Top Ten Stocks Lists
Find Best Stocks In Any Market - Bull or Bear Market
Take A Peek At Our Top Ten Stocks Lists: Daily, Weekly, Year-to-Date & Top Trends
Find Best Stocks In Any Market - Bull or Bear Market
Take A Peek At Our Top Ten Stocks Lists: Daily, Weekly, Year-to-Date & Top Trends
Smallcap Stocks With Best Up Trends [0-bearish to 100-bullish]: Vanda [100], Zuora [100], ALX Oncology[100], ProKidney [100], IMAX [100], Envestnet [100], Intra-Cellular Therapies[100], Dorian LPG[95], Victory Capital[95], Oscar Health[95], Reneo [93]
Best Smallcap Stocks Year-to-Date:
Agenus [552.25%], CareMax [416.49%], Janux [346.07%], Viking [257.17%], Alpine Immune[238.55%], Super Micro[237.75%], Arcutis Bio[217.34%], Longboard [177.91%], Avidity Biosciences[160.56%], Vera [158.46%], Stoke [122.81%] Best Smallcap Stocks This Week:
ProKidney [61.71%], Macatawa Bank[42.75%], Snap One[29.85%], Vanda [27.18%], ALX Oncology[23.41%], Intra-Cellular Therapies[16.41%], Escalade [13.71%], Karyopharm [13.11%], Encore Wire[10.06%], Zuora [10%], Direxion Daily[8.81%] Best Smallcap Stocks Daily:
Vanda [29.38%], Karyopharm [25.45%], Cutera [18.41%], Children s[16.46%], WW [14.10%], Lineage Cell[12.17%], Zuora [11.69%], ALX Oncology[10.97%], Marinus [10.77%], Acrivon [9.19%], Cue Biopharma[9.03%]