
 Login Sign Up


| |||||
 |  | ||||

| 12Stocks.com Market Intelligence |
Best SmallCap Stocks
|
| In a hurry? Small Cap Stock Lists: Performance Trends Table, Stock Charts
Sort Small Cap stocks: Daily, Weekly, Year-to-Date, Market Cap & Trends. Filter Small Cap stocks list by sector: Show all, Tech, Finance, Energy, Staples, Retail, Industrial, Materials, Utilities and HealthCare Filter Small Cap stocks list by size: All Large Medium Small and MicroCap |
| 12Stocks.com Small Cap Stocks Performances & Trends Daily | |||||||||
|
|  The overall Smart Investing & Trading Score is 56 (0-bearish to 100-bullish) which puts Small Cap index in short term neutral trend. The Smart Investing & Trading Score from previous trading session is 44 and hence an improvement of trend.
| ||||||||
Here are the Smart Investing & Trading Scores of the most requested small cap stocks at 12Stocks.com (click stock name for detailed review):
|


| 12Stocks.com: Investing in Smallcap Index with Stocks | |
|
The following table helps investors and traders sort through current performance and trends (as measured by Smart Investing & Trading Score) of various
stocks in the Smallcap Index. Quick View: Move mouse or cursor over stock symbol (ticker) to view short-term technical chart and over stock name to view long term chart. Click on  to add stock symbol to your watchlist and to add stock symbol to your watchlist and  to view watchlist. Click on any ticker or stock name for detailed market intelligence report for that stock. to view watchlist. Click on any ticker or stock name for detailed market intelligence report for that stock. |
12Stocks.com Performance of Stocks in Smallcap Index
| Ticker | Stock Name | Watchlist | Category | Recent Price | Smart Investing & Trading Score | Change % | YTD Change% |
| ACLS | Axcelis |   | Technology | 103.06 | 42 | 3.06 | -20.53% |
| UNFI | United Natural | | Consumer Staples | 9.13 | 27 | 3.05 | -43.75% |
| RBOT | Vicarious Surgical | | Health Care | 0.27 | 25 | 3.05 | -26.39% |
| MPLN | MultiPlan | | Health Care | 0.58 | 25 | 3.04 | -59.74% |
| AI | C3.ai | | Financials | 22.83 | 49 | 3.02 | -20.48% |
| PRME | Prime Medicine | | Health Care | 4.43 | 55 | 3.02 | -51.43% |
| STEP | StepStone Group | | Financials | 36.45 | 93 | 3.02 | 14.46% |
| GNLX | Genelux | | Health Care | 3.42 | 27 | 3.01 | -77.53% |
| VLD | Velo3D | | Technology | 0.24 | 27 | 3.00 | -38.87% |
| ITI | Iteris | | Technology | 4.48 | 15 | 2.99 | -13.85% |
| PKOH | Park-Ohio | | Services & Goods | 24.09 | 17 | 2.99 | -10.65% |
| NGVC | Natural Grocers | | Services & Goods | 16.88 | 50 | 2.99 | 5.50% |
| RUSHA | Rush Enterprises | | Services & Goods | 46.76 | 43 | 2.97 | -7.04% |
| ASUR | Asure | | Technology | 7.27 | 49 | 2.97 | -23.63% |
| SGMO | Sangamo | | Health Care | 0.52 | 51 | 2.94 | -4.69% |
| OMER | Omeros | | Health Care | 3.15 | 15 | 2.94 | -3.67% |
| PMVP | PMV | | Health Care | 1.75 | 59 | 2.94 | -43.55% |
| TSE | Trinseo S.A | | Materials | 2.81 | 32 | 2.93 | -66.43% |
| KLTR | Kaltura | | Technology | 1.24 | 35 | 2.92 | -36.99% |
| DCOM | Dime Community | | Financials | 19.08 | 67 | 2.91 | -29.15% |
| INZY | Inozyme Pharma | | Health Care | 4.42 | 17 | 2.91 | 3.88% |
| ACNB | ACNB | | Financials | 34.16 | 42 | 2.89 | -23.68% |
| SMR | NuScale Power | | Industrials | 6.06 | 75 | 2.89 | 87.91% |
| TPH | TRI Pointe | | Industrials | 37.88 | 70 | 2.88 | 7.01% |
| PUBM | PubMatic | | Technology | 23.22 | 75 | 2.88 | 42.45% |


| Too many stocks? View smallcap stocks filtered by marketcap & sector |
| Marketcap: All SmallCap Stocks (default-no microcap), Large, Mid-Range, Small |
| Smallcap Sector: Tech, Finance, Energy, Staples, Retail, Industrial, Materials, & Medical |
|
Get the most comprehensive stock market coverage daily at 12Stocks.com ➞ Best Stocks Today ➞ Best Stocks Weekly ➞ Best Stocks Year-to-Date ➞ Best Stocks Trends ➞  Best Stocks Today 12Stocks.com Best Nasdaq Stocks ➞ Best S&P 500 Stocks ➞ Best Tech Stocks ➞ Best Biotech Stocks ➞ |
| Detailed Overview of SmallCap Stocks |
| SmallCap Technical Overview, Leaders & Laggards, Top SmallCap ETF Funds & Detailed SmallCap Stocks List, Charts, Trends & More |
| Smallcap: Technical Analysis, Trends & YTD Performance | |
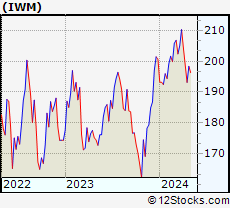
| SmallCap segment as represented by
IWM, an exchange-traded fund [ETF], holds basket of thousands of smallcap stocks from across all major sectors of the US stock market. The smallcap index (contains stocks like Riverbed & Sotheby's) is down by -1.16% and is currently underperforming the overall market by -7.3% year-to-date. Below is a quick view of technical charts and trends: | |
 IWM Weekly Chart |
|
| Long Term Trend: Good | |
| Medium Term Trend: Not Good | |
 IWM Daily Chart |
|
| Short Term Trend: Very Good | |
| Overall Trend Score: 56 | |
| YTD Performance: -1.16% | |
| **Trend Scores & Views Are Only For Educational Purposes And Not For Investing | |
| 12Stocks.com: Top Performing Small Cap Index Stocks | ||||||||||||||||||||||||||||||||||||||||||||||||
 The top performing Small Cap Index stocks year to date are
Now, more recently, over last week, the top performing Small Cap Index stocks on the move are


|
||||||||||||||||||||||||||||||||||||||||||||||||
| 12Stocks.com: Investing in Smallcap Index using Exchange Traded Funds | |
|
The following table shows list of key exchange traded funds (ETF) that
help investors track Smallcap index. The following list also includes leveraged ETF funds that track twice or thrice the daily returns of Smallcap indices. Short or inverse ETF funds move in the opposite direction to the index they track and are useful during market pullbacks or during bear markets. Quick View: Move mouse or cursor over ETF symbol (ticker) to view short-term technical chart and over ETF name to view long term chart. Click on ticker or stock name for detailed view. Click on to add stock symbol to your watchlist and to view watchlist. |
12Stocks.com List of ETFs that track Smallcap Index
| Ticker | ETF Name | Watchlist | Recent Price | Smart Investing & Trading Score | Change % | Week % | Year-to-date % |
| IWM | iShares Russell 2000 | | 198.39 | 56 | 0.97 | 2.72 | -1.16% |
| IJR | iShares Core S&P Small-Cap | | 105.65 | 85 | 0.75 | 2.35 | -2.4% |
| VTWO | Vanguard Russell 2000 ETF | | 80.22 | 70 | 0.97 | 2.74 | -1.09% |
| IWN | iShares Russell 2000 Value | | 151.14 | 75 | 0.64 | 2.27 | -2.7% |
| IWO | iShares Russell 2000 Growth | | 253.09 | 58 | 1.29 | 3.18 | 0.34% |
| IJS | iShares S&P Small-Cap 600 Value | | 97.19 | 67 | 0.52 | 1.65 | -5.7% |
| IJT | iShares S&P Small-Cap 600 Growth | | 126.09 | 70 | 0.82 | 3.17 | 0.76% |
| XSLV | PowerShares S&P SmallCap Low Volatil ETF | | 42.72 | 80 | 0.42 | 1.28 | -3.24% |
| SAA | ProShares Ultra SmallCap600 | | 23.04 | 65 | 1.68 | 5.69 | -7.66% |
| SBB | ProShares Short SmallCap600 | | 16.39 | 33 | -0.70 | -2.7 | 2.86% |
| SDD | ProShares UltraShort SmallCap600 | | 19.35 | 35 | -1.17 | -4.87 | 5.01% |
| SMLV | SPDR SSGA US Small Cap Low Volatil ETF | | 107.52 | 80 | 0.18 | 1.35 | -4.44% |
| 12Stocks.com: Charts, Trends, Fundamental Data and Performances of SmallCap Stocks | |
|
We now take in-depth look at all SmallCap stocks including charts, multi-period performances and overall trends (as measured by Smart Investing & Trading Score). One can sort SmallCap stocks (click link to choose) by Daily, Weekly and by Year-to-Date performances. Also, one can sort by size of the company or by market capitalization. |
| Select Your Default Chart Type: | |||||
| |||||
| Click on stock symbol or name for detailed view. Click on to add stock symbol to your watchlist and to view watchlist. Quick View: Move mouse or cursor over "Daily" to quickly view daily technical stock chart and over "Weekly" to view weekly technical stock chart. | |||||

 | ACLS Axcelis Technologies, Inc. |
| Sector: Technology | |
| SubSector: Semiconductor Equipment & Materials | |
| MarketCap: 498.518 Millions | |
| Recent Price: 103.06 Smart Investing & Trading Score: 42 | |
| Day Percent Change: 3.06% Day Change: 3.06 | |
| Week Change: 8.72% Year-to-date Change: -20.5% | |
| ACLS Links: Profile News Message Board | |
| Charts:- Daily , Weekly | |
| Add ACLS to Watchlist: View: Get Complete ACLS Trend Analysis ➞ | |
 | UNFI United Natural Foods, Inc. |
| Sector: Consumer Staples | |
| SubSector: Food Wholesale | |
| MarketCap: 746.329 Millions | |
| Recent Price: 9.13 Smart Investing & Trading Score: 27 | |
| Day Percent Change: 3.05% Day Change: 0.27 | |
| Week Change: -1.51% Year-to-date Change: -43.8% | |
| UNFI Links: Profile News Message Board | |
| Charts:- Daily , Weekly | |
| Add UNFI to Watchlist: View: Get Complete UNFI Trend Analysis ➞ | |
 | RBOT Vicarious Surgical Inc. |
| Sector: Health Care | |
| SubSector: Medical Devices | |
| MarketCap: 241 Millions | |
| Recent Price: 0.27 Smart Investing & Trading Score: 25 | |
| Day Percent Change: 3.05% Day Change: 0.01 | |
| Week Change: -6.25% Year-to-date Change: -26.4% | |
| RBOT Links: Profile News Message Board | |
| Charts:- Daily , Weekly | |
| Add RBOT to Watchlist: View: Get Complete RBOT Trend Analysis ➞ | |
 | MPLN MultiPlan Corporation |
| Sector: Health Care | |
| SubSector: Healthcare Plans | |
| MarketCap: 56087 Millions | |
| Recent Price: 0.58 Smart Investing & Trading Score: 25 | |
| Day Percent Change: 3.04% Day Change: 0.02 | |
| Week Change: -24.87% Year-to-date Change: -59.7% | |
| MPLN Links: Profile News Message Board | |
| Charts:- Daily , Weekly | |
| Add MPLN to Watchlist: View: Get Complete MPLN Trend Analysis ➞ | |
 | AI C3.ai, Inc. |
| Sector: Financials | |
| SubSector: REIT Mortgage | |
| MarketCap: 12467 Millions | |
| Recent Price: 22.83 Smart Investing & Trading Score: 49 | |
| Day Percent Change: 3.02% Day Change: 0.67 | |
| Week Change: 10.18% Year-to-date Change: -20.5% | |
| AI Links: Profile News Message Board | |
| Charts:- Daily , Weekly | |
| Add AI to Watchlist: View: Get Complete AI Trend Analysis ➞ | |
 | PRME Prime Medicine, Inc. |
| Sector: Health Care | |
| SubSector: Biotechnology | |
| MarketCap: 1440 Millions | |
| Recent Price: 4.43 Smart Investing & Trading Score: 55 | |
| Day Percent Change: 3.02% Day Change: 0.13 | |
| Week Change: -1.77% Year-to-date Change: -51.4% | |
| PRME Links: Profile News Message Board | |
| Charts:- Daily , Weekly | |
| Add PRME to Watchlist: View: Get Complete PRME Trend Analysis ➞ | |
 | STEP StepStone Group Inc. |
| Sector: Financials | |
| SubSector: Asset Management | |
| MarketCap: 30757 Millions | |
| Recent Price: 36.45 Smart Investing & Trading Score: 93 | |
| Day Percent Change: 3.02% Day Change: 1.07 | |
| Week Change: 2.92% Year-to-date Change: 14.5% | |
| STEP Links: Profile News Message Board | |
| Charts:- Daily , Weekly | |
| Add STEP to Watchlist: View: Get Complete STEP Trend Analysis ➞ | |
 | GNLX Genelux Corporation |
| Sector: Health Care | |
| SubSector: Biotechnology | |
| MarketCap: 820 Millions | |
| Recent Price: 3.42 Smart Investing & Trading Score: 27 | |
| Day Percent Change: 3.01% Day Change: 0.10 | |
| Week Change: -17.19% Year-to-date Change: -77.5% | |
| GNLX Links: Profile News Message Board | |
| Charts:- Daily , Weekly | |
| Add GNLX to Watchlist: View: Get Complete GNLX Trend Analysis ➞ | |
 | VLD Velo3D, Inc. |
| Sector: Technology | |
| SubSector: Computer Hardware | |
| MarketCap: 404 Millions | |
| Recent Price: 0.24 Smart Investing & Trading Score: 27 | |
| Day Percent Change: 3.00% Day Change: 0.01 | |
| Week Change: -4% Year-to-date Change: -38.9% | |
| VLD Links: Profile News Message Board | |
| Charts:- Daily , Weekly | |
| Add VLD to Watchlist: View: Get Complete VLD Trend Analysis ➞ | |
 | ITI Iteris, Inc. |
| Sector: Technology | |
| SubSector: Communication Equipment | |
| MarketCap: 129.939 Millions | |
| Recent Price: 4.48 Smart Investing & Trading Score: 15 | |
| Day Percent Change: 2.99% Day Change: 0.13 | |
| Week Change: -0.44% Year-to-date Change: -13.9% | |
| ITI Links: Profile News Message Board | |
| Charts:- Daily , Weekly | |
| Add ITI to Watchlist: View: Get Complete ITI Trend Analysis ➞ | |
 | PKOH Park-Ohio Holdings Corp. |
| Sector: Services & Goods | |
| SubSector: Industrial Equipment Wholesale | |
| MarketCap: 214.358 Millions | |
| Recent Price: 24.09 Smart Investing & Trading Score: 17 | |
| Day Percent Change: 2.99% Day Change: 0.70 | |
| Week Change: 0.79% Year-to-date Change: -10.7% | |
| PKOH Links: Profile News Message Board | |
| Charts:- Daily , Weekly | |
| Add PKOH to Watchlist: View: Get Complete PKOH Trend Analysis ➞ | |
 | NGVC Natural Grocers by Vitamin Cottage, Inc. |
| Sector: Services & Goods | |
| SubSector: Grocery Stores | |
| MarketCap: 185.475 Millions | |
| Recent Price: 16.88 Smart Investing & Trading Score: 50 | |
| Day Percent Change: 2.99% Day Change: 0.49 | |
| Week Change: 2.43% Year-to-date Change: 5.5% | |
| NGVC Links: Profile News Message Board | |
| Charts:- Daily , Weekly | |
| Add NGVC to Watchlist: View: Get Complete NGVC Trend Analysis ➞ | |
 | RUSHA Rush Enterprises, Inc. |
| Sector: Services & Goods | |
| SubSector: Auto Dealerships | |
| MarketCap: 1183.21 Millions | |
| Recent Price: 46.76 Smart Investing & Trading Score: 43 | |
| Day Percent Change: 2.97% Day Change: 1.35 | |
| Week Change: -4% Year-to-date Change: -7.0% | |
| RUSHA Links: Profile News Message Board | |
| Charts:- Daily , Weekly | |
| Add RUSHA to Watchlist: View: Get Complete RUSHA Trend Analysis ➞ | |
 | ASUR Asure Software, Inc. |
| Sector: Technology | |
| SubSector: Business Software & Services | |
| MarketCap: 103.758 Millions | |
| Recent Price: 7.27 Smart Investing & Trading Score: 49 | |
| Day Percent Change: 2.97% Day Change: 0.21 | |
| Week Change: 4.01% Year-to-date Change: -23.6% | |
| ASUR Links: Profile News Message Board | |
| Charts:- Daily , Weekly | |
| Add ASUR to Watchlist: View: Get Complete ASUR Trend Analysis ➞ | |
 | SGMO Sangamo Therapeutics, Inc. |
| Sector: Health Care | |
| SubSector: Biotechnology | |
| MarketCap: 779.285 Millions | |
| Recent Price: 0.52 Smart Investing & Trading Score: 51 | |
| Day Percent Change: 2.94% Day Change: 0.01 | |
| Week Change: 1.23% Year-to-date Change: -4.7% | |
| SGMO Links: Profile News Message Board | |
| Charts:- Daily , Weekly | |
| Add SGMO to Watchlist: View: Get Complete SGMO Trend Analysis ➞ | |
 | OMER Omeros Corporation |
| Sector: Health Care | |
| SubSector: Biotechnology | |
| MarketCap: 759.585 Millions | |
| Recent Price: 3.15 Smart Investing & Trading Score: 15 | |
| Day Percent Change: 2.94% Day Change: 0.09 | |
| Week Change: 3.28% Year-to-date Change: -3.7% | |
| OMER Links: Profile News Message Board | |
| Charts:- Daily , Weekly | |
| Add OMER to Watchlist: View: Get Complete OMER Trend Analysis ➞ | |
 | PMVP PMV Pharmaceuticals, Inc. |
| Sector: Health Care | |
| SubSector: Biotechnology | |
| MarketCap: 20187 Millions | |
| Recent Price: 1.75 Smart Investing & Trading Score: 59 | |
| Day Percent Change: 2.94% Day Change: 0.05 | |
| Week Change: 8.02% Year-to-date Change: -43.6% | |
| PMVP Links: Profile News Message Board | |
| Charts:- Daily , Weekly | |
| Add PMVP to Watchlist: View: Get Complete PMVP Trend Analysis ➞ | |
 | TSE Trinseo S.A. |
| Sector: Materials | |
| SubSector: Specialty Chemicals | |
| MarketCap: 790.057 Millions | |
| Recent Price: 2.81 Smart Investing & Trading Score: 32 | |
| Day Percent Change: 2.93% Day Change: 0.08 | |
| Week Change: 1.81% Year-to-date Change: -66.4% | |
| TSE Links: Profile News Message Board | |
| Charts:- Daily , Weekly | |
| Add TSE to Watchlist: View: Get Complete TSE Trend Analysis ➞ | |
 | KLTR Kaltura, Inc. |
| Sector: Technology | |
| SubSector: Software - Application | |
| MarketCap: 293 Millions | |
| Recent Price: 1.24 Smart Investing & Trading Score: 35 | |
| Day Percent Change: 2.92% Day Change: 0.04 | |
| Week Change: 2.92% Year-to-date Change: -37.0% | |
| KLTR Links: Profile News Message Board | |
| Charts:- Daily , Weekly | |
| Add KLTR to Watchlist: View: Get Complete KLTR Trend Analysis ➞ | |
 | DCOM Dime Community Bancshares, Inc. |
| Sector: Financials | |
| SubSector: Savings & Loans | |
| MarketCap: 477.83 Millions | |
| Recent Price: 19.08 Smart Investing & Trading Score: 67 | |
| Day Percent Change: 2.91% Day Change: 0.54 | |
| Week Change: 2.14% Year-to-date Change: -29.2% | |
| DCOM Links: Profile News Message Board | |
| Charts:- Daily , Weekly | |
| Add DCOM to Watchlist: View: Get Complete DCOM Trend Analysis ➞ | |
 | INZY Inozyme Pharma, Inc. |
| Sector: Health Care | |
| SubSector: Biotechnology | |
| MarketCap: 53487 Millions | |
| Recent Price: 4.42 Smart Investing & Trading Score: 17 | |
| Day Percent Change: 2.91% Day Change: 0.13 | |
| Week Change: -1.45% Year-to-date Change: 3.9% | |
| INZY Links: Profile News Message Board | |
| Charts:- Daily , Weekly | |
| Add INZY to Watchlist: View: Get Complete INZY Trend Analysis ➞ | |
 | ACNB ACNB Corporation |
| Sector: Financials | |
| SubSector: Regional - Southwest Banks | |
| MarketCap: 231.065 Millions | |
| Recent Price: 34.16 Smart Investing & Trading Score: 42 | |
| Day Percent Change: 2.89% Day Change: 0.96 | |
| Week Change: 5.14% Year-to-date Change: -23.7% | |
| ACNB Links: Profile News Message Board | |
| Charts:- Daily , Weekly | |
| Add ACNB to Watchlist: View: Get Complete ACNB Trend Analysis ➞ | |
 | SMR NuScale Power Corporation |
| Sector: Industrials | |
| SubSector: Specialty Industrial Machinery | |
| MarketCap: 1510 Millions | |
| Recent Price: 6.06 Smart Investing & Trading Score: 75 | |
| Day Percent Change: 2.89% Day Change: 0.17 | |
| Week Change: 24.95% Year-to-date Change: 87.9% | |
| SMR Links: Profile News Message Board | |
| Charts:- Daily , Weekly | |
| Add SMR to Watchlist: View: Get Complete SMR Trend Analysis ➞ | |
 | TPH TRI Pointe Group, Inc. |
| Sector: Industrials | |
| SubSector: Residential Construction | |
| MarketCap: 1140.06 Millions | |
| Recent Price: 37.88 Smart Investing & Trading Score: 70 | |
| Day Percent Change: 2.88% Day Change: 1.06 | |
| Week Change: 8.45% Year-to-date Change: 7.0% | |
| TPH Links: Profile News Message Board | |
| Charts:- Daily , Weekly | |
| Add TPH to Watchlist: View: Get Complete TPH Trend Analysis ➞ | |
 | PUBM PubMatic, Inc. |
| Sector: Technology | |
| SubSector: Software Application | |
| MarketCap: 56787 Millions | |
| Recent Price: 23.22 Smart Investing & Trading Score: 75 | |
| Day Percent Change: 2.88% Day Change: 0.65 | |
| Week Change: 7.45% Year-to-date Change: 42.5% | |
| PUBM Links: Profile News Message Board | |
| Charts:- Daily , Weekly | |
| Add PUBM to Watchlist: View: Get Complete PUBM Trend Analysis ➞ | |
| Too many stocks? View smallcap stocks filtered by marketcap & sector |
| Marketcap: All SmallCap Stocks (default-no microcap), Large, Mid-Range, Small & MicroCap |
| Sector: Tech, Finance, Energy, Staples, Retail, Industrial, Materials, Utilities & Medical |
|
Best Stocks Today 12Stocks.com |
© 2024 12Stocks.com Terms & Conditions Privacy Contact Us
All Information Provided Only For Education And Not To Be Used For Investing or Trading. See Terms & Conditions


One More Thing ... Get Best Stocks Delivered Daily!
Never Ever Miss A Move With Our Top Ten Stocks Lists
Find Best Stocks In Any Market - Bull or Bear Market
Take A Peek At Our Top Ten Stocks Lists: Daily, Weekly, Year-to-Date & Top Trends
Find Best Stocks In Any Market - Bull or Bear Market
Take A Peek At Our Top Ten Stocks Lists: Daily, Weekly, Year-to-Date & Top Trends
Smallcap Stocks With Best Up Trends [0-bearish to 100-bullish]: Cullinan Oncology[100], NextNav [100], MBIA [100], Reservoir Media[100], B. Riley[100], Braemar Hotels[100], Pactiv Evergreen[100], Wolverine World[100], Haemonetics [100], Benchmark Electronics[100], Uniti Group[100]
Best Smallcap Stocks Year-to-Date:
CareMax [568.04%], Janux [341.65%], Viking [299.3%], Alpine Immune[239.21%], Longboard [222.09%], Super Micro[201.64%], Avidity Biosciences[166.81%], Arcutis Bio[162.23%], Vera [156.27%], Cullinan Oncology[147.08%], Hippo [141.6%] Best Smallcap Stocks This Week:
Matterport [170.98%], B. Riley[84.19%], Cullinan Oncology[60.86%], Seres [47.35%], Zura Bio[38.67%], Universal Logistics[36.84%], Tutor Perini[33.89%], Riot Blockchain[30.67%], IGM Biosciences[30.56%], Impinj [29.74%], Sonic Automotive[28.14%] Best Smallcap Stocks Daily:
Universal Logistics[39.37%], Zura Bio[31.90%], Cullinan Oncology[30.86%], Tutor Perini[28.01%], IGM Biosciences[23.36%], U.S. Silica[21.67%], Maxeon Solar[20.17%], Exponent [19.49%], TPI Composites[16.32%], OptimizeRx [14.84%], Solaris Oilfield[13.95%]