
 Login Sign Up


| |||||
 |  | ||||

| 12Stocks.com Market Intelligence |
Best SmallCap Stocks
|
| In a hurry? Small Cap Stock Lists: Performance Trends Table, Stock Charts
Sort Small Cap stocks: Daily, Weekly, Year-to-Date, Market Cap & Trends. Filter Small Cap stocks list by sector: Show all, Tech, Finance, Energy, Staples, Retail, Industrial, Materials, Utilities and HealthCare Filter Small Cap stocks list by size: All Large Medium Small and MicroCap |
| 12Stocks.com Small Cap Stocks Performances & Trends Daily | |||||||||
|
|  The overall Smart Investing & Trading Score is 31 (0-bearish to 100-bullish) which puts Small Cap index in short term bearish to neutral trend. The Smart Investing & Trading Score from previous trading session is 58 and hence a deterioration of trend.
| ||||||||
Here are the Smart Investing & Trading Scores of the most requested small cap stocks at 12Stocks.com (click stock name for detailed review):
|


| 12Stocks.com: Investing in Smallcap Index with Stocks | |
|
The following table helps investors and traders sort through current performance and trends (as measured by Smart Investing & Trading Score) of various
stocks in the Smallcap Index. Quick View: Move mouse or cursor over stock symbol (ticker) to view short-term technical chart and over stock name to view long term chart. Click on  to add stock symbol to your watchlist and to add stock symbol to your watchlist and  to view watchlist. Click on any ticker or stock name for detailed market intelligence report for that stock. to view watchlist. Click on any ticker or stock name for detailed market intelligence report for that stock. |
12Stocks.com Performance of Stocks in Smallcap Index
| Ticker | Stock Name | Watchlist | Category | Recent Price | Smart Investing & Trading Score | Change % | YTD Change% |
| PPBI | Pacific Premier |   | Financials | 22.25 | 44 | -2.15 | -23.57% |
| WSBF | Waterstone Financial | | Financials | 12.03 | 74 | -2.16 | -15.32% |
| MEG | Montrose Environmental | | Industrials | 40.49 | 61 | -2.17 | 25.90% |
| TMP | Tompkins Financial | | Financials | 45.54 | 60 | -2.17 | -24.39% |
| UONEK | Urban One | | Services & Goods | 1.58 | 10 | -2.17 | -54.22% |
| GTLS | Chart Industries | | Industrials | 149.62 | 61 | -2.18 | 9.75% |
| CLPR | Clipper Realty | | Financials | 4.04 | 52 | -2.18 | -25.19% |
| AGS | PlayAGS | | Services & Goods | 8.53 | 18 | -2.18 | 1.19% |
| KRYS | Krystal Biotech | | Health Care | 155.58 | 41 | -2.18 | 25.41% |
| STNE | StoneCo | | Technology | 15.48 | 20 | -2.18 | -14.12% |
| ZUO | Zuora | | Technology | 9.81 | 73 | -2.19 | 4.36% |
| DORM | Dorman Products | | Consumer Staples | 87.83 | 61 | -2.20 | 5.30% |
| TENB | Tenable | | Technology | 45.40 | 10 | -2.20 | -1.43% |
| CURV | Torrid | | Services & Goods | 4.89 | 69 | -2.20 | -16.41% |
| MAC | Macerich | | Financials | 15.30 | 7 | -2.21 | -0.87% |
| SAFE | Safehold | | Financials | 18.60 | 27 | -2.21 | -20.51% |
| AVTE | Aerovate | | Health Care | 20.80 | 46 | -2.21 | -7.84% |
| GT | Goodyear Tire | | Consumer Staples | 11.66 | 10 | -2.22 | -18.54% |
| YELP | Yelp | | Technology | 39.49 | 50 | -2.22 | -16.57% |
| INSM | Insmed | | Health Care | 25.23 | 35 | -2.23 | -18.57% |
| DXPE | DXP Enterprises | | Services & Goods | 50.75 | 61 | -2.23 | 50.59% |
| GRBK | Green Brick | | Financials | 53.10 | 51 | -2.23 | 2.23% |
| UPWK | Upwork | | Technology | 11.11 | 20 | -2.24 | -25.32% |
| PTEN | Patterson-UTI Energy | | Energy | 11.27 | 61 | -2.25 | 4.35% |
| NL | NL Industries | | Services & Goods | 7.81 | 53 | -2.25 | 39.22% |
| For chart view version of above stock list: Chart View ➞ 0 - 25 , 25 - 50 , 50 - 75 , 75 - 100 , 100 - 125 , 125 - 150 , 150 - 175 , 175 - 200 , 200 - 225 , 225 - 250 , 250 - 275 , 275 - 300 , 300 - 325 , 325 - 350 , 350 - 375 , 375 - 400 , 400 - 425 , 425 - 450 , 450 - 475 , 475 - 500 , 500 - 525 , 525 - 550 , 550 - 575 , 575 - 600 , 600 - 625 , 625 - 650 , 650 - 675 , 675 - 700 , 700 - 725 , 725 - 750 , 750 - 775 , 775 - 800 , 800 - 825 , 825 - 850 , 850 - 875 , 875 - 900 , 900 - 925 , 925 - 950 , 950 - 975 , 975 - 1000 , 1000 - 1025 , 1025 - 1050 , 1050 - 1075 , 1075 - 1100 , 1100 - 1125 , 1125 - 1150 , 1150 - 1175 , 1175 - 1200 , 1200 - 1225 , 1225 - 1250 , 1250 - 1275 , 1275 - 1300 , 1300 - 1325 , 1325 - 1350 , 1350 - 1375 , 1375 - 1400 , 1400 - 1425 , 1425 - 1450 , 1450 - 1475 , 1475 - 1500 , 1500 - 1525 , 1525 - 1550 , 1550 - 1575 , 1575 - 1600 | ||
 | Click To Change The Sort Order: By Market Cap or Company Size Performance: Year-to-date, Week and Day |  |
| Too many stocks? View smallcap stocks filtered by marketcap & sector |
| Marketcap: All SmallCap Stocks (default-no microcap), Large, Mid-Range, Small |
| Smallcap Sector: Tech, Finance, Energy, Staples, Retail, Industrial, Materials, & Medical |
|
Get the most comprehensive stock market coverage daily at 12Stocks.com ➞ Best Stocks Today ➞ Best Stocks Weekly ➞ Best Stocks Year-to-Date ➞ Best Stocks Trends ➞  Best Stocks Today 12Stocks.com Best Nasdaq Stocks ➞ Best S&P 500 Stocks ➞ Best Tech Stocks ➞ Best Biotech Stocks ➞ |
| Detailed Overview of SmallCap Stocks |
| SmallCap Technical Overview, Leaders & Laggards, Top SmallCap ETF Funds & Detailed SmallCap Stocks List, Charts, Trends & More |
| Smallcap: Technical Analysis, Trends & YTD Performance | |
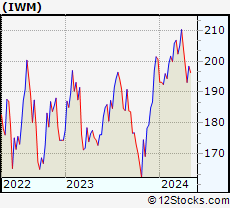
| SmallCap segment as represented by
IWM, an exchange-traded fund [ETF], holds basket of thousands of smallcap stocks from across all major sectors of the US stock market. The smallcap index (contains stocks like Riverbed & Sotheby's) is down by -2.82% and is currently underperforming the overall market by -7.07% year-to-date. Below is a quick view of technical charts and trends: | |
 IWM Weekly Chart |
|
| Long Term Trend: Good | |
| Medium Term Trend: Not Good | |
 IWM Daily Chart |
|
| Short Term Trend: Not Good | |
| Overall Trend Score: 31 | |
| YTD Performance: -2.82% | |
| **Trend Scores & Views Are Only For Educational Purposes And Not For Investing | |
| 12Stocks.com: Top Performing Small Cap Index Stocks | ||||||||||||||||||||||||||||||||||||||||||||||||
 The top performing Small Cap Index stocks year to date are
Now, more recently, over last week, the top performing Small Cap Index stocks on the move are


|
||||||||||||||||||||||||||||||||||||||||||||||||
| 12Stocks.com: Investing in Smallcap Index using Exchange Traded Funds | |
|
The following table shows list of key exchange traded funds (ETF) that
help investors track Smallcap index. The following list also includes leveraged ETF funds that track twice or thrice the daily returns of Smallcap indices. Short or inverse ETF funds move in the opposite direction to the index they track and are useful during market pullbacks or during bear markets. Quick View: Move mouse or cursor over ETF symbol (ticker) to view short-term technical chart and over ETF name to view long term chart. Click on ticker or stock name for detailed view. Click on to add stock symbol to your watchlist and to view watchlist. |
12Stocks.com List of ETFs that track Smallcap Index
| Ticker | ETF Name | Watchlist | Recent Price | Smart Investing & Trading Score | Change % | Week % | Year-to-date % |
| IWM | iShares Russell 2000 | | 195.06 | 31 | -1.33 | 0.99 | -2.82% |
| SBB | ProShares Short SmallCap600 | | 16.60 | 40 | 1.41 | -1.43 | 4.21% |
| SDD | ProShares UltraShort SmallCap600 | | 19.79 | 42 | 1.51 | -2.73 | 7.37% |
| SMLV | SPDR SSGA US Small Cap Low Volatil ETF | | 107.56 | 73 | -0.80 | 1.39 | -4.41% |
| SAA | ProShares Ultra SmallCap600 | | 23.01 | 58 | 0.00 | 5.55 | -7.78% |
| 12Stocks.com: Charts, Trends, Fundamental Data and Performances of SmallCap Stocks | |
|
We now take in-depth look at all SmallCap stocks including charts, multi-period performances and overall trends (as measured by Smart Investing & Trading Score). One can sort SmallCap stocks (click link to choose) by Daily, Weekly and by Year-to-Date performances. Also, one can sort by size of the company or by market capitalization. |
| Select Your Default Chart Type: | |||||
| |||||
| Click on stock symbol or name for detailed view. Click on to add stock symbol to your watchlist and to view watchlist. Quick View: Move mouse or cursor over "Daily" to quickly view daily technical stock chart and over "Weekly" to view weekly technical stock chart. | |||||

 | PPBI Pacific Premier Bancorp, Inc. |
| Sector: Financials | |
| SubSector: Regional - Pacific Banks | |
| MarketCap: 978.029 Millions | |
| Recent Price: 22.25 Smart Investing & Trading Score: 44 | |
| Day Percent Change: -2.15% Day Change: -0.49 | |
| Week Change: -0.09% Year-to-date Change: -23.6% | |
| PPBI Links: Profile News Message Board | |
| Charts:- Daily , Weekly | |
| Add PPBI to Watchlist: View: Get Complete PPBI Trend Analysis ➞ | |
 | WSBF Waterstone Financial, Inc. |
| Sector: Financials | |
| SubSector: Savings & Loans | |
| MarketCap: 371.93 Millions | |
| Recent Price: 12.03 Smart Investing & Trading Score: 74 | |
| Day Percent Change: -2.16% Day Change: -0.26 | |
| Week Change: 3.75% Year-to-date Change: -15.3% | |
| WSBF Links: Profile News Message Board | |
| Charts:- Daily , Weekly | |
| Add WSBF to Watchlist: View: Get Complete WSBF Trend Analysis ➞ | |
 | MEG Montrose Environmental Group, Inc. |
| Sector: Industrials | |
| SubSector: Waste Management | |
| MarketCap: 71627 Millions | |
| Recent Price: 40.49 Smart Investing & Trading Score: 61 | |
| Day Percent Change: -2.17% Day Change: -0.90 | |
| Week Change: 0.27% Year-to-date Change: 25.9% | |
| MEG Links: Profile News Message Board | |
| Charts:- Daily , Weekly | |
| Add MEG to Watchlist: View: Get Complete MEG Trend Analysis ➞ | |
 | TMP Tompkins Financial Corporation |
| Sector: Financials | |
| SubSector: Regional - Northeast Banks | |
| MarketCap: 1144.79 Millions | |
| Recent Price: 45.54 Smart Investing & Trading Score: 60 | |
| Day Percent Change: -2.17% Day Change: -1.01 | |
| Week Change: -0.39% Year-to-date Change: -24.4% | |
| TMP Links: Profile News Message Board | |
| Charts:- Daily , Weekly | |
| Add TMP to Watchlist: View: Get Complete TMP Trend Analysis ➞ | |
 | UONEK Urban One, Inc. |
| Sector: Services & Goods | |
| SubSector: Broadcasting - Radio | |
| MarketCap: 601.795 Millions | |
| Recent Price: 1.58 Smart Investing & Trading Score: 10 | |
| Day Percent Change: -2.17% Day Change: -0.04 | |
| Week Change: -7.35% Year-to-date Change: -54.2% | |
| UONEK Links: Profile News Message Board | |
| Charts:- Daily , Weekly | |
| Add UONEK to Watchlist: View: Get Complete UONEK Trend Analysis ➞ | |
 | GTLS Chart Industries, Inc. |
| Sector: Industrials | |
| SubSector: Metal Fabrication | |
| MarketCap: 751.15 Millions | |
| Recent Price: 149.62 Smart Investing & Trading Score: 61 | |
| Day Percent Change: -2.18% Day Change: -3.33 | |
| Week Change: 1.07% Year-to-date Change: 9.8% | |
| GTLS Links: Profile News Message Board | |
| Charts:- Daily , Weekly | |
| Add GTLS to Watchlist: View: Get Complete GTLS Trend Analysis ➞ | |
 | CLPR Clipper Realty Inc. |
| Sector: Financials | |
| SubSector: REIT - Diversified | |
| MarketCap: 113.253 Millions | |
| Recent Price: 4.04 Smart Investing & Trading Score: 52 | |
| Day Percent Change: -2.18% Day Change: -0.09 | |
| Week Change: 0% Year-to-date Change: -25.2% | |
| CLPR Links: Profile News Message Board | |
| Charts:- Daily , Weekly | |
| Add CLPR to Watchlist: View: Get Complete CLPR Trend Analysis ➞ | |
 | AGS PlayAGS, Inc. |
| Sector: Services & Goods | |
| SubSector: Gaming Activities | |
| MarketCap: 77.1289 Millions | |
| Recent Price: 8.53 Smart Investing & Trading Score: 18 | |
| Day Percent Change: -2.18% Day Change: -0.19 | |
| Week Change: 0.59% Year-to-date Change: 1.2% | |
| AGS Links: Profile News Message Board | |
| Charts:- Daily , Weekly | |
| Add AGS to Watchlist: View: Get Complete AGS Trend Analysis ➞ | |
 | KRYS Krystal Biotech, Inc. |
| Sector: Health Care | |
| SubSector: Biotechnology | |
| MarketCap: 874.085 Millions | |
| Recent Price: 155.58 Smart Investing & Trading Score: 41 | |
| Day Percent Change: -2.18% Day Change: -3.47 | |
| Week Change: -1.92% Year-to-date Change: 25.4% | |
| KRYS Links: Profile News Message Board | |
| Charts:- Daily , Weekly | |
| Add KRYS to Watchlist: View: Get Complete KRYS Trend Analysis ➞ | |
 | STNE StoneCo Ltd. |
| Sector: Technology | |
| SubSector: Application Software | |
| MarketCap: 7347.82 Millions | |
| Recent Price: 15.48 Smart Investing & Trading Score: 20 | |
| Day Percent Change: -2.18% Day Change: -0.35 | |
| Week Change: 1.21% Year-to-date Change: -14.1% | |
| STNE Links: Profile News Message Board | |
| Charts:- Daily , Weekly | |
| Add STNE to Watchlist: View: Get Complete STNE Trend Analysis ➞ | |
 | ZUO Zuora, Inc. |
| Sector: Technology | |
| SubSector: Application Software | |
| MarketCap: 1063.22 Millions | |
| Recent Price: 9.81 Smart Investing & Trading Score: 73 | |
| Day Percent Change: -2.19% Day Change: -0.22 | |
| Week Change: 6.05% Year-to-date Change: 4.4% | |
| ZUO Links: Profile News Message Board | |
| Charts:- Daily , Weekly | |
| Add ZUO to Watchlist: View: Get Complete ZUO Trend Analysis ➞ | |
 | DORM Dorman Products, Inc. |
| Sector: Consumer Staples | |
| SubSector: Auto Parts | |
| MarketCap: 2028.79 Millions | |
| Recent Price: 87.83 Smart Investing & Trading Score: 61 | |
| Day Percent Change: -2.20% Day Change: -1.98 | |
| Week Change: -0.64% Year-to-date Change: 5.3% | |
| DORM Links: Profile News Message Board | |
| Charts:- Daily , Weekly | |
| Add DORM to Watchlist: View: Get Complete DORM Trend Analysis ➞ | |
 | TENB Tenable Holdings, Inc. |
| Sector: Technology | |
| SubSector: Business Software & Services | |
| MarketCap: 1986.68 Millions | |
| Recent Price: 45.40 Smart Investing & Trading Score: 10 | |
| Day Percent Change: -2.20% Day Change: -1.02 | |
| Week Change: 1.27% Year-to-date Change: -1.4% | |
| TENB Links: Profile News Message Board | |
| Charts:- Daily , Weekly | |
| Add TENB to Watchlist: View: Get Complete TENB Trend Analysis ➞ | |
 | CURV Torrid Holdings Inc. |
| Sector: Services & Goods | |
| SubSector: Apparel Retail | |
| MarketCap: 278 Millions | |
| Recent Price: 4.89 Smart Investing & Trading Score: 69 | |
| Day Percent Change: -2.20% Day Change: -0.11 | |
| Week Change: 1.24% Year-to-date Change: -16.4% | |
| CURV Links: Profile News Message Board | |
| Charts:- Daily , Weekly | |
| Add CURV to Watchlist: View: Get Complete CURV Trend Analysis ➞ | |
 | MAC The Macerich Company |
| Sector: Financials | |
| SubSector: REIT - Retail | |
| MarketCap: 1172.54 Millions | |
| Recent Price: 15.30 Smart Investing & Trading Score: 7 | |
| Day Percent Change: -2.21% Day Change: -0.35 | |
| Week Change: 0.03% Year-to-date Change: -0.9% | |
| MAC Links: Profile News Message Board | |
| Charts:- Daily , Weekly | |
| Add MAC to Watchlist: View: Get Complete MAC Trend Analysis ➞ | |
 | SAFE Safehold Inc. |
| Sector: Financials | |
| SubSector: REIT - Diversified | |
| MarketCap: 2994.63 Millions | |
| Recent Price: 18.60 Smart Investing & Trading Score: 27 | |
| Day Percent Change: -2.21% Day Change: -0.42 | |
| Week Change: -1.8% Year-to-date Change: -20.5% | |
| SAFE Links: Profile News Message Board | |
| Charts:- Daily , Weekly | |
| Add SAFE to Watchlist: View: Get Complete SAFE Trend Analysis ➞ | |
 | AVTE Aerovate Therapeutics, Inc. |
| Sector: Health Care | |
| SubSector: Biotechnology | |
| MarketCap: 478 Millions | |
| Recent Price: 20.80 Smart Investing & Trading Score: 46 | |
| Day Percent Change: -2.21% Day Change: -0.47 | |
| Week Change: -5.67% Year-to-date Change: -7.8% | |
| AVTE Links: Profile News Message Board | |
| Charts:- Daily , Weekly | |
| Add AVTE to Watchlist: View: Get Complete AVTE Trend Analysis ➞ | |
 | GT The Goodyear Tire & Rubber Company |
| Sector: Consumer Staples | |
| SubSector: Rubber & Plastics | |
| MarketCap: 1483.7 Millions | |
| Recent Price: 11.66 Smart Investing & Trading Score: 10 | |
| Day Percent Change: -2.22% Day Change: -0.27 | |
| Week Change: -1.81% Year-to-date Change: -18.5% | |
| GT Links: Profile News Message Board | |
| Charts:- Daily , Weekly | |
| Add GT to Watchlist: View: Get Complete GT Trend Analysis ➞ | |
 | YELP Yelp Inc. |
| Sector: Technology | |
| SubSector: Internet Information Providers | |
| MarketCap: 1430.1 Millions | |
| Recent Price: 39.49 Smart Investing & Trading Score: 50 | |
| Day Percent Change: -2.22% Day Change: -0.90 | |
| Week Change: 0.52% Year-to-date Change: -16.6% | |
| YELP Links: Profile News Message Board | |
| Charts:- Daily , Weekly | |
| Add YELP to Watchlist: View: Get Complete YELP Trend Analysis ➞ | |
 | INSM Insmed Incorporated |
| Sector: Health Care | |
| SubSector: Biotechnology | |
| MarketCap: 1452.45 Millions | |
| Recent Price: 25.23 Smart Investing & Trading Score: 35 | |
| Day Percent Change: -2.23% Day Change: -0.57 | |
| Week Change: 3.76% Year-to-date Change: -18.6% | |
| INSM Links: Profile News Message Board | |
| Charts:- Daily , Weekly | |
| Add INSM to Watchlist: View: Get Complete INSM Trend Analysis ➞ | |
 | DXPE DXP Enterprises, Inc. |
| Sector: Services & Goods | |
| SubSector: Industrial Equipment Wholesale | |
| MarketCap: 243.758 Millions | |
| Recent Price: 50.75 Smart Investing & Trading Score: 61 | |
| Day Percent Change: -2.23% Day Change: -1.16 | |
| Week Change: 0.55% Year-to-date Change: 50.6% | |
| DXPE Links: Profile News Message Board | |
| Charts:- Daily , Weekly | |
| Add DXPE to Watchlist: View: Get Complete DXPE Trend Analysis ➞ | |
 | GRBK Green Brick Partners, Inc. |
| Sector: Financials | |
| SubSector: Real Estate Development | |
| MarketCap: 341.819 Millions | |
| Recent Price: 53.10 Smart Investing & Trading Score: 51 | |
| Day Percent Change: -2.23% Day Change: -1.21 | |
| Week Change: 1.45% Year-to-date Change: 2.2% | |
| GRBK Links: Profile News Message Board | |
| Charts:- Daily , Weekly | |
| Add GRBK to Watchlist: View: Get Complete GRBK Trend Analysis ➞ | |
 | UPWK Upwork Inc. |
| Sector: Technology | |
| SubSector: Internet Information Providers | |
| MarketCap: 815.98 Millions | |
| Recent Price: 11.11 Smart Investing & Trading Score: 20 | |
| Day Percent Change: -2.24% Day Change: -0.25 | |
| Week Change: -0.22% Year-to-date Change: -25.3% | |
| UPWK Links: Profile News Message Board | |
| Charts:- Daily , Weekly | |
| Add UPWK to Watchlist: View: Get Complete UPWK Trend Analysis ➞ | |
 | PTEN Patterson-UTI Energy, Inc. |
| Sector: Energy | |
| SubSector: Oil & Gas Drilling & Exploration | |
| MarketCap: 422.639 Millions | |
| Recent Price: 11.27 Smart Investing & Trading Score: 61 | |
| Day Percent Change: -2.25% Day Change: -0.26 | |
| Week Change: -2.09% Year-to-date Change: 4.4% | |
| PTEN Links: Profile News Message Board | |
| Charts:- Daily , Weekly | |
| Add PTEN to Watchlist: View: Get Complete PTEN Trend Analysis ➞ | |
 | NL NL Industries, Inc. |
| Sector: Services & Goods | |
| SubSector: Industrial Equipment Wholesale | |
| MarketCap: 126.258 Millions | |
| Recent Price: 7.81 Smart Investing & Trading Score: 53 | |
| Day Percent Change: -2.25% Day Change: -0.18 | |
| Week Change: 0% Year-to-date Change: 39.2% | |
| NL Links: Profile News Message Board | |
| Charts:- Daily , Weekly | |
| Add NL to Watchlist: View: Get Complete NL Trend Analysis ➞ | |
| For tabular summary view of above stock list: Summary View ➞ 0 - 25 , 25 - 50 , 50 - 75 , 75 - 100 , 100 - 125 , 125 - 150 , 150 - 175 , 175 - 200 , 200 - 225 , 225 - 250 , 250 - 275 , 275 - 300 , 300 - 325 , 325 - 350 , 350 - 375 , 375 - 400 , 400 - 425 , 425 - 450 , 450 - 475 , 475 - 500 , 500 - 525 , 525 - 550 , 550 - 575 , 575 - 600 , 600 - 625 , 625 - 650 , 650 - 675 , 675 - 700 , 700 - 725 , 725 - 750 , 750 - 775 , 775 - 800 , 800 - 825 , 825 - 850 , 850 - 875 , 875 - 900 , 900 - 925 , 925 - 950 , 950 - 975 , 975 - 1000 , 1000 - 1025 , 1025 - 1050 , 1050 - 1075 , 1075 - 1100 , 1100 - 1125 , 1125 - 1150 , 1150 - 1175 , 1175 - 1200 , 1200 - 1225 , 1225 - 1250 , 1250 - 1275 , 1275 - 1300 , 1300 - 1325 , 1325 - 1350 , 1350 - 1375 , 1375 - 1400 , 1400 - 1425 , 1425 - 1450 , 1450 - 1475 , 1475 - 1500 , 1500 - 1525 , 1525 - 1550 , 1550 - 1575 , 1575 - 1600 | ||
| Click To Change The Sort Order: By Market Cap or Company Size Performance: Year-to-date, Week and Day | |
| Select Chart Type: | ||
| Too many stocks? View smallcap stocks filtered by marketcap & sector |
| Marketcap: All SmallCap Stocks (default-no microcap), Large, Mid-Range, Small & MicroCap |
| Sector: Tech, Finance, Energy, Staples, Retail, Industrial, Materials, Utilities & Medical |
|
Best Stocks Today 12Stocks.com |
© 2024 12Stocks.com Terms & Conditions Privacy Contact Us
All Information Provided Only For Education And Not To Be Used For Investing or Trading. See Terms & Conditions


One More Thing ... Get Best Stocks Delivered Daily!
Never Ever Miss A Move With Our Top Ten Stocks Lists
Find Best Stocks In Any Market - Bull or Bear Market
Take A Peek At Our Top Ten Stocks Lists: Daily, Weekly, Year-to-Date & Top Trends
Find Best Stocks In Any Market - Bull or Bear Market
Take A Peek At Our Top Ten Stocks Lists: Daily, Weekly, Year-to-Date & Top Trends
Smallcap Stocks With Best Up Trends [0-bearish to 100-bullish]: Ribbon [100], Diodes [100], Trustmark [100], Sanmina [100], California Water[100], NextNav [100], B. Riley[100], Third Coast[100], Northwest Natural[100], LCNB [100], Agios [100]
Best Smallcap Stocks Year-to-Date:
CareMax [572.16%], Janux [333.88%], Alpine Immune[239.52%], Longboard [218%], Super Micro[170.84%], Avidity Biosciences[159.79%], Arcutis Bio[156.19%], Vera [154.33%], Hippo [126.07%], Y-mAbs [121.85%], Stoke [115.78%] Best Smallcap Stocks This Week:
Matterport [168.39%], B. Riley[49.67%], Seres [38.35%], Ribbon [30.81%], CareMax [26.85%], ProKidney [25.74%], Riot Blockchain[25.19%], Impinj [22.93%], Cullinan Oncology[21.1%], Hibbett Sports[21%], OptiNose [18.42%] Best Smallcap Stocks Daily:
Impinj [18.26%], OptiNose [14.56%], Strategic Education[12.22%], Red Robin[8.77%], Sonic Automotive[8.63%], Intevac [7.97%], JELD-WEN Holding[7.31%], Zura Bio[6.75%], Community Health[6.44%], Seres [6.18%], Vicor [5.49%]