
 Login Sign Up


| |||||
 |  | ||||

| 12Stocks.com Market Intelligence |
Best SmallCap Stocks
|
| In a hurry? Small Cap Stock Lists: Performance Trends Table, Stock Charts
Sort Small Cap stocks: Daily, Weekly, Year-to-Date, Market Cap & Trends. Filter Small Cap stocks list by sector: Show all, Tech, Finance, Energy, Staples, Retail, Industrial, Materials, Utilities and HealthCare Filter Small Cap stocks list by size: All Large Medium Small and MicroCap |
| 12Stocks.com Small Cap Stocks Performances & Trends Daily | |||||||||
|
|  The overall Smart Investing & Trading Score is 44 (0-bearish to 100-bullish) which puts Small Cap index in short term neutral trend. The Smart Investing & Trading Score from previous trading session is 58 and hence a deterioration of trend.
| ||||||||
Here are the Smart Investing & Trading Scores of the most requested small cap stocks at 12Stocks.com (click stock name for detailed review):
|


| 12Stocks.com: Investing in Smallcap Index with Stocks | |
|
The following table helps investors and traders sort through current performance and trends (as measured by Smart Investing & Trading Score) of various
stocks in the Smallcap Index. Quick View: Move mouse or cursor over stock symbol (ticker) to view short-term technical chart and over stock name to view long term chart. Click on  to add stock symbol to your watchlist and to add stock symbol to your watchlist and  to view watchlist. Click on any ticker or stock name for detailed market intelligence report for that stock. to view watchlist. Click on any ticker or stock name for detailed market intelligence report for that stock. |
12Stocks.com Performance of Stocks in Smallcap Index
| Ticker | Stock Name | Watchlist | Category | Recent Price | Smart Investing & Trading Score | Change % | YTD Change% |
| EWTX | Edgewise |   | Health Care | 15.94 | 30 | 1.21 | 40.44% |
| GPOR | Gulfport Energy | | Energy | 161.12 | 78 | 1.17 | 20.96% |
| ATKR | Atkore | | Industrials | 181.21 | 68 | 1.17 | 13.26% |
| BHIL | Benson Hill | | Materials | 0.18 | 37 | 1.16 | 4.67% |
| INTA | Intapp | | Technology | 31.45 | 42 | 1.16 | -17.61% |
| PUMP | ProPetro Holding | | Energy | 8.76 | 42 | 1.15 | 4.53% |
| BXC | BlueLinx | | Services & Goods | 113.59 | 25 | 1.14 | 0.25% |
| DY | Dycom Industries | | Industrials | 140.95 | 75 | 1.13 | 22.47% |
| PBPB | Potbelly | | Services & Goods | 10.76 | 50 | 1.13 | 3.26% |
| SUM | Summit Materials | | Industrials | 39.37 | 51 | 1.13 | 2.37% |
| FG | F&G Annuities | | Financials | 38.63 | 49 | 1.13 | -16.21% |
| PTCT | PTC | | Health Care | 25.49 | 28 | 1.11 | -7.51% |
| PRDO | Perdoceo Education | | Services & Goods | 18.63 | 77 | 1.11 | 6.06% |
| PAGS | PagSeguro Digital | | Financials | 11.82 | 10 | 1.11 | -5.21% |
| DRQ | Dril-Quip | | Energy | 19.31 | 10 | 1.10 | -17.02% |
| XNCR | Xencor | | Health Care | 19.23 | 17 | 1.10 | -9.42% |
| LBRT | Liberty Oilfield | | Energy | 23.01 | 61 | 1.10 | 26.85% |
| TTMI | TTM | | Technology | 14.78 | 86 | 1.09 | -6.51% |
| SIG | Signet Jewelers | | Services & Goods | 99.66 | 40 | 1.09 | -7.09% |
| ASO | Academy Sports | | Services & Goods | 59.70 | 32 | 1.08 | -9.57% |
| MTTR | Matterport | | Technology | 4.68 | 80 | 1.08 | 73.33% |
| MORF | Morphic Holding | | Health Care | 27.98 | 18 | 1.05 | -3.12% |
| BZH | Beazer Homes | | Industrials | 27.49 | 25 | 1.03 | -18.64% |
| CHGG | Chegg | | Services & Goods | 6.88 | 10 | 1.03 | -39.44% |
| BATRK | Liberty Braves | | Services & Goods | 38.42 | 35 | 1.03 | -2.93% |


| Too many stocks? View smallcap stocks filtered by marketcap & sector |
| Marketcap: All SmallCap Stocks (default-no microcap), Large, Mid-Range, Small |
| Smallcap Sector: Tech, Finance, Energy, Staples, Retail, Industrial, Materials, & Medical |
|
Get the most comprehensive stock market coverage daily at 12Stocks.com ➞ Best Stocks Today ➞ Best Stocks Weekly ➞ Best Stocks Year-to-Date ➞ Best Stocks Trends ➞  Best Stocks Today 12Stocks.com Best Nasdaq Stocks ➞ Best S&P 500 Stocks ➞ Best Tech Stocks ➞ Best Biotech Stocks ➞ |
| Detailed Overview of SmallCap Stocks |
| SmallCap Technical Overview, Leaders & Laggards, Top SmallCap ETF Funds & Detailed SmallCap Stocks List, Charts, Trends & More |
| Smallcap: Technical Analysis, Trends & YTD Performance | |
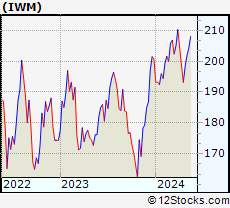
| SmallCap segment as represented by
IWM, an exchange-traded fund [ETF], holds basket of thousands of smallcap stocks from across all major sectors of the US stock market. The smallcap index (contains stocks like Riverbed & Sotheby's) is down by -2.11% and is currently underperforming the overall market by -7.27% year-to-date. Below is a quick view of technical charts and trends: | |
 IWM Weekly Chart |
|
| Long Term Trend: Good | |
| Medium Term Trend: Not Good | |
 IWM Daily Chart |
|
| Short Term Trend: Very Good | |
| Overall Trend Score: 44 | |
| YTD Performance: -2.11% | |
| **Trend Scores & Views Are Only For Educational Purposes And Not For Investing | |
| 12Stocks.com: Top Performing Small Cap Index Stocks | ||||||||||||||||||||||||||||||||||||||||||||||||
 The top performing Small Cap Index stocks year to date are
Now, more recently, over last week, the top performing Small Cap Index stocks on the move are


|
||||||||||||||||||||||||||||||||||||||||||||||||
| 12Stocks.com: Investing in Smallcap Index using Exchange Traded Funds | |
|
The following table shows list of key exchange traded funds (ETF) that
help investors track Smallcap index. The following list also includes leveraged ETF funds that track twice or thrice the daily returns of Smallcap indices. Short or inverse ETF funds move in the opposite direction to the index they track and are useful during market pullbacks or during bear markets. Quick View: Move mouse or cursor over ETF symbol (ticker) to view short-term technical chart and over ETF name to view long term chart. Click on ticker or stock name for detailed view. Click on to add stock symbol to your watchlist and to view watchlist. |
12Stocks.com List of ETFs that track Smallcap Index
| Ticker | ETF Name | Watchlist | Recent Price | Smart Investing & Trading Score | Change % | Week % | Year-to-date % |
| IWM | iShares Russell 2000 | | 196.48 | 44 | -0.61 | 1.73 | -2.11% |
| IJR | iShares Core S&P Small-Cap | | 104.86 | 78 | -0.80 | 1.59 | -3.13% |
| VTWO | Vanguard Russell 2000 ETF | | 79.45 | 63 | -0.60 | 1.75 | -2.03% |
| IWN | iShares Russell 2000 Value | | 150.18 | 68 | -0.73 | 1.62 | -3.32% |
| IWO | iShares Russell 2000 Growth | | 249.86 | 51 | -0.56 | 1.86 | -0.94% |
| IJS | iShares S&P Small-Cap 600 Value | | 96.69 | 60 | -1.04 | 1.13 | -6.19% |
| IJT | iShares S&P Small-Cap 600 Growth | | 125.06 | 63 | -0.25 | 2.33 | -0.06% |
| XSLV | PowerShares S&P SmallCap Low Volatil ETF | | 42.54 | 73 | -0.93 | 0.85 | -3.65% |
| SDD | ProShares UltraShort SmallCap600 | | 19.58 | 42 | 0.46 | -3.74 | 6.26% |
| SBB | ProShares Short SmallCap600 | | 16.50 | 40 | 0.79 | -2.02 | 3.58% |
| SMLV | SPDR SSGA US Small Cap Low Volatil ETF | | 107.33 | 73 | -1.01 | 1.17 | -4.61% |
| SAA | ProShares Ultra SmallCap600 | | 22.66 | 58 | -1.52 | 3.94 | -9.18% |
| 12Stocks.com: Charts, Trends, Fundamental Data and Performances of SmallCap Stocks | |
|
We now take in-depth look at all SmallCap stocks including charts, multi-period performances and overall trends (as measured by Smart Investing & Trading Score). One can sort SmallCap stocks (click link to choose) by Daily, Weekly and by Year-to-Date performances. Also, one can sort by size of the company or by market capitalization. |
| Select Your Default Chart Type: | |||||
| |||||
| Click on stock symbol or name for detailed view. Click on to add stock symbol to your watchlist and to view watchlist. Quick View: Move mouse or cursor over "Daily" to quickly view daily technical stock chart and over "Weekly" to view weekly technical stock chart. | |||||

 | EWTX Edgewise Therapeutics, Inc. |
| Sector: Health Care | |
| SubSector: Biotechnology | |
| MarketCap: 492 Millions | |
| Recent Price: 15.94 Smart Investing & Trading Score: 30 | |
| Day Percent Change: 1.21% Day Change: 0.19 | |
| Week Change: 4.66% Year-to-date Change: 40.4% | |
| EWTX Links: Profile News Message Board | |
| Charts:- Daily , Weekly | |
| Add EWTX to Watchlist: View: Get Complete EWTX Trend Analysis ➞ | |
 | GPOR Gulfport Energy Corporation |
| Sector: Energy | |
| SubSector: Oil & Gas E&P | |
| MarketCap: 1890 Millions | |
| Recent Price: 161.12 Smart Investing & Trading Score: 78 | |
| Day Percent Change: 1.17% Day Change: 1.87 | |
| Week Change: 4.41% Year-to-date Change: 21.0% | |
| GPOR Links: Profile News Message Board | |
| Charts:- Daily , Weekly | |
| Add GPOR to Watchlist: View: Get Complete GPOR Trend Analysis ➞ | |
 | ATKR Atkore International Group Inc. |
| Sector: Industrials | |
| SubSector: Industrial Electrical Equipment | |
| MarketCap: 1086.79 Millions | |
| Recent Price: 181.21 Smart Investing & Trading Score: 68 | |
| Day Percent Change: 1.17% Day Change: 2.10 | |
| Week Change: 5.47% Year-to-date Change: 13.3% | |
| ATKR Links: Profile News Message Board | |
| Charts:- Daily , Weekly | |
| Add ATKR to Watchlist: View: Get Complete ATKR Trend Analysis ➞ | |
 | BHIL Benson Hill, Inc. |
| Sector: Materials | |
| SubSector: Agricultural Inputs | |
| MarketCap: 236 Millions | |
| Recent Price: 0.18 Smart Investing & Trading Score: 37 | |
| Day Percent Change: 1.16% Day Change: 0.00 | |
| Week Change: 11.79% Year-to-date Change: 4.7% | |
| BHIL Links: Profile News Message Board | |
| Charts:- Daily , Weekly | |
| Add BHIL to Watchlist: View: Get Complete BHIL Trend Analysis ➞ | |
 | INTA Intapp, Inc. |
| Sector: Technology | |
| SubSector: Software - Application | |
| MarketCap: 2820 Millions | |
| Recent Price: 31.45 Smart Investing & Trading Score: 42 | |
| Day Percent Change: 1.16% Day Change: 0.36 | |
| Week Change: 2.24% Year-to-date Change: -17.6% | |
| INTA Links: Profile News Message Board | |
| Charts:- Daily , Weekly | |
| Add INTA to Watchlist: View: Get Complete INTA Trend Analysis ➞ | |
 | PUMP ProPetro Holding Corp. |
| Sector: Energy | |
| SubSector: Oil & Gas Equipment & Services | |
| MarketCap: 181.261 Millions | |
| Recent Price: 8.76 Smart Investing & Trading Score: 42 | |
| Day Percent Change: 1.15% Day Change: 0.10 | |
| Week Change: 2.58% Year-to-date Change: 4.5% | |
| PUMP Links: Profile News Message Board | |
| Charts:- Daily , Weekly | |
| Add PUMP to Watchlist: View: Get Complete PUMP Trend Analysis ➞ | |
 | BXC BlueLinx Holdings Inc. |
| Sector: Services & Goods | |
| SubSector: Building Materials Wholesale | |
| MarketCap: 60.7243 Millions | |
| Recent Price: 113.59 Smart Investing & Trading Score: 25 | |
| Day Percent Change: 1.14% Day Change: 1.28 | |
| Week Change: 4.65% Year-to-date Change: 0.3% | |
| BXC Links: Profile News Message Board | |
| Charts:- Daily , Weekly | |
| Add BXC to Watchlist: View: Get Complete BXC Trend Analysis ➞ | |
 | DY Dycom Industries, Inc. |
| Sector: Industrials | |
| SubSector: Heavy Construction | |
| MarketCap: 576.295 Millions | |
| Recent Price: 140.95 Smart Investing & Trading Score: 75 | |
| Day Percent Change: 1.13% Day Change: 1.58 | |
| Week Change: 3.98% Year-to-date Change: 22.5% | |
| DY Links: Profile News Message Board | |
| Charts:- Daily , Weekly | |
| Add DY to Watchlist: View: Get Complete DY Trend Analysis ➞ | |
 | PBPB Potbelly Corporation |
| Sector: Services & Goods | |
| SubSector: Specialty Eateries | |
| MarketCap: 58.8 Millions | |
| Recent Price: 10.76 Smart Investing & Trading Score: 50 | |
| Day Percent Change: 1.13% Day Change: 0.12 | |
| Week Change: 3.07% Year-to-date Change: 3.3% | |
| PBPB Links: Profile News Message Board | |
| Charts:- Daily , Weekly | |
| Add PBPB to Watchlist: View: Get Complete PBPB Trend Analysis ➞ | |
 | SUM Summit Materials, Inc. |
| Sector: Industrials | |
| SubSector: General Building Materials | |
| MarketCap: 1138.23 Millions | |
| Recent Price: 39.37 Smart Investing & Trading Score: 51 | |
| Day Percent Change: 1.13% Day Change: 0.44 | |
| Week Change: 2.77% Year-to-date Change: 2.4% | |
| SUM Links: Profile News Message Board | |
| Charts:- Daily , Weekly | |
| Add SUM to Watchlist: View: Get Complete SUM Trend Analysis ➞ | |
 | FG F&G Annuities & Life, Inc. |
| Sector: Financials | |
| SubSector: Insurance - Life | |
| MarketCap: 2960 Millions | |
| Recent Price: 38.63 Smart Investing & Trading Score: 49 | |
| Day Percent Change: 1.13% Day Change: 0.43 | |
| Week Change: 5.78% Year-to-date Change: -16.2% | |
| FG Links: Profile News Message Board | |
| Charts:- Daily , Weekly | |
| Add FG to Watchlist: View: Get Complete FG Trend Analysis ➞ | |
 | PTCT PTC Therapeutics, Inc. |
| Sector: Health Care | |
| SubSector: Biotechnology | |
| MarketCap: 2795.85 Millions | |
| Recent Price: 25.49 Smart Investing & Trading Score: 28 | |
| Day Percent Change: 1.11% Day Change: 0.28 | |
| Week Change: 0.67% Year-to-date Change: -7.5% | |
| PTCT Links: Profile News Message Board | |
| Charts:- Daily , Weekly | |
| Add PTCT to Watchlist: View: Get Complete PTCT Trend Analysis ➞ | |
 | PRDO Perdoceo Education Corporation |
| Sector: Services & Goods | |
| SubSector: Education & Training Services | |
| MarketCap: 631.006 Millions | |
| Recent Price: 18.63 Smart Investing & Trading Score: 77 | |
| Day Percent Change: 1.11% Day Change: 0.20 | |
| Week Change: 7.53% Year-to-date Change: 6.1% | |
| PRDO Links: Profile News Message Board | |
| Charts:- Daily , Weekly | |
| Add PRDO to Watchlist: View: Get Complete PRDO Trend Analysis ➞ | |
 | PAGS PagSeguro Digital Ltd. |
| Sector: Financials | |
| SubSector: Credit Services | |
| MarketCap: 6500.78 Millions | |
| Recent Price: 11.82 Smart Investing & Trading Score: 10 | |
| Day Percent Change: 1.11% Day Change: 0.13 | |
| Week Change: 2.96% Year-to-date Change: -5.2% | |
| PAGS Links: Profile News Message Board | |
| Charts:- Daily , Weekly | |
| Add PAGS to Watchlist: View: Get Complete PAGS Trend Analysis ➞ | |
 | DRQ Dril-Quip, Inc. |
| Sector: Energy | |
| SubSector: Oil & Gas Equipment & Services | |
| MarketCap: 1211.61 Millions | |
| Recent Price: 19.31 Smart Investing & Trading Score: 10 | |
| Day Percent Change: 1.10% Day Change: 0.21 | |
| Week Change: -1.78% Year-to-date Change: -17.0% | |
| DRQ Links: Profile News Message Board | |
| Charts:- Daily , Weekly | |
| Add DRQ to Watchlist: View: Get Complete DRQ Trend Analysis ➞ | |
 | XNCR Xencor, Inc. |
| Sector: Health Care | |
| SubSector: Biotechnology | |
| MarketCap: 1744.35 Millions | |
| Recent Price: 19.23 Smart Investing & Trading Score: 17 | |
| Day Percent Change: 1.10% Day Change: 0.21 | |
| Week Change: 4.62% Year-to-date Change: -9.4% | |
| XNCR Links: Profile News Message Board | |
| Charts:- Daily , Weekly | |
| Add XNCR to Watchlist: View: Get Complete XNCR Trend Analysis ➞ | |
 | LBRT Liberty Oilfield Services Inc. |
| Sector: Energy | |
| SubSector: Oil & Gas Equipment & Services | |
| MarketCap: 308.261 Millions | |
| Recent Price: 23.01 Smart Investing & Trading Score: 61 | |
| Day Percent Change: 1.10% Day Change: 0.25 | |
| Week Change: 2.82% Year-to-date Change: 26.9% | |
| LBRT Links: Profile News Message Board | |
| Charts:- Daily , Weekly | |
| Add LBRT to Watchlist: View: Get Complete LBRT Trend Analysis ➞ | |
 | TTMI TTM Technologies, Inc. |
| Sector: Technology | |
| SubSector: Printed Circuit Boards | |
| MarketCap: 1028.35 Millions | |
| Recent Price: 14.78 Smart Investing & Trading Score: 86 | |
| Day Percent Change: 1.09% Day Change: 0.16 | |
| Week Change: 5.2% Year-to-date Change: -6.5% | |
| TTMI Links: Profile News Message Board | |
| Charts:- Daily , Weekly | |
| Add TTMI to Watchlist: View: Get Complete TTMI Trend Analysis ➞ | |
 | SIG Signet Jewelers Limited |
| Sector: Services & Goods | |
| SubSector: Jewelry Stores | |
| MarketCap: 518.1 Millions | |
| Recent Price: 99.66 Smart Investing & Trading Score: 40 | |
| Day Percent Change: 1.09% Day Change: 1.07 | |
| Week Change: 4.39% Year-to-date Change: -7.1% | |
| SIG Links: Profile News Message Board | |
| Charts:- Daily , Weekly | |
| Add SIG to Watchlist: View: Get Complete SIG Trend Analysis ➞ | |
 | ASO Academy Sports and Outdoors, Inc. |
| Sector: Services & Goods | |
| SubSector: Specialty Retail | |
| MarketCap: 16027 Millions | |
| Recent Price: 59.70 Smart Investing & Trading Score: 32 | |
| Day Percent Change: 1.08% Day Change: 0.64 | |
| Week Change: 4.64% Year-to-date Change: -9.6% | |
| ASO Links: Profile News Message Board | |
| Charts:- Daily , Weekly | |
| Add ASO to Watchlist: View: Get Complete ASO Trend Analysis ➞ | |
 | MTTR Matterport, Inc. |
| Sector: Technology | |
| SubSector: Software - Application | |
| MarketCap: 920 Millions | |
| Recent Price: 4.68 Smart Investing & Trading Score: 80 | |
| Day Percent Change: 1.08% Day Change: 0.05 | |
| Week Change: 168.97% Year-to-date Change: 73.3% | |
| MTTR Links: Profile News Message Board | |
| Charts:- Daily , Weekly | |
| Add MTTR to Watchlist: View: Get Complete MTTR Trend Analysis ➞ | |
 | MORF Morphic Holding, Inc. |
| Sector: Health Care | |
| SubSector: Biotechnology | |
| MarketCap: 484.885 Millions | |
| Recent Price: 27.98 Smart Investing & Trading Score: 18 | |
| Day Percent Change: 1.05% Day Change: 0.29 | |
| Week Change: -0.07% Year-to-date Change: -3.1% | |
| MORF Links: Profile News Message Board | |
| Charts:- Daily , Weekly | |
| Add MORF to Watchlist: View: Get Complete MORF Trend Analysis ➞ | |
 | BZH Beazer Homes USA, Inc. |
| Sector: Industrials | |
| SubSector: Residential Construction | |
| MarketCap: 180.106 Millions | |
| Recent Price: 27.49 Smart Investing & Trading Score: 25 | |
| Day Percent Change: 1.03% Day Change: 0.28 | |
| Week Change: 4.48% Year-to-date Change: -18.6% | |
| BZH Links: Profile News Message Board | |
| Charts:- Daily , Weekly | |
| Add BZH to Watchlist: View: Get Complete BZH Trend Analysis ➞ | |
 | CHGG Chegg, Inc. |
| Sector: Services & Goods | |
| SubSector: Education & Training Services | |
| MarketCap: 3606.86 Millions | |
| Recent Price: 6.88 Smart Investing & Trading Score: 10 | |
| Day Percent Change: 1.03% Day Change: 0.07 | |
| Week Change: -2.96% Year-to-date Change: -39.4% | |
| CHGG Links: Profile News Message Board | |
| Charts:- Daily , Weekly | |
| Add CHGG to Watchlist: View: Get Complete CHGG Trend Analysis ➞ | |
 | BATRK The Liberty Braves Group |
| Sector: Services & Goods | |
| SubSector: Broadcasting - TV | |
| MarketCap: 638.363 Millions | |
| Recent Price: 38.42 Smart Investing & Trading Score: 35 | |
| Day Percent Change: 1.03% Day Change: 0.39 | |
| Week Change: 3.06% Year-to-date Change: -2.9% | |
| BATRK Links: Profile News Message Board | |
| Charts:- Daily , Weekly | |
| Add BATRK to Watchlist: View: Get Complete BATRK Trend Analysis ➞ | |
| Too many stocks? View smallcap stocks filtered by marketcap & sector |
| Marketcap: All SmallCap Stocks (default-no microcap), Large, Mid-Range, Small & MicroCap |
| Sector: Tech, Finance, Energy, Staples, Retail, Industrial, Materials, Utilities & Medical |
|
Best Stocks Today 12Stocks.com |
© 2024 12Stocks.com Terms & Conditions Privacy Contact Us
All Information Provided Only For Education And Not To Be Used For Investing or Trading. See Terms & Conditions


One More Thing ... Get Best Stocks Delivered Daily!
Never Ever Miss A Move With Our Top Ten Stocks Lists
Find Best Stocks In Any Market - Bull or Bear Market
Take A Peek At Our Top Ten Stocks Lists: Daily, Weekly, Year-to-Date & Top Trends
Find Best Stocks In Any Market - Bull or Bear Market
Take A Peek At Our Top Ten Stocks Lists: Daily, Weekly, Year-to-Date & Top Trends
Smallcap Stocks With Best Up Trends [0-bearish to 100-bullish]: B. Riley[100], Central Pacific[100], California Water[100], Cricut [100], Carpenter [100], Haemonetics [100], Sanmina [100], Trustmark [100], Comstock Resources[100], EchoStar [100], Mueller Industries[100]
Best Smallcap Stocks Year-to-Date:
CareMax [490.72%], Janux [338.34%], Viking [270.02%], Alpine Immune[239.52%], Longboard [218%], Super Micro[177%], Arcutis Bio[166.56%], Avidity Biosciences[159.79%], Vera [149.94%], Hippo [128.87%], Stoke [122.15%] Best Smallcap Stocks This Week:
Matterport [168.97%], B. Riley[73.54%], Impinj [33.73%], ProKidney [32.84%], Seres [32.65%], Riot Blockchain[32.64%], Ribbon [25.58%], Cullinan Oncology[22.92%], P.A.M. Transportation[22.85%], NuScale Power[21.44%], Hibbett Sports[21.03%] Best Smallcap Stocks Daily:
Impinj [28.65%], P.A.M. Transportation[17.95%], B. Riley[16.61%], Strategic Education[16.28%], OptiNose [14.56%], JELD-WEN Holding[11.54%], Sonic Automotive[10.86%], Intevac [10.54%], SiTime [8.84%], Noodles & [8.08%], ProKidney [7.75%]