
 Login Sign Up


| |||||
 |  | ||||

| 12Stocks.com Market Intelligence |
Best SmallCap Stocks
|
| In a hurry? Small Cap Stock Lists: Performance Trends Table, Stock Charts
Sort Small Cap stocks: Daily, Weekly, Year-to-Date, Market Cap & Trends. Filter Small Cap stocks list by sector: Show all, Tech, Finance, Energy, Staples, Retail, Industrial, Materials, Utilities and HealthCare Filter Small Cap stocks list by size: All Large Medium Small and MicroCap |
| 12Stocks.com Small Cap Stocks Performances & Trends Daily | |||||||||
|
|  The overall Smart Investing & Trading Score is 44 (0-bearish to 100-bullish) which puts Small Cap index in short term neutral trend. The Smart Investing & Trading Score from previous trading session is 58 and hence a deterioration of trend.
| ||||||||
Here are the Smart Investing & Trading Scores of the most requested small cap stocks at 12Stocks.com (click stock name for detailed review):
|


| 12Stocks.com: Investing in Smallcap Index with Stocks | |
|
The following table helps investors and traders sort through current performance and trends (as measured by Smart Investing & Trading Score) of various
stocks in the Smallcap Index. Quick View: Move mouse or cursor over stock symbol (ticker) to view short-term technical chart and over stock name to view long term chart. Click on  to add stock symbol to your watchlist and to add stock symbol to your watchlist and  to view watchlist. Click on any ticker or stock name for detailed market intelligence report for that stock. to view watchlist. Click on any ticker or stock name for detailed market intelligence report for that stock. |
12Stocks.com Performance of Stocks in Smallcap Index
| Ticker | Stock Name | Watchlist | Category | Recent Price | Smart Investing & Trading Score | Change % | YTD Change% |
| SCPH | sc |   | Health Care | 4.38 | 35 | -2.56 | -30.06% |
| SVV | Savers Value | | Services & Goods | 17.14 | 17 | -2.56 | -3.44% |
| EVRI | Everi | | Services & Goods | 8.35 | 10 | -2.57 | -25.91% |
| PAYO | Payoneer Global | | Technology | 4.92 | 93 | -2.57 | -6.99% |
| DUOL | Duolingo | | Technology | 215.13 | 76 | -2.57 | -5.59% |
| TCBI | Texas Capital | | Financials | 58.57 | 67 | -2.58 | -9.38% |
| UNTY | Unity Bancorp | | Financials | 27.02 | 62 | -2.58 | -8.67% |
| XHR | Xenia Hotels | | Financials | 14.15 | 61 | -2.58 | 3.93% |
| GRTS | Gritstone Oncology | | Health Care | 0.79 | 25 | -2.58 | -61.18% |
| TELA | TELA Bio | | Health Care | 4.34 | 0 | -2.58 | -34.52% |
| WWW | Wolverine World | | Consumer Staples | 10.35 | 93 | -2.59 | 16.37% |
| TOWN | TowneBank | | Financials | 27.03 | 67 | -2.59 | -9.17% |
| AMK | AssetMark Financial | | Financials | 33.99 | 61 | -2.59 | 13.51% |
| KTOS | Kratos Defense | | Services & Goods | 17.31 | 44 | -2.59 | -14.69% |
| SPT | Sprout Social | | Technology | 51.12 | 10 | -2.59 | -16.80% |
| AVD | American Vanguard | | Materials | 11.07 | 61 | -2.60 | 0.87% |
| PRA | ProAssurance | | Financials | 13.61 | 76 | -2.61 | -1.34% |
| PAX | Patria s | | Financials | 13.62 | 42 | -2.61 | -13.22% |
| ME | 23andMe Holding | | Health Care | 0.47 | 30 | -2.62 | -47.37% |
| OSBC | Old Second | | Financials | 14.12 | 81 | -2.62 | -8.55% |
| COOP | Mr. Cooper | | Financials | 79.58 | 75 | -2.62 | 22.21% |
| CMBM | Cambium s | | Technology | 3.34 | 35 | -2.62 | -44.33% |
| VSEC | VSE | | Services & Goods | 76.54 | 69 | -2.63 | 18.46% |
| LC | LendingClub | | Financials | 7.97 | 42 | -2.63 | -8.75% |
| LOVE | Lovesac | | Consumer Staples | 21.84 | 52 | -2.63 | -14.52% |


| Too many stocks? View smallcap stocks filtered by marketcap & sector |
| Marketcap: All SmallCap Stocks (default-no microcap), Large, Mid-Range, Small |
| Smallcap Sector: Tech, Finance, Energy, Staples, Retail, Industrial, Materials, & Medical |
|
Get the most comprehensive stock market coverage daily at 12Stocks.com ➞ Best Stocks Today ➞ Best Stocks Weekly ➞ Best Stocks Year-to-Date ➞ Best Stocks Trends ➞  Best Stocks Today 12Stocks.com Best Nasdaq Stocks ➞ Best S&P 500 Stocks ➞ Best Tech Stocks ➞ Best Biotech Stocks ➞ |
| Detailed Overview of SmallCap Stocks |
| SmallCap Technical Overview, Leaders & Laggards, Top SmallCap ETF Funds & Detailed SmallCap Stocks List, Charts, Trends & More |
| Smallcap: Technical Analysis, Trends & YTD Performance | |
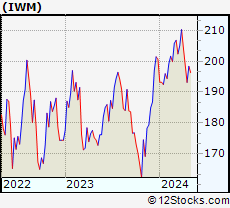
| SmallCap segment as represented by
IWM, an exchange-traded fund [ETF], holds basket of thousands of smallcap stocks from across all major sectors of the US stock market. The smallcap index (contains stocks like Riverbed & Sotheby's) is down by -2.41% and is currently underperforming the overall market by -7.26% year-to-date. Below is a quick view of technical charts and trends: | |
 IWM Weekly Chart |
|
| Long Term Trend: Good | |
| Medium Term Trend: Not Good | |
 IWM Daily Chart |
|
| Short Term Trend: Very Good | |
| Overall Trend Score: 44 | |
| YTD Performance: -2.41% | |
| **Trend Scores & Views Are Only For Educational Purposes And Not For Investing | |
| 12Stocks.com: Top Performing Small Cap Index Stocks | ||||||||||||||||||||||||||||||||||||||||||||||||
 The top performing Small Cap Index stocks year to date are
Now, more recently, over last week, the top performing Small Cap Index stocks on the move are


|
||||||||||||||||||||||||||||||||||||||||||||||||
| 12Stocks.com: Investing in Smallcap Index using Exchange Traded Funds | |
|
The following table shows list of key exchange traded funds (ETF) that
help investors track Smallcap index. The following list also includes leveraged ETF funds that track twice or thrice the daily returns of Smallcap indices. Short or inverse ETF funds move in the opposite direction to the index they track and are useful during market pullbacks or during bear markets. Quick View: Move mouse or cursor over ETF symbol (ticker) to view short-term technical chart and over ETF name to view long term chart. Click on ticker or stock name for detailed view. Click on to add stock symbol to your watchlist and to view watchlist. |
12Stocks.com List of ETFs that track Smallcap Index
| Ticker | ETF Name | Watchlist | Recent Price | Smart Investing & Trading Score | Change % | Week % | Year-to-date % |
| IWM | iShares Russell 2000 | | 195.88 | 44 | -0.91 | 1.42 | -2.41% |
| IJR | iShares Core S&P Small-Cap | | 104.62 | 78 | -1.03 | 1.36 | -3.35% |
| VTWO | Vanguard Russell 2000 ETF | | 79.21 | 63 | -0.90 | 1.45 | -2.33% |
| IWN | iShares Russell 2000 Value | | 149.73 | 68 | -1.02 | 1.32 | -3.61% |
| IWO | iShares Russell 2000 Growth | | 249.49 | 51 | -0.71 | 1.71 | -1.08% |
| IJS | iShares S&P Small-Cap 600 Value | | 96.25 | 60 | -1.49 | 0.67 | -6.62% |
| IJT | iShares S&P Small-Cap 600 Growth | | 124.73 | 63 | -0.51 | 2.06 | -0.33% |
| XSLV | PowerShares S&P SmallCap Low Volatil ETF | | 42.49 | 73 | -1.05 | 0.73 | -3.77% |
| SMLV | SPDR SSGA US Small Cap Low Volatil ETF | | 106.85 | 73 | -1.46 | 0.72 | -5.04% |
| SBB | ProShares Short SmallCap600 | | 16.65 | 40 | 1.71 | -1.13 | 4.52% |
| SDD | ProShares UltraShort SmallCap600 | | 19.60 | 42 | 0.56 | -3.64 | 6.37% |
| SAA | ProShares Ultra SmallCap600 | | 22.34 | 58 | -2.91 | 2.48 | -10.46% |
| 12Stocks.com: Charts, Trends, Fundamental Data and Performances of SmallCap Stocks | |
|
We now take in-depth look at all SmallCap stocks including charts, multi-period performances and overall trends (as measured by Smart Investing & Trading Score). One can sort SmallCap stocks (click link to choose) by Daily, Weekly and by Year-to-Date performances. Also, one can sort by size of the company or by market capitalization. |
| Select Your Default Chart Type: | |||||
| |||||
| Click on stock symbol or name for detailed view. Click on to add stock symbol to your watchlist and to view watchlist. Quick View: Move mouse or cursor over "Daily" to quickly view daily technical stock chart and over "Weekly" to view weekly technical stock chart. | |||||

 | SCPH scPharmaceuticals Inc. |
| Sector: Health Care | |
| SubSector: Biotechnology | |
| MarketCap: 136.185 Millions | |
| Recent Price: 4.38 Smart Investing & Trading Score: 35 | |
| Day Percent Change: -2.56% Day Change: -0.12 | |
| Week Change: -3.63% Year-to-date Change: -30.1% | |
| SCPH Links: Profile News Message Board | |
| Charts:- Daily , Weekly | |
| Add SCPH to Watchlist: View: Get Complete SCPH Trend Analysis ➞ | |
 | SVV Savers Value Village, Inc. |
| Sector: Services & Goods | |
| SubSector: Specialty Retail | |
| MarketCap: 3800 Millions | |
| Recent Price: 17.14 Smart Investing & Trading Score: 17 | |
| Day Percent Change: -2.56% Day Change: -0.45 | |
| Week Change: -0.12% Year-to-date Change: -3.4% | |
| SVV Links: Profile News Message Board | |
| Charts:- Daily , Weekly | |
| Add SVV to Watchlist: View: Get Complete SVV Trend Analysis ➞ | |
 | EVRI Everi Holdings Inc. |
| Sector: Services & Goods | |
| SubSector: Gaming Activities | |
| MarketCap: 273.389 Millions | |
| Recent Price: 8.35 Smart Investing & Trading Score: 10 | |
| Day Percent Change: -2.57% Day Change: -0.22 | |
| Week Change: -5.44% Year-to-date Change: -25.9% | |
| EVRI Links: Profile News Message Board | |
| Charts:- Daily , Weekly | |
| Add EVRI to Watchlist: View: Get Complete EVRI Trend Analysis ➞ | |
 | PAYO Payoneer Global Inc. |
| Sector: Technology | |
| SubSector: Software - Infrastructure | |
| MarketCap: 1710 Millions | |
| Recent Price: 4.92 Smart Investing & Trading Score: 93 | |
| Day Percent Change: -2.57% Day Change: -0.13 | |
| Week Change: 0.61% Year-to-date Change: -7.0% | |
| PAYO Links: Profile News Message Board | |
| Charts:- Daily , Weekly | |
| Add PAYO to Watchlist: View: Get Complete PAYO Trend Analysis ➞ | |
 | DUOL Duolingo, Inc. |
| Sector: Technology | |
| SubSector: Software - Application | |
| MarketCap: 6070 Millions | |
| Recent Price: 215.13 Smart Investing & Trading Score: 76 | |
| Day Percent Change: -2.57% Day Change: -5.66 | |
| Week Change: 7.48% Year-to-date Change: -5.6% | |
| DUOL Links: Profile News Message Board | |
| Charts:- Daily , Weekly | |
| Add DUOL to Watchlist: View: Get Complete DUOL Trend Analysis ➞ | |
 | TCBI Texas Capital Bancshares, Inc. |
| Sector: Financials | |
| SubSector: Regional - Southwest Banks | |
| MarketCap: 1202.75 Millions | |
| Recent Price: 58.57 Smart Investing & Trading Score: 67 | |
| Day Percent Change: -2.58% Day Change: -1.55 | |
| Week Change: -0.19% Year-to-date Change: -9.4% | |
| TCBI Links: Profile News Message Board | |
| Charts:- Daily , Weekly | |
| Add TCBI to Watchlist: View: Get Complete TCBI Trend Analysis ➞ | |
 | UNTY Unity Bancorp, Inc. |
| Sector: Financials | |
| SubSector: Money Center Banks | |
| MarketCap: 149.099 Millions | |
| Recent Price: 27.02 Smart Investing & Trading Score: 62 | |
| Day Percent Change: -2.58% Day Change: -0.71 | |
| Week Change: 0.43% Year-to-date Change: -8.7% | |
| UNTY Links: Profile News Message Board | |
| Charts:- Daily , Weekly | |
| Add UNTY to Watchlist: View: Get Complete UNTY Trend Analysis ➞ | |
 | XHR Xenia Hotels & Resorts, Inc. |
| Sector: Financials | |
| SubSector: REIT - Hotel/Motel | |
| MarketCap: 1058.24 Millions | |
| Recent Price: 14.15 Smart Investing & Trading Score: 61 | |
| Day Percent Change: -2.58% Day Change: -0.38 | |
| Week Change: 1.11% Year-to-date Change: 3.9% | |
| XHR Links: Profile News Message Board | |
| Charts:- Daily , Weekly | |
| Add XHR to Watchlist: View: Get Complete XHR Trend Analysis ➞ | |
 | GRTS Gritstone Oncology, Inc. |
| Sector: Health Care | |
| SubSector: Biotechnology | |
| MarketCap: 240.085 Millions | |
| Recent Price: 0.79 Smart Investing & Trading Score: 25 | |
| Day Percent Change: -2.58% Day Change: -0.02 | |
| Week Change: 6.81% Year-to-date Change: -61.2% | |
| GRTS Links: Profile News Message Board | |
| Charts:- Daily , Weekly | |
| Add GRTS to Watchlist: View: Get Complete GRTS Trend Analysis ➞ | |
 | TELA TELA Bio, Inc. |
| Sector: Health Care | |
| SubSector: Medical Appliances & Equipment | |
| MarketCap: 81.808 Millions | |
| Recent Price: 4.34 Smart Investing & Trading Score: 0 | |
| Day Percent Change: -2.58% Day Change: -0.12 | |
| Week Change: -8.93% Year-to-date Change: -34.5% | |
| TELA Links: Profile News Message Board | |
| Charts:- Daily , Weekly | |
| Add TELA to Watchlist: View: Get Complete TELA Trend Analysis ➞ | |
 | WWW Wolverine World Wide, Inc. |
| Sector: Consumer Staples | |
| SubSector: Textile - Apparel Footwear & Accessories | |
| MarketCap: 1390.7 Millions | |
| Recent Price: 10.35 Smart Investing & Trading Score: 93 | |
| Day Percent Change: -2.59% Day Change: -0.27 | |
| Week Change: 5.78% Year-to-date Change: 16.4% | |
| WWW Links: Profile News Message Board | |
| Charts:- Daily , Weekly | |
| Add WWW to Watchlist: View: Get Complete WWW Trend Analysis ➞ | |
 | TOWN TowneBank |
| Sector: Financials | |
| SubSector: Regional - Mid-Atlantic Banks | |
| MarketCap: 1344.09 Millions | |
| Recent Price: 27.03 Smart Investing & Trading Score: 67 | |
| Day Percent Change: -2.59% Day Change: -0.72 | |
| Week Change: 0.11% Year-to-date Change: -9.2% | |
| TOWN Links: Profile News Message Board | |
| Charts:- Daily , Weekly | |
| Add TOWN to Watchlist: View: Get Complete TOWN Trend Analysis ➞ | |
 | AMK AssetMark Financial Holdings, Inc. |
| Sector: Financials | |
| SubSector: Asset Management | |
| MarketCap: 1296.33 Millions | |
| Recent Price: 33.99 Smart Investing & Trading Score: 61 | |
| Day Percent Change: -2.59% Day Change: -0.91 | |
| Week Change: -2.14% Year-to-date Change: 13.5% | |
| AMK Links: Profile News Message Board | |
| Charts:- Daily , Weekly | |
| Add AMK to Watchlist: View: Get Complete AMK Trend Analysis ➞ | |
 | KTOS Kratos Defense & Security Solutions, Inc. |
| Sector: Services & Goods | |
| SubSector: Security & Protection Services | |
| MarketCap: 1369.63 Millions | |
| Recent Price: 17.31 Smart Investing & Trading Score: 44 | |
| Day Percent Change: -2.59% Day Change: -0.46 | |
| Week Change: -3.94% Year-to-date Change: -14.7% | |
| KTOS Links: Profile News Message Board | |
| Charts:- Daily , Weekly | |
| Add KTOS to Watchlist: View: Get Complete KTOS Trend Analysis ➞ | |
 | SPT Sprout Social, Inc. |
| Sector: Technology | |
| SubSector: Software Application | |
| MarketCap: 25087 Millions | |
| Recent Price: 51.12 Smart Investing & Trading Score: 10 | |
| Day Percent Change: -2.59% Day Change: -1.36 | |
| Week Change: 0.16% Year-to-date Change: -16.8% | |
| SPT Links: Profile News Message Board | |
| Charts:- Daily , Weekly | |
| Add SPT to Watchlist: View: Get Complete SPT Trend Analysis ➞ | |
 | AVD American Vanguard Corporation |
| Sector: Materials | |
| SubSector: Agricultural Chemicals | |
| MarketCap: 419.329 Millions | |
| Recent Price: 11.07 Smart Investing & Trading Score: 61 | |
| Day Percent Change: -2.60% Day Change: -0.29 | |
| Week Change: -0.41% Year-to-date Change: 0.9% | |
| AVD Links: Profile News Message Board | |
| Charts:- Daily , Weekly | |
| Add AVD to Watchlist: View: Get Complete AVD Trend Analysis ➞ | |
 | PRA ProAssurance Corporation |
| Sector: Financials | |
| SubSector: Accident & Health Insurance | |
| MarketCap: 1434.6 Millions | |
| Recent Price: 13.61 Smart Investing & Trading Score: 76 | |
| Day Percent Change: -2.61% Day Change: -0.37 | |
| Week Change: 1.61% Year-to-date Change: -1.3% | |
| PRA Links: Profile News Message Board | |
| Charts:- Daily , Weekly | |
| Add PRA to Watchlist: View: Get Complete PRA Trend Analysis ➞ | |
 | PAX Patria Investments Limited |
| Sector: Financials | |
| SubSector: Asset Management | |
| MarketCap: 2130 Millions | |
| Recent Price: 13.62 Smart Investing & Trading Score: 42 | |
| Day Percent Change: -2.61% Day Change: -0.37 | |
| Week Change: -0.98% Year-to-date Change: -13.2% | |
| PAX Links: Profile News Message Board | |
| Charts:- Daily , Weekly | |
| Add PAX to Watchlist: View: Get Complete PAX Trend Analysis ➞ | |
 | ME 23andMe Holding Co. |
| Sector: Health Care | |
| SubSector: Diagnostics & Research | |
| MarketCap: 802 Millions | |
| Recent Price: 0.47 Smart Investing & Trading Score: 30 | |
| Day Percent Change: -2.62% Day Change: -0.01 | |
| Week Change: -2.86% Year-to-date Change: -47.4% | |
| ME Links: Profile News Message Board | |
| Charts:- Daily , Weekly | |
| Add ME to Watchlist: View: Get Complete ME Trend Analysis ➞ | |
 | OSBC Old Second Bancorp, Inc. |
| Sector: Financials | |
| SubSector: Regional - Midwest Banks | |
| MarketCap: 237.17 Millions | |
| Recent Price: 14.12 Smart Investing & Trading Score: 81 | |
| Day Percent Change: -2.62% Day Change: -0.38 | |
| Week Change: -2.15% Year-to-date Change: -8.6% | |
| OSBC Links: Profile News Message Board | |
| Charts:- Daily , Weekly | |
| Add OSBC to Watchlist: View: Get Complete OSBC Trend Analysis ➞ | |
 | COOP Mr. Cooper Group Inc. |
| Sector: Financials | |
| SubSector: Savings & Loans | |
| MarketCap: 648.33 Millions | |
| Recent Price: 79.58 Smart Investing & Trading Score: 75 | |
| Day Percent Change: -2.62% Day Change: -2.14 | |
| Week Change: 2.6% Year-to-date Change: 22.2% | |
| COOP Links: Profile News Message Board | |
| Charts:- Daily , Weekly | |
| Add COOP to Watchlist: View: Get Complete COOP Trend Analysis ➞ | |
 | CMBM Cambium Networks Corporation |
| Sector: Technology | |
| SubSector: Communication Equipment | |
| MarketCap: 143.739 Millions | |
| Recent Price: 3.34 Smart Investing & Trading Score: 35 | |
| Day Percent Change: -2.62% Day Change: -0.09 | |
| Week Change: 1.52% Year-to-date Change: -44.3% | |
| CMBM Links: Profile News Message Board | |
| Charts:- Daily , Weekly | |
| Add CMBM to Watchlist: View: Get Complete CMBM Trend Analysis ➞ | |
 | VSEC VSE Corporation |
| Sector: Services & Goods | |
| SubSector: Technical Services | |
| MarketCap: 183.61 Millions | |
| Recent Price: 76.54 Smart Investing & Trading Score: 69 | |
| Day Percent Change: -2.63% Day Change: -2.07 | |
| Week Change: 1.14% Year-to-date Change: 18.5% | |
| VSEC Links: Profile News Message Board | |
| Charts:- Daily , Weekly | |
| Add VSEC to Watchlist: View: Get Complete VSEC Trend Analysis ➞ | |
 | LC LendingClub Corporation |
| Sector: Financials | |
| SubSector: Credit Services | |
| MarketCap: 852.308 Millions | |
| Recent Price: 7.97 Smart Investing & Trading Score: 42 | |
| Day Percent Change: -2.63% Day Change: -0.21 | |
| Week Change: 0.95% Year-to-date Change: -8.8% | |
| LC Links: Profile News Message Board | |
| Charts:- Daily , Weekly | |
| Add LC to Watchlist: View: Get Complete LC Trend Analysis ➞ | |
 | LOVE The Lovesac Company |
| Sector: Consumer Staples | |
| SubSector: Home Furnishings & Fixtures | |
| MarketCap: 112.835 Millions | |
| Recent Price: 21.84 Smart Investing & Trading Score: 52 | |
| Day Percent Change: -2.63% Day Change: -0.59 | |
| Week Change: 5% Year-to-date Change: -14.5% | |
| LOVE Links: Profile News Message Board | |
| Charts:- Daily , Weekly | |
| Add LOVE to Watchlist: View: Get Complete LOVE Trend Analysis ➞ | |
| Too many stocks? View smallcap stocks filtered by marketcap & sector |
| Marketcap: All SmallCap Stocks (default-no microcap), Large, Mid-Range, Small & MicroCap |
| Sector: Tech, Finance, Energy, Staples, Retail, Industrial, Materials, Utilities & Medical |
|
Best Stocks Today 12Stocks.com |
© 2024 12Stocks.com Terms & Conditions Privacy Contact Us
All Information Provided Only For Education And Not To Be Used For Investing or Trading. See Terms & Conditions


One More Thing ... Get Best Stocks Delivered Daily!
Never Ever Miss A Move With Our Top Ten Stocks Lists
Find Best Stocks In Any Market - Bull or Bear Market
Take A Peek At Our Top Ten Stocks Lists: Daily, Weekly, Year-to-Date & Top Trends
Find Best Stocks In Any Market - Bull or Bear Market
Take A Peek At Our Top Ten Stocks Lists: Daily, Weekly, Year-to-Date & Top Trends
Smallcap Stocks With Best Up Trends [0-bearish to 100-bullish]: B. Riley[100], Ribbon [100], Cricut [100], Central Pacific[100], California Water[100], Diodes [100], Carpenter [100], Sanmina [100], Agios [100], Comstock Resources[100], Excelerate Energy[100]
Best Smallcap Stocks Year-to-Date:
CareMax [572.16%], Janux [333.88%], Viking [261.04%], Alpine Immune[239.52%], Longboard [218%], Super Micro[175.94%], Avidity Biosciences[159.79%], Arcutis Bio[156.19%], Vera [154.33%], Hippo [126.07%], Y-mAbs [121.85%] Best Smallcap Stocks This Week:
Matterport [169.25%], B. Riley[65.73%], Seres [33.67%], Impinj [31.96%], Ribbon [30.81%], Riot Blockchain[30.23%], ProKidney [27.45%], CareMax [26.85%], P.A.M. Transportation[26.15%], Cullinan Oncology[21.1%], Hibbett Sports[20.85%] Best Smallcap Stocks Daily:
Impinj [26.95%], P.A.M. Transportation[21.11%], Strategic Education[14.81%], OptiNose [14.56%], Sonic Automotive[12.75%], Intevac [11.89%], B. Riley[11.36%], Noodles & [8.08%], Red Robin[7.69%], JELD-WEN Holding[7.31%], Community Health[6.77%]