
 Login Sign Up


| |||||
 |  | ||||

| 12Stocks.com Market Intelligence |
Best SmallCap Stocks
|
| In a hurry? Small Cap Stock Lists: Performance Trends Table, Stock Charts
Sort Small Cap stocks: Daily, Weekly, Year-to-Date, Market Cap & Trends. Filter Small Cap stocks list by sector: Show all, Tech, Finance, Energy, Staples, Retail, Industrial, Materials, Utilities and HealthCare Filter Small Cap stocks list by size: All Large Medium Small and MicroCap |
| 12Stocks.com Small Cap Stocks Performances & Trends Daily | |||||||||
|
|  The overall Smart Investing & Trading Score is 26 (0-bearish to 100-bullish) which puts Small Cap index in short term bearish to neutral trend. The Smart Investing & Trading Score from previous trading session is 31 and a deterioration of trend continues.
| ||||||||
Here are the Smart Investing & Trading Scores of the most requested small cap stocks at 12Stocks.com (click stock name for detailed review):
|


| 12Stocks.com: Investing in Smallcap Index with Stocks | |
|
The following table helps investors and traders sort through current performance and trends (as measured by Smart Investing & Trading Score) of various
stocks in the Smallcap Index. Quick View: Move mouse or cursor over stock symbol (ticker) to view short-term technical chart and over stock name to view long term chart. Click on  to add stock symbol to your watchlist and to add stock symbol to your watchlist and  to view watchlist. Click on any ticker or stock name for detailed market intelligence report for that stock. to view watchlist. Click on any ticker or stock name for detailed market intelligence report for that stock. |
12Stocks.com Performance of Stocks in Smallcap Index
| Ticker | Stock Name | Watchlist | Category | Recent Price | Smart Investing & Trading Score | Change % | YTD Change% |
| GBTG | Global Business |   | Technology | 5.88 | 41 | -0.51 | -9.95% |
| NTCT | NetScout Systems | | Technology | 19.17 | 20 | -0.52 | -12.67% |
| PNM | PNM Resources | | Utilities | 35.97 | 10 | -0.53 | -13.53% |
| CXW | CoreCivic | | Financials | 15.12 | 26 | -0.53 | 4.06% |
| NECB | Northeast Community | | Financials | 14.98 | 36 | -0.53 | -15.56% |
| DNOW | NOW | | Energy | 14.90 | 46 | -0.53 | 31.63% |
| LASR | nLIGHT | | Technology | 11.30 | 0 | -0.53 | -16.30% |
| RVLV | Revolve Group | | Services & Goods | 18.75 | 36 | -0.53 | 13.09% |
| LZB | La-Z-Boy | | Consumer Staples | 32.85 | 0 | -0.54 | -11.02% |
| ATRO | Astronics | | Industrials | 16.68 | 10 | -0.54 | -4.25% |
| PRIM | Primoris Services | | Industrials | 44.52 | 51 | -0.54 | 34.06% |
| HLIO | Helios | | Industrials | 45.75 | 63 | -0.54 | 0.88% |
| LUNG | Pulmonx | | Health Care | 7.43 | 10 | -0.54 | -41.73% |
| PLAB | Photronics | | Technology | 27.14 | 0 | -0.55 | -13.48% |
| LILA | Liberty Latin | | Technology | 7.26 | 68 | -0.55 | -0.68% |
| OMI | Owens & Minor | | Services & Goods | 24.85 | 36 | -0.56 | 28.96% |
| CMCO | Columbus McKinnon | | Industrials | 40.78 | 31 | -0.56 | 4.51% |
| AAN | Aaron s | | Transports | 7.05 | 10 | -0.56 | -35.20% |
| SHAK | Shake Shack | | Services & Goods | 96.53 | 41 | -0.56 | 30.23% |
| INST | Instructure | | Technology | 19.53 | 10 | -0.56 | -27.69% |
| BBCP | Concrete Pumping | | Industrials | 7.09 | 0 | -0.56 | -13.54% |
| AFCG | AFC Gamma | | Financials | 11.53 | 33 | -0.56 | -4.36% |
| SKIN | Beauty Health | | Consumer Staples | 3.54 | 46 | -0.56 | 11.85% |
| ASO | Academy Sports | | Services & Goods | 59.37 | 10 | -0.57 | -10.07% |
| ROCK | Gibraltar Industries | | Materials | 72.92 | 0 | -0.57 | -7.67% |


| Too many stocks? View smallcap stocks filtered by marketcap & sector |
| Marketcap: All SmallCap Stocks (default-no microcap), Large, Mid-Range, Small |
| Smallcap Sector: Tech, Finance, Energy, Staples, Retail, Industrial, Materials, & Medical |
|
Get the most comprehensive stock market coverage daily at 12Stocks.com ➞ Best Stocks Today ➞ Best Stocks Weekly ➞ Best Stocks Year-to-Date ➞ Best Stocks Trends ➞  Best Stocks Today 12Stocks.com Best Nasdaq Stocks ➞ Best S&P 500 Stocks ➞ Best Tech Stocks ➞ Best Biotech Stocks ➞ |
| Detailed Overview of SmallCap Stocks |
| SmallCap Technical Overview, Leaders & Laggards, Top SmallCap ETF Funds & Detailed SmallCap Stocks List, Charts, Trends & More |
| Smallcap: Technical Analysis, Trends & YTD Performance | |
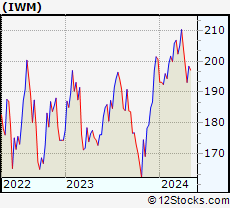
| SmallCap segment as represented by
IWM, an exchange-traded fund [ETF], holds basket of thousands of smallcap stocks from across all major sectors of the US stock market. The smallcap index (contains stocks like Riverbed & Sotheby's) is down by -2.82% and is currently underperforming the overall market by -7.84% year-to-date. Below is a quick view of technical charts and trends: | |
 IWM Weekly Chart |
|
| Long Term Trend: Good | |
| Medium Term Trend: Not Good | |
 IWM Daily Chart |
|
| Short Term Trend: Not Good | |
| Overall Trend Score: 26 | |
| YTD Performance: -2.82% | |
| **Trend Scores & Views Are Only For Educational Purposes And Not For Investing | |
| 12Stocks.com: Top Performing Small Cap Index Stocks | ||||||||||||||||||||||||||||||||||||||||||||||||
 The top performing Small Cap Index stocks year to date are
Now, more recently, over last week, the top performing Small Cap Index stocks on the move are


|
||||||||||||||||||||||||||||||||||||||||||||||||
| 12Stocks.com: Investing in Smallcap Index using Exchange Traded Funds | |
|
The following table shows list of key exchange traded funds (ETF) that
help investors track Smallcap index. The following list also includes leveraged ETF funds that track twice or thrice the daily returns of Smallcap indices. Short or inverse ETF funds move in the opposite direction to the index they track and are useful during market pullbacks or during bear markets. Quick View: Move mouse or cursor over ETF symbol (ticker) to view short-term technical chart and over ETF name to view long term chart. Click on ticker or stock name for detailed view. Click on to add stock symbol to your watchlist and to view watchlist. |
12Stocks.com List of ETFs that track Smallcap Index
| Ticker | ETF Name | Watchlist | Recent Price | Smart Investing & Trading Score | Change % | Week % | Year-to-date % |
| IWM | iShares Russell 2000 | | 195.06 | 26 | -0.37 | -1.83 | -2.82% |
| IJR | iShares Core S&P Small-Cap | | 102.72 | 0 | -0.79 | -1.71 | -5.1% |
| VTWO | Vanguard Russell 2000 ETF | | 78.70 | 26 | -0.67 | -2.02 | -2.96% |
| IWN | iShares Russell 2000 Value | | 147.16 | 13 | -0.97 | -2.14 | -5.26% |
| IWO | iShares Russell 2000 Growth | | 250.26 | 26 | -0.31 | -2 | -0.78% |
| IJS | iShares S&P Small-Cap 600 Value | | 94.41 | 0 | -0.83 | -1.83 | -8.4% |
| IJT | iShares S&P Small-Cap 600 Growth | | 122.23 | 13 | -1.04 | -2.04 | -2.33% |
| SBB | ProShares Short SmallCap600 | | 16.84 | 100 | 2.62 | 1.77 | 5.71% |
| SDD | ProShares UltraShort SmallCap600 | | 20.23 | 100 | 0.00 | 2.01 | 9.79% |
| SAA | ProShares Ultra SmallCap600 | | 21.81 | 0 | -2.76 | -3.33 | -12.59% |
| SMLV | SPDR SSGA US Small Cap Low Volatil ETF | | 103.84 | 0 | -0.85 | -1.12 | -7.71% |
| XSLV | PowerShares S&P SmallCap Low Volatil ETF | | 41.62 | 0 | -0.63 | -1.13 | -5.74% |
| 12Stocks.com: Charts, Trends, Fundamental Data and Performances of SmallCap Stocks | |
|
We now take in-depth look at all SmallCap stocks including charts, multi-period performances and overall trends (as measured by Smart Investing & Trading Score). One can sort SmallCap stocks (click link to choose) by Daily, Weekly and by Year-to-Date performances. Also, one can sort by size of the company or by market capitalization. |
| Select Your Default Chart Type: | |||||
| |||||
| Click on stock symbol or name for detailed view. Click on to add stock symbol to your watchlist and to view watchlist. Quick View: Move mouse or cursor over "Daily" to quickly view daily technical stock chart and over "Weekly" to view weekly technical stock chart. | |||||

 | GBTG Global Business Travel Group, Inc. |
| Sector: Technology | |
| SubSector: Software - Application | |
| MarketCap: 3440 Millions | |
| Recent Price: 5.88 Smart Investing & Trading Score: 41 | |
| Day Percent Change: -0.51% Day Change: -0.03 | |
| Week Change: 0.86% Year-to-date Change: -10.0% | |
| GBTG Links: Profile News Message Board | |
| Charts:- Daily , Weekly | |
| Add GBTG to Watchlist: View: Get Complete GBTG Trend Analysis ➞ | |
 | NTCT NetScout Systems, Inc. |
| Sector: Technology | |
| SubSector: Business Software & Services | |
| MarketCap: 1657.28 Millions | |
| Recent Price: 19.17 Smart Investing & Trading Score: 20 | |
| Day Percent Change: -0.52% Day Change: -0.10 | |
| Week Change: -2.59% Year-to-date Change: -12.7% | |
| NTCT Links: Profile News Message Board | |
| Charts:- Daily , Weekly | |
| Add NTCT to Watchlist: View: Get Complete NTCT Trend Analysis ➞ | |
 | PNM PNM Resources, Inc. |
| Sector: Utilities | |
| SubSector: Diversified Utilities | |
| MarketCap: 2755.3 Millions | |
| Recent Price: 35.97 Smart Investing & Trading Score: 10 | |
| Day Percent Change: -0.53% Day Change: -0.19 | |
| Week Change: -0.72% Year-to-date Change: -13.5% | |
| PNM Links: Profile News Message Board | |
| Charts:- Daily , Weekly | |
| Add PNM to Watchlist: View: Get Complete PNM Trend Analysis ➞ | |
 | CXW CoreCivic, Inc. |
| Sector: Financials | |
| SubSector: REIT - Diversified | |
| MarketCap: 1440.23 Millions | |
| Recent Price: 15.12 Smart Investing & Trading Score: 26 | |
| Day Percent Change: -0.53% Day Change: -0.08 | |
| Week Change: -1.69% Year-to-date Change: 4.1% | |
| CXW Links: Profile News Message Board | |
| Charts:- Daily , Weekly | |
| Add CXW to Watchlist: View: Get Complete CXW Trend Analysis ➞ | |
 | NECB Northeast Community Bancorp, Inc. |
| Sector: Financials | |
| SubSector: Savings & Loans | |
| MarketCap: 99.31 Millions | |
| Recent Price: 14.98 Smart Investing & Trading Score: 36 | |
| Day Percent Change: -0.53% Day Change: -0.08 | |
| Week Change: -0.47% Year-to-date Change: -15.6% | |
| NECB Links: Profile News Message Board | |
| Charts:- Daily , Weekly | |
| Add NECB to Watchlist: View: Get Complete NECB Trend Analysis ➞ | |
 | DNOW NOW Inc. |
| Sector: Energy | |
| SubSector: Oil & Gas Equipment & Services | |
| MarketCap: 679.661 Millions | |
| Recent Price: 14.90 Smart Investing & Trading Score: 46 | |
| Day Percent Change: -0.53% Day Change: -0.08 | |
| Week Change: 1.78% Year-to-date Change: 31.6% | |
| DNOW Links: Profile News Message Board | |
| Charts:- Daily , Weekly | |
| Add DNOW to Watchlist: View: Get Complete DNOW Trend Analysis ➞ | |
 | LASR nLIGHT, Inc. |
| Sector: Technology | |
| SubSector: Semiconductor - Broad Line | |
| MarketCap: 445.642 Millions | |
| Recent Price: 11.30 Smart Investing & Trading Score: 0 | |
| Day Percent Change: -0.53% Day Change: -0.06 | |
| Week Change: -3.17% Year-to-date Change: -16.3% | |
| LASR Links: Profile News Message Board | |
| Charts:- Daily , Weekly | |
| Add LASR to Watchlist: View: Get Complete LASR Trend Analysis ➞ | |
 | RVLV Revolve Group, Inc. |
| Sector: Services & Goods | |
| SubSector: Specialty Retail, Other | |
| MarketCap: 652.244 Millions | |
| Recent Price: 18.75 Smart Investing & Trading Score: 36 | |
| Day Percent Change: -0.53% Day Change: -0.10 | |
| Week Change: 0.21% Year-to-date Change: 13.1% | |
| RVLV Links: Profile News Message Board | |
| Charts:- Daily , Weekly | |
| Add RVLV to Watchlist: View: Get Complete RVLV Trend Analysis ➞ | |
 | LZB La-Z-Boy Incorporated |
| Sector: Consumer Staples | |
| SubSector: Home Furnishings & Fixtures | |
| MarketCap: 951.635 Millions | |
| Recent Price: 32.85 Smart Investing & Trading Score: 0 | |
| Day Percent Change: -0.54% Day Change: -0.18 | |
| Week Change: -3.3% Year-to-date Change: -11.0% | |
| LZB Links: Profile News Message Board | |
| Charts:- Daily , Weekly | |
| Add LZB to Watchlist: View: Get Complete LZB Trend Analysis ➞ | |
 | ATRO Astronics Corporation |
| Sector: Industrials | |
| SubSector: Aerospace/Defense Products & Services | |
| MarketCap: 287.201 Millions | |
| Recent Price: 16.68 Smart Investing & Trading Score: 10 | |
| Day Percent Change: -0.54% Day Change: -0.09 | |
| Week Change: -1.94% Year-to-date Change: -4.3% | |
| ATRO Links: Profile News Message Board | |
| Charts:- Daily , Weekly | |
| Add ATRO to Watchlist: View: Get Complete ATRO Trend Analysis ➞ | |
 | PRIM Primoris Services Corporation |
| Sector: Industrials | |
| SubSector: Heavy Construction | |
| MarketCap: 931.895 Millions | |
| Recent Price: 44.52 Smart Investing & Trading Score: 51 | |
| Day Percent Change: -0.54% Day Change: -0.24 | |
| Week Change: -2.15% Year-to-date Change: 34.1% | |
| PRIM Links: Profile News Message Board | |
| Charts:- Daily , Weekly | |
| Add PRIM to Watchlist: View: Get Complete PRIM Trend Analysis ➞ | |
 | HLIO Helios Technologies, Inc. |
| Sector: Industrials | |
| SubSector: Diversified Machinery | |
| MarketCap: 1455.66 Millions | |
| Recent Price: 45.75 Smart Investing & Trading Score: 63 | |
| Day Percent Change: -0.54% Day Change: -0.25 | |
| Week Change: -0.82% Year-to-date Change: 0.9% | |
| HLIO Links: Profile News Message Board | |
| Charts:- Daily , Weekly | |
| Add HLIO to Watchlist: View: Get Complete HLIO Trend Analysis ➞ | |
 | LUNG Pulmonx Corporation |
| Sector: Health Care | |
| SubSector: Medical Devices | |
| MarketCap: 18187 Millions | |
| Recent Price: 7.43 Smart Investing & Trading Score: 10 | |
| Day Percent Change: -0.54% Day Change: -0.04 | |
| Week Change: -5.83% Year-to-date Change: -41.7% | |
| LUNG Links: Profile News Message Board | |
| Charts:- Daily , Weekly | |
| Add LUNG to Watchlist: View: Get Complete LUNG Trend Analysis ➞ | |
 | PLAB Photronics, Inc. |
| Sector: Technology | |
| SubSector: Semiconductor Equipment & Materials | |
| MarketCap: 709.018 Millions | |
| Recent Price: 27.14 Smart Investing & Trading Score: 0 | |
| Day Percent Change: -0.55% Day Change: -0.15 | |
| Week Change: -1.77% Year-to-date Change: -13.5% | |
| PLAB Links: Profile News Message Board | |
| Charts:- Daily , Weekly | |
| Add PLAB to Watchlist: View: Get Complete PLAB Trend Analysis ➞ | |
 | LILA Liberty Latin America Ltd. |
| Sector: Technology | |
| SubSector: CATV Systems | |
| MarketCap: 2092.62 Millions | |
| Recent Price: 7.26 Smart Investing & Trading Score: 68 | |
| Day Percent Change: -0.55% Day Change: -0.04 | |
| Week Change: 0.41% Year-to-date Change: -0.7% | |
| LILA Links: Profile News Message Board | |
| Charts:- Daily , Weekly | |
| Add LILA to Watchlist: View: Get Complete LILA Trend Analysis ➞ | |
 | OMI Owens & Minor, Inc. |
| Sector: Services & Goods | |
| SubSector: Medical Equipment Wholesale | |
| MarketCap: 403.92 Millions | |
| Recent Price: 24.85 Smart Investing & Trading Score: 36 | |
| Day Percent Change: -0.56% Day Change: -0.14 | |
| Week Change: -2.85% Year-to-date Change: 29.0% | |
| OMI Links: Profile News Message Board | |
| Charts:- Daily , Weekly | |
| Add OMI to Watchlist: View: Get Complete OMI Trend Analysis ➞ | |
 | CMCO Columbus McKinnon Corporation |
| Sector: Industrials | |
| SubSector: Farm & Construction Machinery | |
| MarketCap: 598.807 Millions | |
| Recent Price: 40.78 Smart Investing & Trading Score: 31 | |
| Day Percent Change: -0.56% Day Change: -0.23 | |
| Week Change: -2.3% Year-to-date Change: 4.5% | |
| CMCO Links: Profile News Message Board | |
| Charts:- Daily , Weekly | |
| Add CMCO to Watchlist: View: Get Complete CMCO Trend Analysis ➞ | |
 | AAN Aaron s, Inc. |
| Sector: Transports | |
| SubSector: Rental & Leasing Services | |
| MarketCap: 1087.04 Millions | |
| Recent Price: 7.05 Smart Investing & Trading Score: 10 | |
| Day Percent Change: -0.56% Day Change: -0.04 | |
| Week Change: -1.54% Year-to-date Change: -35.2% | |
| AAN Links: Profile News Message Board | |
| Charts:- Daily , Weekly | |
| Add AAN to Watchlist: View: Get Complete AAN Trend Analysis ➞ | |
 | SHAK Shake Shack Inc. |
| Sector: Services & Goods | |
| SubSector: Specialty Eateries | |
| MarketCap: 1497.67 Millions | |
| Recent Price: 96.53 Smart Investing & Trading Score: 41 | |
| Day Percent Change: -0.56% Day Change: -0.54 | |
| Week Change: -0.7% Year-to-date Change: 30.2% | |
| SHAK Links: Profile News Message Board | |
| Charts:- Daily , Weekly | |
| Add SHAK to Watchlist: View: Get Complete SHAK Trend Analysis ➞ | |
 | INST Instructure Holdings, Inc. |
| Sector: Technology | |
| SubSector: Software - Application | |
| MarketCap: 3580 Millions | |
| Recent Price: 19.53 Smart Investing & Trading Score: 10 | |
| Day Percent Change: -0.56% Day Change: -0.11 | |
| Week Change: -2.45% Year-to-date Change: -27.7% | |
| INST Links: Profile News Message Board | |
| Charts:- Daily , Weekly | |
| Add INST to Watchlist: View: Get Complete INST Trend Analysis ➞ | |
 | BBCP Concrete Pumping Holdings, Inc. |
| Sector: Industrials | |
| SubSector: General Building Materials | |
| MarketCap: 263.653 Millions | |
| Recent Price: 7.09 Smart Investing & Trading Score: 0 | |
| Day Percent Change: -0.56% Day Change: -0.04 | |
| Week Change: -2.48% Year-to-date Change: -13.5% | |
| BBCP Links: Profile News Message Board | |
| Charts:- Daily , Weekly | |
| Add BBCP to Watchlist: View: Get Complete BBCP Trend Analysis ➞ | |
 | AFCG AFC Gamma, Inc. |
| Sector: Financials | |
| SubSector: REIT - Specialty | |
| MarketCap: 269 Millions | |
| Recent Price: 11.53 Smart Investing & Trading Score: 33 | |
| Day Percent Change: -0.56% Day Change: -0.06 | |
| Week Change: -0.39% Year-to-date Change: -4.4% | |
| AFCG Links: Profile News Message Board | |
| Charts:- Daily , Weekly | |
| Add AFCG to Watchlist: View: Get Complete AFCG Trend Analysis ➞ | |
 | SKIN The Beauty Health Company |
| Sector: Consumer Staples | |
| SubSector: Household & Personal Products | |
| MarketCap: 1070 Millions | |
| Recent Price: 3.54 Smart Investing & Trading Score: 46 | |
| Day Percent Change: -0.56% Day Change: -0.02 | |
| Week Change: -3.28% Year-to-date Change: 11.9% | |
| SKIN Links: Profile News Message Board | |
| Charts:- Daily , Weekly | |
| Add SKIN to Watchlist: View: Get Complete SKIN Trend Analysis ➞ | |
 | ASO Academy Sports and Outdoors, Inc. |
| Sector: Services & Goods | |
| SubSector: Specialty Retail | |
| MarketCap: 16027 Millions | |
| Recent Price: 59.37 Smart Investing & Trading Score: 10 | |
| Day Percent Change: -0.57% Day Change: -0.34 | |
| Week Change: 0.59% Year-to-date Change: -10.1% | |
| ASO Links: Profile News Message Board | |
| Charts:- Daily , Weekly | |
| Add ASO to Watchlist: View: Get Complete ASO Trend Analysis ➞ | |
 | ROCK Gibraltar Industries, Inc. |
| Sector: Materials | |
| SubSector: Steel & Iron | |
| MarketCap: 1341.08 Millions | |
| Recent Price: 72.92 Smart Investing & Trading Score: 0 | |
| Day Percent Change: -0.57% Day Change: -0.42 | |
| Week Change: -1.71% Year-to-date Change: -7.7% | |
| ROCK Links: Profile News Message Board | |
| Charts:- Daily , Weekly | |
| Add ROCK to Watchlist: View: Get Complete ROCK Trend Analysis ➞ | |
| Too many stocks? View smallcap stocks filtered by marketcap & sector |
| Marketcap: All SmallCap Stocks (default-no microcap), Large, Mid-Range, Small & MicroCap |
| Sector: Tech, Finance, Energy, Staples, Retail, Industrial, Materials, Utilities & Medical |
|
Best Stocks Today 12Stocks.com |
© 2024 12Stocks.com Terms & Conditions Privacy Contact Us
All Information Provided Only For Education And Not To Be Used For Investing or Trading. See Terms & Conditions


One More Thing ... Get Best Stocks Delivered Daily!
Never Ever Miss A Move With Our Top Ten Stocks Lists
Find Best Stocks In Any Market - Bull or Bear Market
Take A Peek At Our Top Ten Stocks Lists: Daily, Weekly, Year-to-Date & Top Trends
Find Best Stocks In Any Market - Bull or Bear Market
Take A Peek At Our Top Ten Stocks Lists: Daily, Weekly, Year-to-Date & Top Trends
Smallcap Stocks With Best Up Trends [0-bearish to 100-bullish]: Macatawa Bank[100], ProKidney [100], Intra-Cellular Therapies[100], Warrior Met[100], IMAX [100], Boot Barn[100], Argan [100], Encore Wire[100], Core Molding[100], Oscar Health[95], Mercury General[95]
Best Smallcap Stocks Year-to-Date:
CareMax [506.19%], Janux [369.99%], Viking [259.22%], Super Micro[243.41%], Alpine Immune[238.71%], Arcutis Bio[212.38%], Longboard [198.85%], Vera [174.87%], Avidity Biosciences[164.49%], Veritone [140.11%], Stoke [136.88%] Best Smallcap Stocks This Week:
ProKidney [56%], Macatawa Bank[42.54%], Snap One[29.3%], Intra-Cellular Therapies[21.21%], Escalade [15.03%], ALX Oncology[11.51%], Encore Wire[11.12%], Warrior Met[9.13%], Super Micro[8.65%], NextNav [8.1%], Envestnet [7.85%] Best Smallcap Stocks Daily:
Macatawa Bank[37.66%], ProKidney [30.62%], Intra-Cellular Therapies[23.30%], System1 [21.93%], Escalade [16.11%], NextNav [13.54%], ALX Oncology[12.72%], Allbirds [10.78%], Super Micro[10.58%], Mondee [9.57%], Nuvectis Pharma[9.44%]