
 Login Sign Up


| |||||
 |  | ||||

| 12Stocks.com Market Intelligence |
Best SmallCap Stocks
|
| In a hurry? Small Cap Stock Lists: Performance Trends Table, Stock Charts
Sort Small Cap stocks: Daily, Weekly, Year-to-Date, Market Cap & Trends. Filter Small Cap stocks list by sector: Show all, Tech, Finance, Energy, Staples, Retail, Industrial, Materials, Utilities and HealthCare Filter Small Cap stocks list by size: All Large Medium Small and MicroCap |
| 12Stocks.com Small Cap Stocks Performances & Trends Daily | |||||||||
|
|  The overall Smart Investing & Trading Score is 23 (0-bearish to 100-bullish) which puts Small Cap index in short term bearish to neutral trend. The Smart Investing & Trading Score from previous trading session is 13 and hence an improvement of trend.
| ||||||||
Here are the Smart Investing & Trading Scores of the most requested small cap stocks at 12Stocks.com (click stock name for detailed review):
|


| 12Stocks.com: Investing in Smallcap Index with Stocks | |
|
The following table helps investors and traders sort through current performance and trends (as measured by Smart Investing & Trading Score) of various
stocks in the Smallcap Index. Quick View: Move mouse or cursor over stock symbol (ticker) to view short-term technical chart and over stock name to view long term chart. Click on  to add stock symbol to your watchlist and to add stock symbol to your watchlist and  to view watchlist. Click on any ticker or stock name for detailed market intelligence report for that stock. to view watchlist. Click on any ticker or stock name for detailed market intelligence report for that stock. |
12Stocks.com Performance of Stocks in Smallcap Index
| Ticker | Stock Name | Watchlist | Category | Recent Price | Smart Investing & Trading Score | Change % | YTD Change% |
| EGBN | Eagle Bancorp |   | Financials | 20.52 | 27 | 0.47 | -31.90% |
| CTRE | CareTrust REIT | | Financials | 23.63 | 56 | 0.47 | 5.59% |
| WHD | Cactus | | Energy | 49.63 | 46 | 0.47 | 9.32% |
| BARK | BARK | | Services & Goods | 1.08 | 51 | 0.47 | 34.34% |
| SKYT | SkyWater | | Technology | 8.79 | 33 | 0.46 | -8.77% |
| SHAK | Shake Shack | | Services & Goods | 95.35 | 56 | 0.46 | 28.64% |
| JANX | Janux | | Health Care | 48.15 | 51 | 0.46 | 348.12% |
| HASI | Hannon Armstrong | | Financials | 24.51 | 61 | 0.45 | -11.13% |
| IBP | Installed Building | | Industrials | 225.35 | 43 | 0.45 | 23.27% |
| ESNT | Essent Group | | Financials | 52.56 | 17 | 0.44 | -0.34% |
| PETQ | PetIQ | | Health Care | 16.00 | 10 | 0.44 | -18.99% |
| TCBX | Third Coast | | Financials | 18.27 | 22 | 0.44 | -8.70% |
| KNF | Knife River | | Materials | 78.42 | 31 | 0.44 | 17.92% |
| MGEE | MGE Energy | | Utilities | 75.51 | 68 | 0.43 | 4.43% |
| HPP | Hudson Pacific | | Financials | 5.82 | 47 | 0.43 | -37.54% |
| ASIX | AdvanSix | | Materials | 26.81 | 61 | 0.43 | -10.53% |
| ARLO | Arlo | | Technology | 10.57 | 36 | 0.43 | 11.08% |
| FEAM | 5E Advanced | | Materials | 1.18 | 27 | 0.43 | -16.67% |
| WABC | Westamerica Ban | | Financials | 45.69 | 40 | 0.42 | -19.00% |
| MLI | Mueller Industries | | Industrials | 52.19 | 68 | 0.42 | 10.69% |
| EXPO | Exponent | | Services & Goods | 78.06 | 38 | 0.42 | -11.34% |
| PMT | PennyMac Mortgage | | Financials | 13.29 | 25 | 0.42 | -11.14% |
| SHLS | Shoals | | Technology | 8.31 | 17 | 0.42 | -46.35% |
| IVAC | Intevac | | Technology | 3.65 | 35 | 0.41 | -15.63% |
| VBTX | Veritex | | Financials | 19.36 | 45 | 0.41 | -16.80% |


| Too many stocks? View smallcap stocks filtered by marketcap & sector |
| Marketcap: All SmallCap Stocks (default-no microcap), Large, Mid-Range, Small |
| Smallcap Sector: Tech, Finance, Energy, Staples, Retail, Industrial, Materials, & Medical |
|
Get the most comprehensive stock market coverage daily at 12Stocks.com ➞ Best Stocks Today ➞ Best Stocks Weekly ➞ Best Stocks Year-to-Date ➞ Best Stocks Trends ➞  Best Stocks Today 12Stocks.com Best Nasdaq Stocks ➞ Best S&P 500 Stocks ➞ Best Tech Stocks ➞ Best Biotech Stocks ➞ |
| Detailed Overview of SmallCap Stocks |
| SmallCap Technical Overview, Leaders & Laggards, Top SmallCap ETF Funds & Detailed SmallCap Stocks List, Charts, Trends & More |
| Smallcap: Technical Analysis, Trends & YTD Performance | |
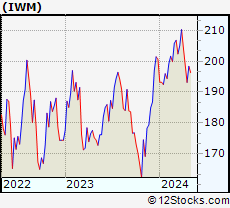
| SmallCap segment as represented by
IWM, an exchange-traded fund [ETF], holds basket of thousands of smallcap stocks from across all major sectors of the US stock market. The smallcap index (contains stocks like Riverbed & Sotheby's) is down by -3.99% and is currently underperforming the overall market by -8.02% year-to-date. Below is a quick view of technical charts and trends: | |
 IWM Weekly Chart |
|
| Long Term Trend: Not Good | |
| Medium Term Trend: Not Good | |
 IWM Daily Chart |
|
| Short Term Trend: Not Good | |
| Overall Trend Score: 23 | |
| YTD Performance: -3.99% | |
| **Trend Scores & Views Are Only For Educational Purposes And Not For Investing | |
| 12Stocks.com: Top Performing Small Cap Index Stocks | ||||||||||||||||||||||||||||||||||||||||||||||||
 The top performing Small Cap Index stocks year to date are
Now, more recently, over last week, the top performing Small Cap Index stocks on the move are


|
||||||||||||||||||||||||||||||||||||||||||||||||
| 12Stocks.com: Investing in Smallcap Index using Exchange Traded Funds | |
|
The following table shows list of key exchange traded funds (ETF) that
help investors track Smallcap index. The following list also includes leveraged ETF funds that track twice or thrice the daily returns of Smallcap indices. Short or inverse ETF funds move in the opposite direction to the index they track and are useful during market pullbacks or during bear markets. Quick View: Move mouse or cursor over ETF symbol (ticker) to view short-term technical chart and over ETF name to view long term chart. Click on ticker or stock name for detailed view. Click on to add stock symbol to your watchlist and to view watchlist. |
12Stocks.com List of ETFs that track Smallcap Index
| Ticker | ETF Name | Watchlist | Recent Price | Smart Investing & Trading Score | Change % | Week % | Year-to-date % |
| IWM | iShares Russell 2000 | | 192.71 | 23 | -0.15 | -3.01 | -3.99% |
| IJR | iShares Core S&P Small-Cap | | 102.18 | 31 | 0.05 | -2.23 | -5.61% |
| VTWO | Vanguard Russell 2000 ETF | | 77.90 | 23 | -0.19 | -3.01 | -3.95% |
| IWN | iShares Russell 2000 Value | | 146.15 | 10 | 0.08 | -2.81 | -5.91% |
| IWO | iShares Russell 2000 Growth | | 247.09 | 36 | -0.37 | -3.24 | -2.03% |
| IJS | iShares S&P Small-Cap 600 Value | | 94.40 | 10 | 0.30 | -1.84 | -8.41% |
| IJT | iShares S&P Small-Cap 600 Growth | | 122.58 | 23 | 0.61 | -1.76 | -2.05% |
| XSLV | PowerShares S&P SmallCap Low Volatil ETF | | 41.62 | 25 | 0.48 | -1.12 | -5.73% |
| SAA | ProShares Ultra SmallCap600 | | 21.71 | 10 | 0.25 | -3.75 | -12.97% |
| SMLV | SPDR SSGA US Small Cap Low Volatil ETF | | 104.02 | 18 | 0.34 | -0.95 | -7.56% |
| SBB | ProShares Short SmallCap600 | | 16.89 | 80 | 0.24 | 2.07 | 6.03% |
| SDD | ProShares UltraShort SmallCap600 | | 20.23 | 73 | -1.80 | 2.01 | 9.79% |
| 12Stocks.com: Charts, Trends, Fundamental Data and Performances of SmallCap Stocks | |
|
We now take in-depth look at all SmallCap stocks including charts, multi-period performances and overall trends (as measured by Smart Investing & Trading Score). One can sort SmallCap stocks (click link to choose) by Daily, Weekly and by Year-to-Date performances. Also, one can sort by size of the company or by market capitalization. |
| Select Your Default Chart Type: | |||||
| |||||
| Click on stock symbol or name for detailed view. Click on to add stock symbol to your watchlist and to view watchlist. Quick View: Move mouse or cursor over "Daily" to quickly view daily technical stock chart and over "Weekly" to view weekly technical stock chart. | |||||

 | EGBN Eagle Bancorp, Inc. |
| Sector: Financials | |
| SubSector: Regional - Mid-Atlantic Banks | |
| MarketCap: 906.559 Millions | |
| Recent Price: 20.52 Smart Investing & Trading Score: 27 | |
| Day Percent Change: 0.47% Day Change: 0.09 | |
| Week Change: -3.77% Year-to-date Change: -31.9% | |
| EGBN Links: Profile News Message Board | |
| Charts:- Daily , Weekly | |
| Add EGBN to Watchlist: View: Get Complete EGBN Trend Analysis ➞ | |
 | CTRE CareTrust REIT, Inc. |
| Sector: Financials | |
| SubSector: REIT - Healthcare Facilities | |
| MarketCap: 1507.94 Millions | |
| Recent Price: 23.63 Smart Investing & Trading Score: 56 | |
| Day Percent Change: 0.47% Day Change: 0.11 | |
| Week Change: -0.13% Year-to-date Change: 5.6% | |
| CTRE Links: Profile News Message Board | |
| Charts:- Daily , Weekly | |
| Add CTRE to Watchlist: View: Get Complete CTRE Trend Analysis ➞ | |
 | WHD Cactus, Inc. |
| Sector: Energy | |
| SubSector: Oil & Gas Equipment & Services | |
| MarketCap: 920.261 Millions | |
| Recent Price: 49.63 Smart Investing & Trading Score: 46 | |
| Day Percent Change: 0.47% Day Change: 0.23 | |
| Week Change: -2.55% Year-to-date Change: 9.3% | |
| WHD Links: Profile News Message Board | |
| Charts:- Daily , Weekly | |
| Add WHD to Watchlist: View: Get Complete WHD Trend Analysis ➞ | |
 | BARK BARK, Inc. |
| Sector: Services & Goods | |
| SubSector: Specialty Retail | |
| MarketCap: 234 Millions | |
| Recent Price: 1.08 Smart Investing & Trading Score: 51 | |
| Day Percent Change: 0.47% Day Change: 0.00 | |
| Week Change: -2.27% Year-to-date Change: 34.3% | |
| BARK Links: Profile News Message Board | |
| Charts:- Daily , Weekly | |
| Add BARK to Watchlist: View: Get Complete BARK Trend Analysis ➞ | |
 | SKYT SkyWater Technology, Inc. |
| Sector: Technology | |
| SubSector: Semiconductors | |
| MarketCap: 394 Millions | |
| Recent Price: 8.79 Smart Investing & Trading Score: 33 | |
| Day Percent Change: 0.46% Day Change: 0.04 | |
| Week Change: -9.79% Year-to-date Change: -8.8% | |
| SKYT Links: Profile News Message Board | |
| Charts:- Daily , Weekly | |
| Add SKYT to Watchlist: View: Get Complete SKYT Trend Analysis ➞ | |
 | SHAK Shake Shack Inc. |
| Sector: Services & Goods | |
| SubSector: Specialty Eateries | |
| MarketCap: 1497.67 Millions | |
| Recent Price: 95.35 Smart Investing & Trading Score: 56 | |
| Day Percent Change: 0.46% Day Change: 0.44 | |
| Week Change: -1.91% Year-to-date Change: 28.6% | |
| SHAK Links: Profile News Message Board | |
| Charts:- Daily , Weekly | |
| Add SHAK to Watchlist: View: Get Complete SHAK Trend Analysis ➞ | |
 | JANX Janux Therapeutics, Inc. |
| Sector: Health Care | |
| SubSector: Biotechnology | |
| MarketCap: 496 Millions | |
| Recent Price: 48.15 Smart Investing & Trading Score: 51 | |
| Day Percent Change: 0.46% Day Change: 0.22 | |
| Week Change: -8.55% Year-to-date Change: 348.1% | |
| JANX Links: Profile News Message Board | |
| Charts:- Daily , Weekly | |
| Add JANX to Watchlist: View: Get Complete JANX Trend Analysis ➞ | |
 | HASI Hannon Armstrong Sustainable Infrastructure Capital, Inc. |
| Sector: Financials | |
| SubSector: REIT - Diversified | |
| MarketCap: 1405.93 Millions | |
| Recent Price: 24.51 Smart Investing & Trading Score: 61 | |
| Day Percent Change: 0.45% Day Change: 0.11 | |
| Week Change: -4.41% Year-to-date Change: -11.1% | |
| HASI Links: Profile News Message Board | |
| Charts:- Daily , Weekly | |
| Add HASI to Watchlist: View: Get Complete HASI Trend Analysis ➞ | |
 | IBP Installed Building Products, Inc. |
| Sector: Industrials | |
| SubSector: General Building Materials | |
| MarketCap: 1284.23 Millions | |
| Recent Price: 225.35 Smart Investing & Trading Score: 43 | |
| Day Percent Change: 0.45% Day Change: 1.00 | |
| Week Change: -6.4% Year-to-date Change: 23.3% | |
| IBP Links: Profile News Message Board | |
| Charts:- Daily , Weekly | |
| Add IBP to Watchlist: View: Get Complete IBP Trend Analysis ➞ | |
 | ESNT Essent Group Ltd. |
| Sector: Financials | |
| SubSector: Mortgage Investment | |
| MarketCap: 2806.19 Millions | |
| Recent Price: 52.56 Smart Investing & Trading Score: 17 | |
| Day Percent Change: 0.44% Day Change: 0.23 | |
| Week Change: -2.05% Year-to-date Change: -0.3% | |
| ESNT Links: Profile News Message Board | |
| Charts:- Daily , Weekly | |
| Add ESNT to Watchlist: View: Get Complete ESNT Trend Analysis ➞ | |
 | PETQ PetIQ, Inc. |
| Sector: Health Care | |
| SubSector: Drugs - Generic | |
| MarketCap: 587.585 Millions | |
| Recent Price: 16.00 Smart Investing & Trading Score: 10 | |
| Day Percent Change: 0.44% Day Change: 0.07 | |
| Week Change: -2.79% Year-to-date Change: -19.0% | |
| PETQ Links: Profile News Message Board | |
| Charts:- Daily , Weekly | |
| Add PETQ to Watchlist: View: Get Complete PETQ Trend Analysis ➞ | |
 | TCBX Third Coast Bancshares, Inc. |
| Sector: Financials | |
| SubSector: Banks - Regional | |
| MarketCap: 212 Millions | |
| Recent Price: 18.27 Smart Investing & Trading Score: 22 | |
| Day Percent Change: 0.44% Day Change: 0.08 | |
| Week Change: -1.24% Year-to-date Change: -8.7% | |
| TCBX Links: Profile News Message Board | |
| Charts:- Daily , Weekly | |
| Add TCBX to Watchlist: View: Get Complete TCBX Trend Analysis ➞ | |
 | KNF Knife River Corporation |
| Sector: Materials | |
| SubSector: Building Materials | |
| MarketCap: 2570 Millions | |
| Recent Price: 78.42 Smart Investing & Trading Score: 31 | |
| Day Percent Change: 0.44% Day Change: 0.34 | |
| Week Change: -3.72% Year-to-date Change: 17.9% | |
| KNF Links: Profile News Message Board | |
| Charts:- Daily , Weekly | |
| Add KNF to Watchlist: View: Get Complete KNF Trend Analysis ➞ | |
 | MGEE MGE Energy, Inc. |
| Sector: Utilities | |
| SubSector: Diversified Utilities | |
| MarketCap: 2608.3 Millions | |
| Recent Price: 75.51 Smart Investing & Trading Score: 68 | |
| Day Percent Change: 0.43% Day Change: 0.32 | |
| Week Change: 0.67% Year-to-date Change: 4.4% | |
| MGEE Links: Profile News Message Board | |
| Charts:- Daily , Weekly | |
| Add MGEE to Watchlist: View: Get Complete MGEE Trend Analysis ➞ | |
 | HPP Hudson Pacific Properties, Inc. |
| Sector: Financials | |
| SubSector: REIT - Office | |
| MarketCap: 3267.16 Millions | |
| Recent Price: 5.82 Smart Investing & Trading Score: 47 | |
| Day Percent Change: 0.43% Day Change: 0.03 | |
| Week Change: -4.98% Year-to-date Change: -37.5% | |
| HPP Links: Profile News Message Board | |
| Charts:- Daily , Weekly | |
| Add HPP to Watchlist: View: Get Complete HPP Trend Analysis ➞ | |
 | ASIX AdvanSix Inc. |
| Sector: Materials | |
| SubSector: Chemicals - Major Diversified | |
| MarketCap: 394.136 Millions | |
| Recent Price: 26.81 Smart Investing & Trading Score: 61 | |
| Day Percent Change: 0.43% Day Change: 0.11 | |
| Week Change: -2.39% Year-to-date Change: -10.5% | |
| ASIX Links: Profile News Message Board | |
| Charts:- Daily , Weekly | |
| Add ASIX to Watchlist: View: Get Complete ASIX Trend Analysis ➞ | |
 | ARLO Arlo Technologies, Inc. |
| Sector: Technology | |
| SubSector: Security Software & Services | |
| MarketCap: 163.317 Millions | |
| Recent Price: 10.57 Smart Investing & Trading Score: 36 | |
| Day Percent Change: 0.43% Day Change: 0.04 | |
| Week Change: -6.5% Year-to-date Change: 11.1% | |
| ARLO Links: Profile News Message Board | |
| Charts:- Daily , Weekly | |
| Add ARLO to Watchlist: View: Get Complete ARLO Trend Analysis ➞ | |
 | FEAM 5E Advanced Materials Inc. |
| Sector: Materials | |
| SubSector: Specialty Chemicals | |
| MarketCap: 247 Millions | |
| Recent Price: 1.18 Smart Investing & Trading Score: 27 | |
| Day Percent Change: 0.43% Day Change: 0.01 | |
| Week Change: -6.75% Year-to-date Change: -16.7% | |
| FEAM Links: Profile News Message Board | |
| Charts:- Daily , Weekly | |
| Add FEAM to Watchlist: View: Get Complete FEAM Trend Analysis ➞ | |
 | WABC Westamerica Bancorporation |
| Sector: Financials | |
| SubSector: Regional - Pacific Banks | |
| MarketCap: 1557.69 Millions | |
| Recent Price: 45.69 Smart Investing & Trading Score: 40 | |
| Day Percent Change: 0.42% Day Change: 0.19 | |
| Week Change: -1.99% Year-to-date Change: -19.0% | |
| WABC Links: Profile News Message Board | |
| Charts:- Daily , Weekly | |
| Add WABC to Watchlist: View: Get Complete WABC Trend Analysis ➞ | |
 | MLI Mueller Industries, Inc. |
| Sector: Industrials | |
| SubSector: Metal Fabrication | |
| MarketCap: 1259.5 Millions | |
| Recent Price: 52.19 Smart Investing & Trading Score: 68 | |
| Day Percent Change: 0.42% Day Change: 0.22 | |
| Week Change: 0.91% Year-to-date Change: 10.7% | |
| MLI Links: Profile News Message Board | |
| Charts:- Daily , Weekly | |
| Add MLI to Watchlist: View: Get Complete MLI Trend Analysis ➞ | |
 | EXPO Exponent, Inc. |
| Sector: Services & Goods | |
| SubSector: Management Services | |
| MarketCap: 3605.95 Millions | |
| Recent Price: 78.06 Smart Investing & Trading Score: 38 | |
| Day Percent Change: 0.42% Day Change: 0.33 | |
| Week Change: -2.27% Year-to-date Change: -11.3% | |
| EXPO Links: Profile News Message Board | |
| Charts:- Daily , Weekly | |
| Add EXPO to Watchlist: View: Get Complete EXPO Trend Analysis ➞ | |
 | PMT PennyMac Mortgage Investment Trust |
| Sector: Financials | |
| SubSector: Mortgage Investment | |
| MarketCap: 917.639 Millions | |
| Recent Price: 13.29 Smart Investing & Trading Score: 25 | |
| Day Percent Change: 0.42% Day Change: 0.05 | |
| Week Change: -1.96% Year-to-date Change: -11.1% | |
| PMT Links: Profile News Message Board | |
| Charts:- Daily , Weekly | |
| Add PMT to Watchlist: View: Get Complete PMT Trend Analysis ➞ | |
 | SHLS Shoals Technologies Group, Inc. |
| Sector: Technology | |
| SubSector: Solar | |
| MarketCap: 4360 Millions | |
| Recent Price: 8.31 Smart Investing & Trading Score: 17 | |
| Day Percent Change: 0.42% Day Change: 0.04 | |
| Week Change: -9.32% Year-to-date Change: -46.4% | |
| SHLS Links: Profile News Message Board | |
| Charts:- Daily , Weekly | |
| Add SHLS to Watchlist: View: Get Complete SHLS Trend Analysis ➞ | |
 | IVAC Intevac, Inc. |
| Sector: Technology | |
| SubSector: Diversified Electronics | |
| MarketCap: 89.2396 Millions | |
| Recent Price: 3.65 Smart Investing & Trading Score: 35 | |
| Day Percent Change: 0.41% Day Change: 0.02 | |
| Week Change: -3.57% Year-to-date Change: -15.6% | |
| IVAC Links: Profile News Message Board | |
| Charts:- Daily , Weekly | |
| Add IVAC to Watchlist: View: Get Complete IVAC Trend Analysis ➞ | |
 | VBTX Veritex Holdings, Inc. |
| Sector: Financials | |
| SubSector: Regional - Southwest Banks | |
| MarketCap: 625.165 Millions | |
| Recent Price: 19.36 Smart Investing & Trading Score: 45 | |
| Day Percent Change: 0.41% Day Change: 0.08 | |
| Week Change: -0.82% Year-to-date Change: -16.8% | |
| VBTX Links: Profile News Message Board | |
| Charts:- Daily , Weekly | |
| Add VBTX to Watchlist: View: Get Complete VBTX Trend Analysis ➞ | |
| Too many stocks? View smallcap stocks filtered by marketcap & sector |
| Marketcap: All SmallCap Stocks (default-no microcap), Large, Mid-Range, Small & MicroCap |
| Sector: Tech, Finance, Energy, Staples, Retail, Industrial, Materials, Utilities & Medical |
|
Best Stocks Today 12Stocks.com |
© 2024 12Stocks.com Terms & Conditions Privacy Contact Us
All Information Provided Only For Education And Not To Be Used For Investing or Trading. See Terms & Conditions


One More Thing ... Get Best Stocks Delivered Daily!
Never Ever Miss A Move With Our Top Ten Stocks Lists
Find Best Stocks In Any Market - Bull or Bear Market
Take A Peek At Our Top Ten Stocks Lists: Daily, Weekly, Year-to-Date & Top Trends
Find Best Stocks In Any Market - Bull or Bear Market
Take A Peek At Our Top Ten Stocks Lists: Daily, Weekly, Year-to-Date & Top Trends
Smallcap Stocks With Best Up Trends [0-bearish to 100-bullish]: Badger Meter[100], Cullinan Oncology[100], Oscar Health[100], NextNav [100], Geron [100], Richardson Electronics[100], Seneca Foods[100], Lantheus [100], Macatawa Bank[100], Regional Management[100], IMAX [100]
Best Smallcap Stocks Year-to-Date:
Agenus [511.18%], CareMax [417.53%], Janux [348.12%], Viking [248.9%], Alpine Immune[238.6%], Super Micro[230.42%], Arcutis Bio[203.72%], Longboard [184.12%], Vera [161.3%], Avidity Biosciences[159.18%], Hippo [128.32%] Best Smallcap Stocks This Week:
Macatawa Bank[44.47%], 23andMe Holding[33.3%], ProKidney [32%], Snap One[29.73%], Vertex Energy[23.08%], ALX Oncology[22.79%], Vanda [20.63%], Expensify [18.37%], Badger Meter[15.7%], Cullinan Oncology[13.89%], Humacyte [12.67%] Best Smallcap Stocks Daily:
23andMe Holding[65.91%], Vertex Energy[30.72%], Badger Meter[15.63%], Expensify [15.23%], Zura Bio[10.99%], Vaxxinity [10.05%], Vuzix [9.87%], Montrose Environmental[8.91%], Cipher Mining[8.65%], FiscalNote [8.61%], Barnes Group[8.48%]