
 Login Sign Up


| |||||
 |  | ||||

| 12Stocks.com Market Intelligence |
Best S&P 500 Stocks
|
On this page, you will find the most comprehensive analysis of S&P 500 stocks and ETFs - from latest trends to performances to charts ➞. First, here are the year-to-date (YTD) performances of the most requested S&P 500 stocks at 12Stocks.com (click stock for review):
| NVIDIA 79% | ||
| Amazon.com 23% | ||
| Google 20% | ||
| Merck 17% | ||
| Caterpillar 14% | ||
| Walmart 14% | ||
| Goldman Sachs 14% | ||
| JPMorgan Chase 12% | ||
| Microsoft 8% | ||
| Chevron 7% | ||
| Apple -5% | ||
| Johnson & Johnson -5% | ||
| McDonald s -9% | ||
| Gilead -20% | ||
| Starbucks -24% | ||
| Boeing -31% | ||
| Intel -39% | ||
| Quick: S&P 500 Stocks Lists: Performances & Trends, S&P 500 Stock Charts
Sort S&P 500 stocks: Daily, Weekly, Year-to-Date, Market Cap & Trends. Filter S&P 500 stocks list by sector: Show all, Tech, Finance, Energy, Staples, Retail, Industrial, Materials, Utilities and HealthCare |
| 12Stocks.com S&P 500 Stocks Performances & Trends Daily Report | |||||||||
|
| 
The overall Smart Investing & Trading Score is 60 (0-bearish to 100-bullish) which puts S&P 500 index in short term neutral to bullish trend. The Smart Investing & Trading Score from previous trading session is 30 and hence an improvement of trend. | ||||||||
Here are the Smart Investing & Trading Scores of the most requested S&P 500 stocks at 12Stocks.com (click stock name for detailed review):
|


| 12Stocks.com: Top Performing S&P 500 Index Stocks | ||||||||||||||||||||||||||||||||||||||||||||||||
 The top performing S&P 500 Index stocks year to date are
Now, more recently, over last week, the top performing S&P 500 Index stocks on the move are


|
||||||||||||||||||||||||||||||||||||||||||||||||
| 12Stocks.com: Investing in S&P 500 Index with Stocks | |
|
The following table helps investors and traders sort through current performance and trends (as measured by Smart Investing & Trading Score) of various
stocks in the S&P 500 Index. Quick View: Move mouse or cursor over stock symbol (ticker) to view short-term technical chart and over stock name to view long term chart. Click on  to add stock symbol to your watchlist and to add stock symbol to your watchlist and  to view watchlist. Click on any ticker or stock name for detailed market intelligence report for that stock. to view watchlist. Click on any ticker or stock name for detailed market intelligence report for that stock. |
12Stocks.com Performance of Stocks in S&P 500 Index
| Ticker | Stock Name | Watchlist | Category | Recent Price | Smart Investing & Trading Score | Change % | YTD Change% |
| SCHW | Charles Schwab |   | Financials | 76.04 | 100 | 0.94% | 10.52% |
| CTRA | Contura | | Materials | 28.19 | 83 | 3.79% | 10.46% |
| AMP | Ameriprise Financial | | Financials | 418.95 | 73 | 0.59% | 10.30% |
| MKC | McCormick & | | Consumer Staples | 75.45 | 65 | 0.41% | 10.27% |
| HES | Hess | | Energy | 158.86 | 78 | 0.19% | 10.20% |
| UHS | Universal Health | | Health Care | 167.70 | 35 | -1.29% | 10.01% |
| OKE | ONEOK | | Utilities | 77.23 | 26 | 0.36% | 9.98% |
| CB | Chubb | | Financials | 248.54 | 23 | -0.68% | 9.97% |
| ORCL | Oracle | | Technology | 115.80 | 58 | 0.73% | 9.84% |
| L | Loews | | Financials | 76.40 | 71 | -0.17% | 9.79% |
| SYK | Stryker | | Health Care | 328.45 | 17 | 0.56% | 9.68% |
| AVY | Avery Dennison | | Consumer Staples | 221.55 | 95 | 0.93% | 9.59% |
| HRL | Hormel Foods | | Consumer Staples | 35.17 | 45 | -0.71% | 9.53% |
| BK | Bank of New York | | Financials | 57.00 | 78 | 0.71% | 9.51% |
| PNR | Pentair | | Industrials | 79.61 | 51 | 0.96% | 9.49% |
| EMR | Emerson Electric | | Industrials | 106.54 | 23 | 0.12% | 9.46% |
| D | Dominion | | Utilities | 51.40 | 83 | 0.47% | 9.36% |
| DLR | Digital Realty | | Financials | 147.00 | 82 | 4.89% | 9.23% |
| AEP | American Electric | | Utilities | 88.60 | 95 | 0.40% | 9.09% |
| MRO | Marathon Oil | | Energy | 26.34 | 46 | 0.96% | 9.02% |
| REGN | Regeneron | | Health Care | 957.00 | 69 | 2.07% | 8.96% |
| FITB | Fifth Third | | Financials | 37.56 | 100 | 1.82% | 8.90% |
| COF | Capital One | | Financials | 142.41 | 49 | 0.42% | 8.61% |
| EMN | Eastman Chemical | | Materials | 97.50 | 83 | 1.65% | 8.55% |
| HBAN | Huntington Bancshares | | Financials | 13.80 | 100 | 0.95% | 8.49% |
| For chart view version of above stock list: Chart View ➞ 0 - 25 , 25 - 50 , 50 - 75 , 75 - 100 , 100 - 125 , 125 - 150 , 150 - 175 , 175 - 200 , 200 - 225 , 225 - 250 , 250 - 275 , 275 - 300 , 300 - 325 , 325 - 350 , 350 - 375 , 375 - 400 , 400 - 425 , 425 - 450 , 450 - 475 , 475 - 500 | ||
 | Click To Change The Sort Order: By Market Cap or Company Size Performance: Year-to-date, Week and Day |  |
|
Get the most comprehensive stock market coverage daily at 12Stocks.com ➞ Best Stocks Today ➞ Best Stocks Weekly ➞ Best Stocks Year-to-Date ➞ Best Stocks Trends ➞  Best Stocks Today 12Stocks.com Best Nasdaq Stocks ➞ Best S&P 500 Stocks ➞ Best Tech Stocks ➞ Best Biotech Stocks ➞ |
| Detailed Overview of S&P 500 Stocks |
| S&P 500 Technical Overview, Leaders & Laggards, Top S&P 500 ETF Funds & Detailed S&P 500 Stocks List, Charts, Trends & More |
| S&P 500: Technical Analysis, Trends & YTD Performance | |
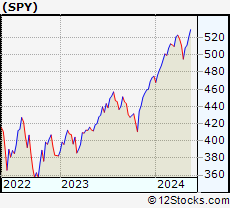
| S&P 500 index as represented by
SPY, an exchange-traded fund [ETF], holds basket of five hundred (mostly largecap) stocks from across all major sectors of the US stock market. The S&P 500 index (contains stocks like Apple and Exxon) is up by 7.57% and is currently outperforming the overall market by 0.69% year-to-date. Below is a quick view of technical charts and trends: | |
 SPY Weekly Chart |
|
| Long Term Trend: Good | |
| Medium Term Trend: Good | |
 SPY Daily Chart |
|
| Short Term Trend: Very Good | |
| Overall Trend Score: 60 | |
| YTD Performance: 7.57% | |
| **Trend Scores & Views Are Only For Educational Purposes And Not For Investing | |
| 12Stocks.com: Investing in S&P 500 Index using Exchange Traded Funds | |
|
The following table shows list of key exchange traded funds (ETF) that
help investors track S&P 500 index. The following list also includes leveraged ETF funds that track twice or thrice the daily returns of S&P 500 indices. Short or inverse ETF funds move in the opposite direction to the index they track and are useful during market pullbacks or during bear markets. Quick View: Move mouse or cursor over ETF symbol (ticker) to view short-term technical chart and over ETF name to view long term chart. Click on ticker or stock name for detailed view. Click on to add stock symbol to your watchlist and to view watchlist. |
12Stocks.com List of ETFs that track S&P 500 Index
| Ticker | ETF Name | Watchlist | Recent Price | Smart Investing & Trading Score | Change % | Week % | Year-to-date % |
| SPY | SPDR S&P 500 ETF | | 511.29 | 60 | 1.24 | 0.6 | 7.57% |
| IVV | iShares Core S&P 500 ETF | | 513.84 | 60 | 1.26 | 0.6 | 7.58% |
| VOO | Vanguard 500 ETF | | 469.98 | 60 | 1.24 | 0.59 | 7.6% |
| OEF | iShares S&P 100 | | 243.74 | 83 | 1.46 | 0.9 | 9.11% |
| SSO | ProShares Ultra S&P500 | | 73.46 | 60 | 2.51 | 1.03 | 12.89% |
| UPRO | ProShares UltraPro S&P500 | | 64.69 | 52 | 3.72 | 1.36 | 18.18% |
| SPXL | Direxion Daily S&P500 Bull 3X ETF | | 122.86 | 52 | 3.73 | 1.42 | 18.15% |
| SH | ProShares Short S&P500 | | 12.23 | 41 | -1.21 | -0.41 | -5.85% |
| SDS | ProShares UltraShort S&P500 | | 26.25 | 28 | -2.42 | -1.06 | -12.27% |
| SPXU | ProShares UltraPro Short S&P500 | | 34.89 | 23 | -3.78 | -1.72 | -18.86% |
| SPXS | Direxion Daily S&P 500 Bear 3X ETF | | 9.46 | 23 | -3.57 | -1.56 | -18.1% |
| 12Stocks.com: Charts, Trends, Fundamental Data and Performances of S&P 500 Stocks | |
|
We now take in-depth look at all S&P 500 stocks including charts, multi-period performances and overall trends (as measured by Smart Investing & Trading Score). One can sort S&P 500 stocks (click link to choose) by Daily, Weekly and by Year-to-Date performances. Also, one can sort by size of the company or by market capitalization. |
| Select Your Default Chart Type: | |||||
| |||||
| Click on stock symbol or name for detailed view. Click on to add stock symbol to your watchlist and to view watchlist. Quick View: Move mouse or cursor over "Daily" to quickly view daily technical stock chart and over "Weekly" to view weekly technical stock chart. | |||||

 | SCHW The Charles Schwab Corporation |
| Sector: Financials | |
| SubSector: Investment Brokerage - National | |
| MarketCap: 45115.8 Millions | |
| Recent Price: 76.04 Smart Investing & Trading Score: 100 | |
| Day Percent Change: 0.94% Day Change: 0.71 | |
| Week Change: 1.4% Year-to-date Change: 10.5% | |
| SCHW Links: Profile News Message Board | |
| Charts:- Daily , Weekly | |
| Add SCHW to Watchlist: View: Get SCHW Trend Analysis ➞ | |
 | CTRA Contura Energy, Inc. |
| Sector: Materials | |
| SubSector: Industrial Metals & Minerals | |
| MarketCap: 75.291 Millions | |
| Recent Price: 28.19 Smart Investing & Trading Score: 83 | |
| Day Percent Change: 3.79% Day Change: 1.03 | |
| Week Change: -0.35% Year-to-date Change: 10.5% | |
| CTRA Links: Profile News Message Board | |
| Charts:- Daily , Weekly | |
| Add CTRA to Watchlist: View: Get CTRA Trend Analysis ➞ | |
 | AMP Ameriprise Financial, Inc. |
| Sector: Financials | |
| SubSector: Asset Management | |
| MarketCap: 13270.5 Millions | |
| Recent Price: 418.95 Smart Investing & Trading Score: 73 | |
| Day Percent Change: 0.59% Day Change: 2.47 | |
| Week Change: 2.18% Year-to-date Change: 10.3% | |
| AMP Links: Profile News Message Board | |
| Charts:- Daily , Weekly | |
| Add AMP to Watchlist: View: Get AMP Trend Analysis ➞ | |
 | MKC McCormick & Company, Incorporated |
| Sector: Consumer Staples | |
| SubSector: Processed & Packaged Goods | |
| MarketCap: 18522.8 Millions | |
| Recent Price: 75.45 Smart Investing & Trading Score: 65 | |
| Day Percent Change: 0.41% Day Change: 0.31 | |
| Week Change: -0.37% Year-to-date Change: 10.3% | |
| MKC Links: Profile News Message Board | |
| Charts:- Daily , Weekly | |
| Add MKC to Watchlist: View: Get MKC Trend Analysis ➞ | |
 | HES Hess Corporation |
| Sector: Energy | |
| SubSector: Independent Oil & Gas | |
| MarketCap: 10465.3 Millions | |
| Recent Price: 158.86 Smart Investing & Trading Score: 78 | |
| Day Percent Change: 0.19% Day Change: 0.30 | |
| Week Change: -2.26% Year-to-date Change: 10.2% | |
| HES Links: Profile News Message Board | |
| Charts:- Daily , Weekly | |
| Add HES to Watchlist: View: Get HES Trend Analysis ➞ | |
 | UHS Universal Health Services, Inc. |
| Sector: Health Care | |
| SubSector: Hospitals | |
| MarketCap: 7217.66 Millions | |
| Recent Price: 167.70 Smart Investing & Trading Score: 35 | |
| Day Percent Change: -1.29% Day Change: -2.19 | |
| Week Change: 0.99% Year-to-date Change: 10.0% | |
| UHS Links: Profile News Message Board | |
| Charts:- Daily , Weekly | |
| Add UHS to Watchlist: View: Get UHS Trend Analysis ➞ | |
 | OKE ONEOK, Inc. |
| Sector: Utilities | |
| SubSector: Gas Utilities | |
| MarketCap: 10788.7 Millions | |
| Recent Price: 77.23 Smart Investing & Trading Score: 26 | |
| Day Percent Change: 0.36% Day Change: 0.28 | |
| Week Change: -4.72% Year-to-date Change: 10.0% | |
| OKE Links: Profile News Message Board | |
| Charts:- Daily , Weekly | |
| Add OKE to Watchlist: View: Get OKE Trend Analysis ➞ | |
 | CB Chubb Limited |
| Sector: Financials | |
| SubSector: Property & Casualty Insurance | |
| MarketCap: 51615.9 Millions | |
| Recent Price: 248.54 Smart Investing & Trading Score: 23 | |
| Day Percent Change: -0.68% Day Change: -1.71 | |
| Week Change: 1.26% Year-to-date Change: 10.0% | |
| CB Links: Profile News Message Board | |
| Charts:- Daily , Weekly | |
| Add CB to Watchlist: View: Get CB Trend Analysis ➞ | |
 | ORCL Oracle Corporation |
| Sector: Technology | |
| SubSector: Application Software | |
| MarketCap: 164530 Millions | |
| Recent Price: 115.80 Smart Investing & Trading Score: 58 | |
| Day Percent Change: 0.73% Day Change: 0.84 | |
| Week Change: -1.2% Year-to-date Change: 9.8% | |
| ORCL Links: Profile News Message Board | |
| Charts:- Daily , Weekly | |
| Add ORCL to Watchlist: View: Get ORCL Trend Analysis ➞ | |
 | L Loews Corporation |
| Sector: Financials | |
| SubSector: Property & Casualty Insurance | |
| MarketCap: 10768.2 Millions | |
| Recent Price: 76.40 Smart Investing & Trading Score: 71 | |
| Day Percent Change: -0.17% Day Change: -0.13 | |
| Week Change: 1.25% Year-to-date Change: 9.8% | |
| L Links: Profile News Message Board | |
| Charts:- Daily , Weekly | |
| Add L to Watchlist: View: Get L Trend Analysis ➞ | |
 | SYK Stryker Corporation |
| Sector: Health Care | |
| SubSector: Medical Appliances & Equipment | |
| MarketCap: 59441.3 Millions | |
| Recent Price: 328.45 Smart Investing & Trading Score: 17 | |
| Day Percent Change: 0.56% Day Change: 1.82 | |
| Week Change: -2.13% Year-to-date Change: 9.7% | |
| SYK Links: Profile News Message Board | |
| Charts:- Daily , Weekly | |
| Add SYK to Watchlist: View: Get SYK Trend Analysis ➞ | |
 | AVY Avery Dennison Corporation |
| Sector: Consumer Staples | |
| SubSector: Business Equipment | |
| MarketCap: 8051.27 Millions | |
| Recent Price: 221.55 Smart Investing & Trading Score: 95 | |
| Day Percent Change: 0.93% Day Change: 2.04 | |
| Week Change: 1.15% Year-to-date Change: 9.6% | |
| AVY Links: Profile News Message Board | |
| Charts:- Daily , Weekly | |
| Add AVY to Watchlist: View: Get AVY Trend Analysis ➞ | |
 | HRL Hormel Foods Corporation |
| Sector: Consumer Staples | |
| SubSector: Meat Products | |
| MarketCap: 25590.2 Millions | |
| Recent Price: 35.17 Smart Investing & Trading Score: 45 | |
| Day Percent Change: -0.71% Day Change: -0.25 | |
| Week Change: -0.42% Year-to-date Change: 9.5% | |
| HRL Links: Profile News Message Board | |
| Charts:- Daily , Weekly | |
| Add HRL to Watchlist: View: Get HRL Trend Analysis ➞ | |
 | BK The Bank of New York Mellon Corporation |
| Sector: Financials | |
| SubSector: Asset Management | |
| MarketCap: 29807.5 Millions | |
| Recent Price: 57.00 Smart Investing & Trading Score: 78 | |
| Day Percent Change: 0.71% Day Change: 0.40 | |
| Week Change: -0.56% Year-to-date Change: 9.5% | |
| BK Links: Profile News Message Board | |
| Charts:- Daily , Weekly | |
| Add BK to Watchlist: View: Get BK Trend Analysis ➞ | |
 | PNR Pentair plc |
| Sector: Industrials | |
| SubSector: Industrial Equipment & Components | |
| MarketCap: 4326.59 Millions | |
| Recent Price: 79.61 Smart Investing & Trading Score: 51 | |
| Day Percent Change: 0.96% Day Change: 0.76 | |
| Week Change: -0.44% Year-to-date Change: 9.5% | |
| PNR Links: Profile News Message Board | |
| Charts:- Daily , Weekly | |
| Add PNR to Watchlist: View: Get PNR Trend Analysis ➞ | |
 | EMR Emerson Electric Co. |
| Sector: Industrials | |
| SubSector: Industrial Electrical Equipment | |
| MarketCap: 30457.9 Millions | |
| Recent Price: 106.54 Smart Investing & Trading Score: 23 | |
| Day Percent Change: 0.12% Day Change: 0.13 | |
| Week Change: -3.05% Year-to-date Change: 9.5% | |
| EMR Links: Profile News Message Board | |
| Charts:- Daily , Weekly | |
| Add EMR to Watchlist: View: Get EMR Trend Analysis ➞ | |
 | D Dominion Energy, Inc. |
| Sector: Utilities | |
| SubSector: Electric Utilities | |
| MarketCap: 62365.3 Millions | |
| Recent Price: 51.40 Smart Investing & Trading Score: 83 | |
| Day Percent Change: 0.47% Day Change: 0.24 | |
| Week Change: 1.88% Year-to-date Change: 9.4% | |
| D Links: Profile News Message Board | |
| Charts:- Daily , Weekly | |
| Add D to Watchlist: View: Get D Trend Analysis ➞ | |
 | DLR Digital Realty Trust, Inc. |
| Sector: Financials | |
| SubSector: REIT - Office | |
| MarketCap: 27038.6 Millions | |
| Recent Price: 147.00 Smart Investing & Trading Score: 82 | |
| Day Percent Change: 4.89% Day Change: 6.85 | |
| Week Change: 2.92% Year-to-date Change: 9.2% | |
| DLR Links: Profile News Message Board | |
| Charts:- Daily , Weekly | |
| Add DLR to Watchlist: View: Get DLR Trend Analysis ➞ | |
 | AEP American Electric Power Company, Inc. |
| Sector: Utilities | |
| SubSector: Electric Utilities | |
| MarketCap: 38380 Millions | |
| Recent Price: 88.60 Smart Investing & Trading Score: 95 | |
| Day Percent Change: 0.40% Day Change: 0.35 | |
| Week Change: 3.92% Year-to-date Change: 9.1% | |
| AEP Links: Profile News Message Board | |
| Charts:- Daily , Weekly | |
| Add AEP to Watchlist: View: Get AEP Trend Analysis ➞ | |
 | MRO Marathon Oil Corporation |
| Sector: Energy | |
| SubSector: Independent Oil & Gas | |
| MarketCap: 2911.53 Millions | |
| Recent Price: 26.34 Smart Investing & Trading Score: 46 | |
| Day Percent Change: 0.96% Day Change: 0.25 | |
| Week Change: -5.15% Year-to-date Change: 9.0% | |
| MRO Links: Profile News Message Board | |
| Charts:- Daily , Weekly | |
| Add MRO to Watchlist: View: Get MRO Trend Analysis ➞ | |
 | REGN Regeneron Pharmaceuticals, Inc. |
| Sector: Health Care | |
| SubSector: Biotechnology | |
| MarketCap: 51903.7 Millions | |
| Recent Price: 957.00 Smart Investing & Trading Score: 69 | |
| Day Percent Change: 2.07% Day Change: 19.39 | |
| Week Change: 8.36% Year-to-date Change: 9.0% | |
| REGN Links: Profile News Message Board | |
| Charts:- Daily , Weekly | |
| Add REGN to Watchlist: View: Get REGN Trend Analysis ➞ | |
 | FITB Fifth Third Bancorp |
| Sector: Financials | |
| SubSector: Regional - Midwest Banks | |
| MarketCap: 10197 Millions | |
| Recent Price: 37.56 Smart Investing & Trading Score: 100 | |
| Day Percent Change: 1.82% Day Change: 0.67 | |
| Week Change: 1.79% Year-to-date Change: 8.9% | |
| FITB Links: Profile News Message Board | |
| Charts:- Daily , Weekly | |
| Add FITB to Watchlist: View: Get FITB Trend Analysis ➞ | |
 | COF Capital One Financial Corporation |
| Sector: Financials | |
| SubSector: Credit Services | |
| MarketCap: 23094.2 Millions | |
| Recent Price: 142.41 Smart Investing & Trading Score: 49 | |
| Day Percent Change: 0.42% Day Change: 0.60 | |
| Week Change: -2.6% Year-to-date Change: 8.6% | |
| COF Links: Profile News Message Board | |
| Charts:- Daily , Weekly | |
| Add COF to Watchlist: View: Get COF Trend Analysis ➞ | |
 | EMN Eastman Chemical Company |
| Sector: Materials | |
| SubSector: Chemicals - Major Diversified | |
| MarketCap: 6217.06 Millions | |
| Recent Price: 97.50 Smart Investing & Trading Score: 83 | |
| Day Percent Change: 1.65% Day Change: 1.58 | |
| Week Change: 2.03% Year-to-date Change: 8.6% | |
| EMN Links: Profile News Message Board | |
| Charts:- Daily , Weekly | |
| Add EMN to Watchlist: View: Get EMN Trend Analysis ➞ | |
 | HBAN Huntington Bancshares Incorporated |
| Sector: Financials | |
| SubSector: Regional - Midwest Banks | |
| MarketCap: 8468.1 Millions | |
| Recent Price: 13.80 Smart Investing & Trading Score: 100 | |
| Day Percent Change: 0.95% Day Change: 0.13 | |
| Week Change: 1.85% Year-to-date Change: 8.5% | |
| HBAN Links: Profile News Message Board | |
| Charts:- Daily , Weekly | |
| Add HBAN to Watchlist: View: Get HBAN Trend Analysis ➞ | |
| For tabular summary view of above stock list: Summary View ➞ 0 - 25 , 25 - 50 , 50 - 75 , 75 - 100 , 100 - 125 , 125 - 150 , 150 - 175 , 175 - 200 , 200 - 225 , 225 - 250 , 250 - 275 , 275 - 300 , 300 - 325 , 325 - 350 , 350 - 375 , 375 - 400 , 400 - 425 , 425 - 450 , 450 - 475 , 475 - 500 | ||
| Click To Change The Sort Order: By Market Cap or Company Size Performance: Year-to-date, Week and Day | |
| Select Chart Type: | ||
|
Best Stocks Today 12Stocks.com |
© 2024 12Stocks.com Terms & Conditions Privacy Contact Us
All Information Provided Only For Education And Not To Be Used For Investing or Trading. See Terms & Conditions


One More Thing ... Get Best Stocks Delivered Daily!
Never Ever Miss A Move With Our Top Ten Stocks Lists
Find Best Stocks In Any Market - Bull or Bear Market
Take A Peek At Our Top Ten Stocks Lists: Daily, Weekly, Year-to-Date & Top Trends
Find Best Stocks In Any Market - Bull or Bear Market
Take A Peek At Our Top Ten Stocks Lists: Daily, Weekly, Year-to-Date & Top Trends
S&P 500 Stocks With Best Up Trends [0-bearish to 100-bullish]: Amgen [100], First Solar[100], Apple [100], Motorola Solutions[100], Camden Property[100], Aptiv [100], Rollins [100], Teradyne [100], Comerica [100], BorgWarner [100], Bio-Techne [100]
Best S&P 500 Stocks Year-to-Date:
NVIDIA [79.29%], Constellation [66.35%], NRG [48.26%], Chipotle Mexican[37.97%], Western Digital[35.48%], Micron [34.4%], Eaton [33.09%], Progressive [31.04%], Leidos Holdings[30.89%], Diamondback [29.93%], Targa Resources[29.29%] Best S&P 500 Stocks This Week:
Bio-Techne [20.65%], Moderna [15.77%], Garmin [15.7%], C.H. Robinson[15.64%], Amgen [15.3%], Aptiv [13.5%], Amcor [11.59%], BorgWarner [9.79%], Albemarle [9.6%], Pfizer [9.49%], Leidos Holdings[8.68%] Best S&P 500 Stocks Daily:
Amgen [11.82%], Enphase [7.67%], Live Nation[7.24%], First Solar[6.12%], Apple [5.98%], Motorola Solutions[5.19%], Digital Realty[4.89%], Constellation [4.87%], Arista Networks[4.79%], Camden Property[4.53%], Aptiv [3.90%]