
 Login Sign Up


| |||||
 |  | ||||

| 12Stocks.com Market Intelligence |
Best S&P 500 Stocks
|
On this page, you will find the most comprehensive analysis of S&P 500 stocks and ETFs - from latest trends to performances to charts ➞. First, here are the year-to-date (YTD) performances of the most requested S&P 500 stocks at 12Stocks.com (click stock for review):
| Intel Corp 84% | ||
| Caterpillar Inc 38% | ||
| Goldman Sachs 37% | ||
| NVIDIA Corp 37% | ||
| Johnson & Johnson 31% | ||
| JPMorgan Chase 30% | ||
| Google Inc 30% | ||
| Boeing Co 27% | ||
| Microsoft 24% | ||
| Gilead 22% | ||
| Walmart Inc 13% | ||
| Chevron Corp 7% | ||
| Apple Inc 6% | ||
| McDonald's Corp 4% | ||
| Amazon.com Inc 1% | ||
| Starbucks Corp -5% | ||
| Merck & Co Inc -8% | ||
| Quick: S&P 500 Stocks Lists: Performances & Trends, S&P 500 Stock Charts
Sort S&P 500 stocks: Daily, Weekly, Year-to-Date, Market Cap & Trends. Filter S&P 500 stocks list by sector: Show all, Tech, Finance, Energy, Staples, Retail, Industrial, Materials, Utilities and HealthCare |
| 12Stocks.com S&P 500 Stocks Performances & Trends Daily Report | |||||||||
|
| 
The overall Smart Investing & Trading Score is 90 (0-bearish to 100-bullish) which puts S&P 500 index in short term bullish trend. The Smart Investing & Trading Score from previous trading session is 80 and an improvement of trend continues. | ||||||||
Here are the Smart Investing & Trading Scores of the most requested S&P 500 stocks at 12Stocks.com (click stock name for detailed review):
|


| 12Stocks.com: Top Performing S&P 500 Index Stocks | ||||||||||||||||||||||||||||||||||||||||||||||||
 The top performing S&P 500 Index stocks year to date are
Now, more recently, over last week, the top performing S&P 500 Index stocks on the move are


|
||||||||||||||||||||||||||||||||||||||||||||||||
| 12Stocks.com: Investing in S&P 500 Index with Stocks | |
|
The following table helps investors and traders sort through current performance and trends (as measured by Smart Investing & Trading Score) of various
stocks in the S&P 500 Index. Quick View: Move mouse or cursor over stock symbol (ticker) to view short-term technical chart and over stock name to view long term chart. Click on  to add stock symbol to your watchlist and to add stock symbol to your watchlist and  to view watchlist. Click on any ticker or stock name for detailed market intelligence report for that stock. to view watchlist. Click on any ticker or stock name for detailed market intelligence report for that stock. |
12Stocks.com Performance of Stocks in S&P 500 Index
| Ticker | Stock Name | Watchlist | Category | Recent Price | Smart Investing & Trading Score | Change % | YTD Change% |
| JPM | JPMorgan Chase |   | Financials | 307.55 | 30 | -1.02% | 30.23% |
| V | Visa Inc | | Financials | 345.95 | 80 | -0.54% | 10.60% |
| MA | Mastercard | | Financials | 577.33 | 60 | 0.62% | 11.01% |
| BAC | Bank Of | | Financials | 50.48 | 20 | -0.39% | 15.37% |
| WFC | Wells Fargo | | Financials | 80.50 | 20 | -0.46% | 16.57% |
| MS | Morgan Stanley | | Financials | 155.30 | 20 | -1.01% | 27.17% |
| AXP | American Express | | Financials | 330.48 | 30 | 0.58% | 11.65% |
| GS | Goldman Sachs | | Financials | 779.38 | 20 | -0.78% | 36.90% |
| BX | Blackstone Inc | | Financials | 166.58 | 10 | -0.90% | -2.04% |
| BLK | Blackrock Inc | | Financials | 1160.54 | 60 | 1.71% | 15.30% |
| C | Citi Inc | | Financials | 97.34 | 20 | -1.39% | 42.19% |
| SCHW | Charles Schwab | | Financials | 92.70 | 10 | 0.49% | 26.72% |
| SPGI | S&P Global | | Financials | 476.63 | 10 | -1.05% | -3.46% |
| PGR | Progressive Corp | | Financials | 243.50 | 30 | -1.20% | 3.28% |
| COF | Capital One | | Financials | 213.78 | 10 | 0.14% | 20.36% |
| WELL | Welltower Inc | | Financials | 175.50 | 50 | -2.16% | 42.63% |
| CB | Chubb | | Financials | 281.37 | 80 | -0.01% | 3.92% |
| PLD | Prologis Inc | | Financials | 116.12 | 100 | -0.31% | 13.44% |
| MMC | Marsh & McLennan Cos. Inc | | Financials | 199.57 | 20 | -0.85% | -4.49% |
| ICE | Intercontinental Exchange | | Financials | 160.98 | 0 | -1.02% | 8.39% |
| CME | CME | | Financials | 265.33 | 30 | -0.19% | 15.10% |
| AMT | American Tower | | Financials | 191.17 | 10 | -1.11% | 7.31% |
| MCO | Moody's Corp | | Financials | 482.17 | 20 | 0.49% | 2.36% |
| PNC | PNC Financial | | Financials | 198.16 | 10 | -0.14% | 6.39% |
| AON | Aon | | Financials | 360.73 | 60 | 0.17% | 2.23% |
| For chart view version of above stock list: Chart View ➞ 0 - 25 , 25 - 50 , 50 - 75 , 75 - 100 | ||
 | Click To Change The Sort Order: By Market Cap or Company Size Performance: Year-to-date, Week and Day |  |
|
Get the most comprehensive stock market coverage daily at 12Stocks.com ➞ Best Stocks Today ➞ Best Stocks Weekly ➞ Best Stocks Year-to-Date ➞ Best Stocks Trends ➞  Best Stocks Today 12Stocks.com Best Nasdaq Stocks ➞ Best S&P 500 Stocks ➞ Best Tech Stocks ➞ Best Biotech Stocks ➞ |
| Detailed Overview of S&P 500 Stocks |
| S&P 500 Technical Overview, Leaders & Laggards, Top S&P 500 ETF Funds & Detailed S&P 500 Stocks List, Charts, Trends & More |
| S&P 500: Technical Analysis, Trends & YTD Performance | |
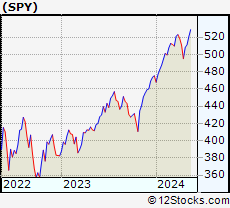
| S&P 500 index as represented by
SPY, an exchange-traded fund [ETF], holds basket of five hundred (mostly largecap) stocks from across all major sectors of the US stock market. The S&P 500 index (contains stocks like Apple and Exxon) is up by 15.1527% and is currently outperforming the overall market by 0.3948% year-to-date. Below is a quick view of technical charts and trends: | |
 SPY Weekly Chart |
|
| Long Term Trend: Very Good | |
| Medium Term Trend: Good | |
 SPY Daily Chart |
|
| Short Term Trend: Very Good | |
| Overall Trend Score: 90 | |
| YTD Performance: 15.1527% | |
| **Trend Scores & Views Are Only For Educational Purposes And Not For Investing | |
| 12Stocks.com: Investing in S&P 500 Index using Exchange Traded Funds | |
|
The following table shows list of key exchange traded funds (ETF) that
help investors track S&P 500 index. The following list also includes leveraged ETF funds that track twice or thrice the daily returns of S&P 500 indices. Short or inverse ETF funds move in the opposite direction to the index they track and are useful during market pullbacks or during bear markets. Quick View: Move mouse or cursor over ETF symbol (ticker) to view short-term technical chart and over ETF name to view long term chart. Click on ticker or stock name for detailed view. Click on to add stock symbol to your watchlist and to view watchlist. |
12Stocks.com List of ETFs that track S&P 500 Index
| Ticker | ETF Name | Watchlist | Recent Price | Smart Investing & Trading Score | Change % | Week % | Year-to-date % |
| SPY | SPDR S&P 500 ETF Trust | | 669.22 | 90 | 0.115192 | 1.22826 | 15.1527% |
| IVV | iShares Core S&P 500 ETF | | 672.50 | 90 | 0.0982377 | 1.24048 | 15.1922% |
| VOO | Vanguard S&P 500 ETF | | 615.25 | 90 | 0.107389 | 0.943396 | 15.2251% |
| OEF | iShares S&P 100 ETF | | 334.28 | 90 | 0.00598337 | 1.05505 | 16.5396% |
| SSO | ProShares Ultra S&P500 2x Shares | | 113.12 | 90 | 0.177117 | 2.334 | 23.4297% |
| UPRO | ProShares UltraPro S&P 500 ETF 3x Shares | | 113.01 | 90 | 0.275067 | 3.45112 | 29.2069% |
| SPXL | Direxion Daily S&P 500 Bull 3X Shares | | 214.76 | 90 | 0.28953 | 3.47386 | 29.2396% |
| SH | ProShares Short S&P500 -1x Shares | | 36.80 | 10 | -0.0543183 | -1.07527 | -11.8852% |
| SDS | ProShares UltraShort S&P500 -2x Shares | | 14.33 | 10 | -0.139373 | -2.1843 | -25.9516% |
| SPXU | ProShares UltraPro Short S&P 500 | | 13.34 | 10 | -0.224383 | -3.26323 | -40.0301% |
| SPXS | Direxion Daily S&P 500 Bear -3X Shares | | 37.50 | 70 | -0.239425 | 868.992 | 503.962% |
| 12Stocks.com: Charts, Trends, Fundamental Data and Performances of S&P 500 Stocks | |
|
We now take in-depth look at all S&P 500 stocks including charts, multi-period performances and overall trends (as measured by Smart Investing & Trading Score). One can sort S&P 500 stocks (click link to choose) by Daily, Weekly and by Year-to-Date performances. Also, one can sort by size of the company or by market capitalization. |
| Select Your Default Chart Type: | |||||
| |||||
| Click on stock symbol or name for detailed view. Click on to add stock symbol to your watchlist and to view watchlist. Quick View: Move mouse or cursor over "Daily" to quickly view daily technical stock chart and over "Weekly" to view weekly technical stock chart. | |||||

 | JPM JPMorgan Chase & Co |
| Sector: Financials | |
| SubSector: Banks - Diversified | |
| MarketCap: 809472 Millions | |
| Recent Price: 307.55 Smart Investing & Trading Score: 30 | |
| Day Percent Change: -1.01703% Day Change: -3.39 | |
| Week Change: -1.87289% Year-to-date Change: 30.2% | |
| JPM Links: Profile News Message Board | |
| Charts:- Daily , Weekly | |
| Add JPM to Watchlist: View: Get JPM Trend Analysis ➞ | |
 | V Visa Inc |
| Sector: Financials | |
| SubSector: Credit Services | |
| MarketCap: 661248 Millions | |
| Recent Price: 345.95 Smart Investing & Trading Score: 80 | |
| Day Percent Change: -0.540494% Day Change: -1.25 | |
| Week Change: 2.14657% Year-to-date Change: 10.6% | |
| V Links: Profile News Message Board | |
| Charts:- Daily , Weekly | |
| Add V to Watchlist: View: Get V Trend Analysis ➞ | |
 | MA Mastercard Incorporated |
| Sector: Financials | |
| SubSector: Credit Services | |
| MarketCap: 528142 Millions | |
| Recent Price: 577.33 Smart Investing & Trading Score: 60 | |
| Day Percent Change: 0.620458% Day Change: 5.3 | |
| Week Change: 1.49786% Year-to-date Change: 11.0% | |
| MA Links: Profile News Message Board | |
| Charts:- Daily , Weekly | |
| Add MA to Watchlist: View: Get MA Trend Analysis ➞ | |
 | BAC Bank Of America Corp |
| Sector: Financials | |
| SubSector: Banks - Diversified | |
| MarketCap: 368644 Millions | |
| Recent Price: 50.48 Smart Investing & Trading Score: 20 | |
| Day Percent Change: -0.394633% Day Change: -0.14 | |
| Week Change: -2.35977% Year-to-date Change: 15.4% | |
| BAC Links: Profile News Message Board | |
| Charts:- Daily , Weekly | |
| Add BAC to Watchlist: View: Get BAC Trend Analysis ➞ | |
 | WFC Wells Fargo & Co |
| Sector: Financials | |
| SubSector: Banks - Diversified | |
| MarketCap: 252944 Millions | |
| Recent Price: 80.50 Smart Investing & Trading Score: 20 | |
| Day Percent Change: -0.457524% Day Change: -0.23 | |
| Week Change: -4.292% Year-to-date Change: 16.6% | |
| WFC Links: Profile News Message Board | |
| Charts:- Daily , Weekly | |
| Add WFC to Watchlist: View: Get WFC Trend Analysis ➞ | |
 | MS Morgan Stanley |
| Sector: Financials | |
| SubSector: Capital Markets | |
| MarketCap: 236401 Millions | |
| Recent Price: 155.30 Smart Investing & Trading Score: 20 | |
| Day Percent Change: -1.01345% Day Change: -1.4 | |
| Week Change: -1.63415% Year-to-date Change: 27.2% | |
| MS Links: Profile News Message Board | |
| Charts:- Daily , Weekly | |
| Add MS to Watchlist: View: Get MS Trend Analysis ➞ | |
 | AXP American Express Co |
| Sector: Financials | |
| SubSector: Credit Services | |
| MarketCap: 227011 Millions | |
| Recent Price: 330.48 Smart Investing & Trading Score: 30 | |
| Day Percent Change: 0.584368% Day Change: 2.35 | |
| Week Change: -2.93703% Year-to-date Change: 11.6% | |
| AXP Links: Profile News Message Board | |
| Charts:- Daily , Weekly | |
| Add AXP to Watchlist: View: Get AXP Trend Analysis ➞ | |
 | GS Goldman Sachs Group, Inc |
| Sector: Financials | |
| SubSector: Capital Markets | |
| MarketCap: 223472 Millions | |
| Recent Price: 779.38 Smart Investing & Trading Score: 20 | |
| Day Percent Change: -0.780385% Day Change: -3.74 | |
| Week Change: -1.64683% Year-to-date Change: 36.9% | |
| GS Links: Profile News Message Board | |
| Charts:- Daily , Weekly | |
| Add GS to Watchlist: View: Get GS Trend Analysis ➞ | |
 | BX Blackstone Inc |
| Sector: Financials | |
| SubSector: Asset Management | |
| MarketCap: 208778 Millions | |
| Recent Price: 166.58 Smart Investing & Trading Score: 10 | |
| Day Percent Change: -0.904224% Day Change: -0.01 | |
| Week Change: -6.45777% Year-to-date Change: -2.0% | |
| BX Links: Profile News Message Board | |
| Charts:- Daily , Weekly | |
| Add BX to Watchlist: View: Get BX Trend Analysis ➞ | |
 | BLK Blackrock Inc |
| Sector: Financials | |
| SubSector: Asset Management | |
| MarketCap: 179366 Millions | |
| Recent Price: 1160.54 Smart Investing & Trading Score: 60 | |
| Day Percent Change: 1.70629% Day Change: 22.15 | |
| Week Change: 2.88658% Year-to-date Change: 15.3% | |
| BLK Links: Profile News Message Board | |
| Charts:- Daily , Weekly | |
| Add BLK to Watchlist: View: Get BLK Trend Analysis ➞ | |
 | C Citigroup Inc |
| Sector: Financials | |
| SubSector: Banks - Diversified | |
| MarketCap: 175622 Millions | |
| Recent Price: 97.34 Smart Investing & Trading Score: 20 | |
| Day Percent Change: -1.3879% Day Change: -1.6 | |
| Week Change: -4.24004% Year-to-date Change: 42.2% | |
| C Links: Profile News Message Board | |
| Charts:- Daily , Weekly | |
| Add C to Watchlist: View: Get C Trend Analysis ➞ | |
 | SCHW Charles Schwab Corp |
| Sector: Financials | |
| SubSector: Capital Markets | |
| MarketCap: 167091 Millions | |
| Recent Price: 92.70 Smart Investing & Trading Score: 10 | |
| Day Percent Change: 0.487805% Day Change: 0.66 | |
| Week Change: 0.357259% Year-to-date Change: 26.7% | |
| SCHW Links: Profile News Message Board | |
| Charts:- Daily , Weekly | |
| Add SCHW to Watchlist: View: Get SCHW Trend Analysis ➞ | |
 | SPGI S&P Global Inc |
| Sector: Financials | |
| SubSector: Financial Data & Stock Exchanges | |
| MarketCap: 164270 Millions | |
| Recent Price: 476.63 Smart Investing & Trading Score: 10 | |
| Day Percent Change: -1.04636% Day Change: -5.52 | |
| Week Change: -2.87525% Year-to-date Change: -3.5% | |
| SPGI Links: Profile News Message Board | |
| Charts:- Daily , Weekly | |
| Add SPGI to Watchlist: View: Get SPGI Trend Analysis ➞ | |
 | PGR Progressive Corp |
| Sector: Financials | |
| SubSector: Insurance - Property & Casualty | |
| MarketCap: 142953 Millions | |
| Recent Price: 243.50 Smart Investing & Trading Score: 30 | |
| Day Percent Change: -1.20101% Day Change: -3.33 | |
| Week Change: 1.45833% Year-to-date Change: 3.3% | |
| PGR Links: Profile News Message Board | |
| Charts:- Daily , Weekly | |
| Add PGR to Watchlist: View: Get PGR Trend Analysis ➞ | |
 | COF Capital One Financial Corp |
| Sector: Financials | |
| SubSector: Credit Services | |
| MarketCap: 141672 Millions | |
| Recent Price: 213.78 Smart Investing & Trading Score: 10 | |
| Day Percent Change: 0.140528% Day Change: 0.39 | |
| Week Change: -4.70714% Year-to-date Change: 20.4% | |
| COF Links: Profile News Message Board | |
| Charts:- Daily , Weekly | |
| Add COF to Watchlist: View: Get COF Trend Analysis ➞ | |
 | WELL Welltower Inc |
| Sector: Financials | |
| SubSector: REIT - Healthcare Facilities | |
| MarketCap: 112094 Millions | |
| Recent Price: 175.50 Smart Investing & Trading Score: 50 | |
| Day Percent Change: -2.16301% Day Change: -3.7 | |
| Week Change: 2.64959% Year-to-date Change: 42.6% | |
| WELL Links: Profile News Message Board | |
| Charts:- Daily , Weekly | |
| Add WELL to Watchlist: View: Get WELL Trend Analysis ➞ | |
 | CB Chubb Limited |
| Sector: Financials | |
| SubSector: Insurance - Property & Casualty | |
| MarketCap: 110589 Millions | |
| Recent Price: 281.37 Smart Investing & Trading Score: 80 | |
| Day Percent Change: -0.0142141% Day Change: 0.42 | |
| Week Change: 1.11766% Year-to-date Change: 3.9% | |
| CB Links: Profile News Message Board | |
| Charts:- Daily , Weekly | |
| Add CB to Watchlist: View: Get CB Trend Analysis ➞ | |
 | PLD Prologis Inc |
| Sector: Financials | |
| SubSector: REIT - Industrial | |
| MarketCap: 108028 Millions | |
| Recent Price: 116.12 Smart Investing & Trading Score: 100 | |
| Day Percent Change: -0.309066% Day Change: -0.6 | |
| Week Change: 2.88853% Year-to-date Change: 13.4% | |
| PLD Links: Profile News Message Board | |
| Charts:- Daily , Weekly | |
| Add PLD to Watchlist: View: Get PLD Trend Analysis ➞ | |
 | MMC Marsh & McLennan Cos., Inc |
| Sector: Financials | |
| SubSector: Insurance Brokers | |
| MarketCap: 100163 Millions | |
| Recent Price: 199.57 Smart Investing & Trading Score: 20 | |
| Day Percent Change: -0.854489% Day Change: -0.55 | |
| Week Change: -0.0450766% Year-to-date Change: -4.5% | |
| MMC Links: Profile News Message Board | |
| Charts:- Daily , Weekly | |
| Add MMC to Watchlist: View: Get MMC Trend Analysis ➞ | |
 | ICE Intercontinental Exchange Inc |
| Sector: Financials | |
| SubSector: Financial Data & Stock Exchanges | |
| MarketCap: 99756.2 Millions | |
| Recent Price: 160.98 Smart Investing & Trading Score: 0 | |
| Day Percent Change: -1.02066% Day Change: -0.22 | |
| Week Change: -4.20708% Year-to-date Change: 8.4% | |
| ICE Links: Profile News Message Board | |
| Charts:- Daily , Weekly | |
| Add ICE to Watchlist: View: Get ICE Trend Analysis ➞ | |
 | CME CME Group Inc |
| Sector: Financials | |
| SubSector: Financial Data & Stock Exchanges | |
| MarketCap: 94398 Millions | |
| Recent Price: 265.33 Smart Investing & Trading Score: 30 | |
| Day Percent Change: -0.191845% Day Change: 0.02 | |
| Week Change: 0.340355% Year-to-date Change: 15.1% | |
| CME Links: Profile News Message Board | |
| Charts:- Daily , Weekly | |
| Add CME to Watchlist: View: Get CME Trend Analysis ➞ | |
 | AMT American Tower Corp |
| Sector: Financials | |
| SubSector: REIT - Specialty | |
| MarketCap: 92863.6 Millions | |
| Recent Price: 191.17 Smart Investing & Trading Score: 10 | |
| Day Percent Change: -1.11215% Day Change: -1.69 | |
| Week Change: -0.912248% Year-to-date Change: 7.3% | |
| AMT Links: Profile News Message Board | |
| Charts:- Daily , Weekly | |
| Add AMT to Watchlist: View: Get AMT Trend Analysis ➞ | |
 | MCO Moody's Corp |
| Sector: Financials | |
| SubSector: Financial Data & Stock Exchanges | |
| MarketCap: 89526 Millions | |
| Recent Price: 482.17 Smart Investing & Trading Score: 20 | |
| Day Percent Change: 0.489767% Day Change: 0.32 | |
| Week Change: 1.55223% Year-to-date Change: 2.4% | |
| MCO Links: Profile News Message Board | |
| Charts:- Daily , Weekly | |
| Add MCO to Watchlist: View: Get MCO Trend Analysis ➞ | |
 | PNC PNC Financial Services Group Inc |
| Sector: Financials | |
| SubSector: Banks - Regional | |
| MarketCap: 80494.2 Millions | |
| Recent Price: 198.16 Smart Investing & Trading Score: 10 | |
| Day Percent Change: -0.141101% Day Change: 0.12 | |
| Week Change: -2.90082% Year-to-date Change: 6.4% | |
| PNC Links: Profile News Message Board | |
| Charts:- Daily , Weekly | |
| Add PNC to Watchlist: View: Get PNC Trend Analysis ➞ | |
 | AON Aon plc |
| Sector: Financials | |
| SubSector: Insurance Brokers | |
| MarketCap: 79898.3 Millions | |
| Recent Price: 360.73 Smart Investing & Trading Score: 60 | |
| Day Percent Change: 0.166607% Day Change: 0.1 | |
| Week Change: 1.97603% Year-to-date Change: 2.2% | |
| AON Links: Profile News Message Board | |
| Charts:- Daily , Weekly | |
| Add AON to Watchlist: View: Get AON Trend Analysis ➞ | |
| For tabular summary view of above stock list: Summary View ➞ 0 - 25 , 25 - 50 , 50 - 75 , 75 - 100 | ||
| Click To Change The Sort Order: By Market Cap or Company Size Performance: Year-to-date, Week and Day | |
| Select Chart Type: | ||
|
Best Stocks Today 12Stocks.com |
© 2025 12Stocks.com Terms & Conditions Privacy Contact Us
All Information Provided Only For Education And Not To Be Used For Investing or Trading. See Terms & Conditions


One More Thing ... Get Best Stocks Delivered Daily!
Never Ever Miss A Move With Our Top Ten Stocks Lists
Find Best Stocks In Any Market - Bull or Bear Market
Take A Peek At Our Top Ten Stocks Lists: Daily, Weekly, Year-to-Date & Top Trends
Find Best Stocks In Any Market - Bull or Bear Market
Take A Peek At Our Top Ten Stocks Lists: Daily, Weekly, Year-to-Date & Top Trends
S&P 500 Stocks With Best Up Trends [0-bearish to 100-bullish]: Fair Isaac[100], Intel Corp[100], Bio-Techne Corp[100], DuPont de[100], First Solar[100], Centene Corp[100], Lam Research[100], Charles River[100], Applied Materials[100], Steel Dynamics[100], Teradyne Inc[100]
Best S&P 500 Stocks Year-to-Date:
Seagate [198.865%], Western Digital[181.204%], Newmont Corp[127.671%], Micron [110.87%], Lam Research[103.976%], Intel Corp[84.4708%], Warner Bros.[84.2%], NRG [82.3658%], CVS Health[81.156%], Amphenol Corp[79.8571%], KLA Corp[79.7904%] Best S&P 500 Stocks This Week:
Pioneer Natural[108.1%], Bio-Techne Corp[21.2222%], Electronic Arts[20.1076%], Western Digital[19.6645%], Intel Corp[19.4747%], Charles River[17.3369%], Fair Isaac[15.6495%], Lamb Weston[15.5663%], Lam Research[14.5184%], Seagate [13.8757%], Micron [13.6232%] Best S&P 500 Stocks Daily:
Fair Isaac[17.979%], Celanese Corp[6.98937%], Humana Inc[3.99157%], CF Industries[3.94539%], Eastman Chemical[3.88961%], Intel Corp[3.78408%], Albemarle Corp[3.7173%], Caesars Entertainment[3.66089%], Bio-Techne Corp[3.6215%], DuPont de[3.54129%], Advanced Micro[3.48759%]