
 Login Sign Up


| |||||
 |  | ||||

| 12Stocks.com Market Intelligence |
Best S&P 500 Stocks
|
On this page, you will find the most comprehensive analysis of S&P 500 stocks and ETFs - from latest trends to performances to charts ➞. First, here are the year-to-date (YTD) performances of the most requested S&P 500 stocks at 12Stocks.com (click stock for review):
| NVIDIA 63% | ||
| Merck 20% | ||
| Walmart 14% | ||
| JPMorgan Chase 13% | ||
| Caterpillar 13% | ||
| Amazon.com 12% | ||
| Chevron 10% | ||
| Google 9% | ||
| Goldman Sachs 8% | ||
| Microsoft 4% | ||
| Johnson & Johnson -6% | ||
| McDonald s -7% | ||
| Starbucks -8% | ||
| Apple -12% | ||
| Gilead -18% | ||
| Intel -31% | ||
| Boeing -38% | ||
| Quick: S&P 500 Stocks Lists: Performances & Trends, S&P 500 Stock Charts
Sort S&P 500 stocks: Daily, Weekly, Year-to-Date, Market Cap & Trends. Filter S&P 500 stocks list by sector: Show all, Tech, Finance, Energy, Staples, Retail, Industrial, Materials, Utilities and HealthCare |
| 12Stocks.com S&P 500 Stocks Performances & Trends Daily Report | |||||||||
|
| 
The overall Smart Investing & Trading Score is 44 (0-bearish to 100-bullish) which puts S&P 500 index in short term neutral trend. The Smart Investing & Trading Score from previous trading session is 58 and hence a deterioration of trend. | ||||||||
Here are the Smart Investing & Trading Scores of the most requested S&P 500 stocks at 12Stocks.com (click stock name for detailed review):
|


| 12Stocks.com: Top Performing S&P 500 Index Stocks | ||||||||||||||||||||||||||||||||||||||||||||||||
 The top performing S&P 500 Index stocks year to date are
Now, more recently, over last week, the top performing S&P 500 Index stocks on the move are


|
||||||||||||||||||||||||||||||||||||||||||||||||
| 12Stocks.com: Investing in S&P 500 Index with Stocks | |
|
The following table helps investors and traders sort through current performance and trends (as measured by Smart Investing & Trading Score) of various
stocks in the S&P 500 Index. Quick View: Move mouse or cursor over stock symbol (ticker) to view short-term technical chart and over stock name to view long term chart. Click on  to add stock symbol to your watchlist and to add stock symbol to your watchlist and  to view watchlist. Click on any ticker or stock name for detailed market intelligence report for that stock. to view watchlist. Click on any ticker or stock name for detailed market intelligence report for that stock. |
12Stocks.com Performance of Stocks in S&P 500 Index
| Ticker | Stock Name | Watchlist | Category | Recent Price | Smart Investing & Trading Score | Change % | YTD Change% |
| PSA | Public Storage |   | Financials | 259.16 | 10 | -1.15% | -15.03% |
| BK | Bank of New York | | Financials | 57.02 | 63 | -1.61% | 9.54% |
| DLR | Digital Realty | | Financials | 137.63 | 48 | -2.12% | 2.27% |
| MET | MetLife | | Financials | 71.85 | 68 | -1.20% | 8.65% |
| ALL | Allstate | | Financials | 171.58 | 51 | -0.40% | 22.57% |
| TRV | Travelers | | Financials | 211.57 | 23 | -0.87% | 11.07% |
| TROW | T. Rowe | | Financials | 107.89 | 18 | -2.85% | 0.19% |
| COF | Capital One | | Financials | 145.76 | 68 | -2.09% | 11.17% |
| AFL | Aflac | | Financials | 83.34 | 42 | -1.11% | 1.02% |
| EQR | Equity Residential | | Financials | 64.00 | 100 | -0.94% | 4.64% |
| CSGP | CoStar | | Financials | 89.86 | 80 | -2.28% | 2.82% |
| WELL | Welltower | | Financials | 92.89 | 80 | -0.86% | 3.02% |
| AIG | American | | Financials | 74.37 | 43 | -0.80% | 9.77% |
| PRU | Prudential Financial | | Financials | 111.01 | 51 | -1.55% | 7.04% |
| AVB | AvalonBay Communities | | Financials | 189.46 | 100 | -0.98% | 1.20% |
| STT | State Street | | Financials | 73.03 | 0 | -1.70% | -5.72% |
| SPG | Simon Property | | Financials | 140.91 | 36 | -1.33% | -1.21% |
| O | Realty Income | | Financials | 53.04 | 74 | -1.17% | -7.63% |
| ARE | Alexandria Real | | Financials | 115.95 | 35 | -3.09% | -8.54% |
| NTRS | Northern Trust | | Financials | 83.03 | 54 | -1.50% | -1.59% |
| NDAQ | Nasdaq | | Financials | 58.54 | 61 | -4.81% | 0.69% |
| AJG | Arthur J. | | Financials | 234.50 | 51 | -0.98% | 4.28% |
| MTB | M&T Bank | | Financials | 146.46 | 88 | -1.02% | 6.84% |
| BXP | Boston Properties | | Financials | 60.82 | 22 | -3.37% | -13.32% |
| EFX | Equifax | | Financials | 221.35 | 25 | -1.93% | -10.49% |
| For chart view version of above stock list: Chart View ➞ 0 - 25 , 25 - 50 , 50 - 75 , 75 - 100 | ||
 | Click To Change The Sort Order: By Market Cap or Company Size Performance: Year-to-date, Week and Day |  |
|
Get the most comprehensive stock market coverage daily at 12Stocks.com ➞ Best Stocks Today ➞ Best Stocks Weekly ➞ Best Stocks Year-to-Date ➞ Best Stocks Trends ➞  Best Stocks Today 12Stocks.com Best Nasdaq Stocks ➞ Best S&P 500 Stocks ➞ Best Tech Stocks ➞ Best Biotech Stocks ➞ |
| Detailed Overview of S&P 500 Stocks |
| S&P 500 Technical Overview, Leaders & Laggards, Top S&P 500 ETF Funds & Detailed S&P 500 Stocks List, Charts, Trends & More |
| S&P 500: Technical Analysis, Trends & YTD Performance | |
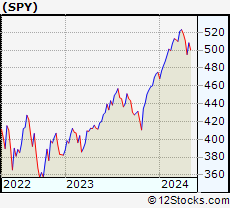
| S&P 500 index as represented by
SPY, an exchange-traded fund [ETF], holds basket of five hundred (mostly largecap) stocks from across all major sectors of the US stock market. The S&P 500 index (contains stocks like Apple and Exxon) is up by 4.7% and is currently outperforming the overall market by 0.78% year-to-date. Below is a quick view of technical charts and trends: | |
 SPY Weekly Chart |
|
| Long Term Trend: Good | |
| Medium Term Trend: Not Good | |
 SPY Daily Chart |
|
| Short Term Trend: Not Good | |
| Overall Trend Score: 44 | |
| YTD Performance: 4.7% | |
| **Trend Scores & Views Are Only For Educational Purposes And Not For Investing | |
| 12Stocks.com: Investing in S&P 500 Index using Exchange Traded Funds | |
|
The following table shows list of key exchange traded funds (ETF) that
help investors track S&P 500 index. The following list also includes leveraged ETF funds that track twice or thrice the daily returns of S&P 500 indices. Short or inverse ETF funds move in the opposite direction to the index they track and are useful during market pullbacks or during bear markets. Quick View: Move mouse or cursor over ETF symbol (ticker) to view short-term technical chart and over ETF name to view long term chart. Click on ticker or stock name for detailed view. Click on to add stock symbol to your watchlist and to view watchlist. |
12Stocks.com List of ETFs that track S&P 500 Index
| Ticker | ETF Name | Watchlist | Recent Price | Smart Investing & Trading Score | Change % | Week % | Year-to-date % |
| SPY | SPDR S&P 500 ETF | | 497.67 | 44 | -1.53 | 0.51 | 4.7% |
| OEF | iShares S&P 100 | | 235.56 | 34 | -1.76 | 0.37 | 5.45% |
| SSO | ProShares Ultra S&P500 | | 69.83 | 44 | -2.94 | 1.05 | 7.32% |
| UPRO | ProShares UltraPro S&P500 | | 60.03 | 36 | -4.52 | 1.48 | 9.67% |
| SH | ProShares Short S&P500 | | 12.53 | 62 | 1.58 | -0.52 | -3.58% |
| SDS | ProShares UltraShort S&P500 | | 27.58 | 62 | 2.91 | -1.15 | -7.82% |
| SPXU | ProShares UltraPro Short S&P500 | | 37.68 | 69 | 4.55 | -1.7 | -12.37% |
| 12Stocks.com: Charts, Trends, Fundamental Data and Performances of S&P 500 Stocks | |
|
We now take in-depth look at all S&P 500 stocks including charts, multi-period performances and overall trends (as measured by Smart Investing & Trading Score). One can sort S&P 500 stocks (click link to choose) by Daily, Weekly and by Year-to-Date performances. Also, one can sort by size of the company or by market capitalization. |
| Select Your Default Chart Type: | |||||
| |||||
| Click on stock symbol or name for detailed view. Click on to add stock symbol to your watchlist and to view watchlist. Quick View: Move mouse or cursor over "Daily" to quickly view daily technical stock chart and over "Weekly" to view weekly technical stock chart. | |||||

 | PSA Public Storage |
| Sector: Financials | |
| SubSector: REIT - Industrial | |
| MarketCap: 32733.9 Millions | |
| Recent Price: 259.16 Smart Investing & Trading Score: 10 | |
| Day Percent Change: -1.15% Day Change: -3.01 | |
| Week Change: -0.47% Year-to-date Change: -15.0% | |
| PSA Links: Profile News Message Board | |
| Charts:- Daily , Weekly | |
| Add PSA to Watchlist: View: Get PSA Trend Analysis ➞ | |
 | BK The Bank of New York Mellon Corporation |
| Sector: Financials | |
| SubSector: Asset Management | |
| MarketCap: 29807.5 Millions | |
| Recent Price: 57.02 Smart Investing & Trading Score: 63 | |
| Day Percent Change: -1.61% Day Change: -0.94 | |
| Week Change: 1.29% Year-to-date Change: 9.5% | |
| BK Links: Profile News Message Board | |
| Charts:- Daily , Weekly | |
| Add BK to Watchlist: View: Get BK Trend Analysis ➞ | |
 | DLR Digital Realty Trust, Inc. |
| Sector: Financials | |
| SubSector: REIT - Office | |
| MarketCap: 27038.6 Millions | |
| Recent Price: 137.63 Smart Investing & Trading Score: 48 | |
| Day Percent Change: -2.12% Day Change: -2.98 | |
| Week Change: 0.59% Year-to-date Change: 2.3% | |
| DLR Links: Profile News Message Board | |
| Charts:- Daily , Weekly | |
| Add DLR to Watchlist: View: Get DLR Trend Analysis ➞ | |
 | MET MetLife, Inc. |
| Sector: Financials | |
| SubSector: Life Insurance | |
| MarketCap: 26272.9 Millions | |
| Recent Price: 71.85 Smart Investing & Trading Score: 68 | |
| Day Percent Change: -1.20% Day Change: -0.87 | |
| Week Change: 1.04% Year-to-date Change: 8.7% | |
| MET Links: Profile News Message Board | |
| Charts:- Daily , Weekly | |
| Add MET to Watchlist: View: Get MET Trend Analysis ➞ | |
 | ALL The Allstate Corporation |
| Sector: Financials | |
| SubSector: Property & Casualty Insurance | |
| MarketCap: 25916.6 Millions | |
| Recent Price: 171.58 Smart Investing & Trading Score: 51 | |
| Day Percent Change: -0.40% Day Change: -0.69 | |
| Week Change: -0.8% Year-to-date Change: 22.6% | |
| ALL Links: Profile News Message Board | |
| Charts:- Daily , Weekly | |
| Add ALL to Watchlist: View: Get ALL Trend Analysis ➞ | |
 | TRV The Travelers Companies, Inc. |
| Sector: Financials | |
| SubSector: Property & Casualty Insurance | |
| MarketCap: 25155.9 Millions | |
| Recent Price: 211.57 Smart Investing & Trading Score: 23 | |
| Day Percent Change: -0.87% Day Change: -1.86 | |
| Week Change: -1.17% Year-to-date Change: 11.1% | |
| TRV Links: Profile News Message Board | |
| Charts:- Daily , Weekly | |
| Add TRV to Watchlist: View: Get TRV Trend Analysis ➞ | |
 | TROW T. Rowe Price Group, Inc. |
| Sector: Financials | |
| SubSector: Asset Management | |
| MarketCap: 24530 Millions | |
| Recent Price: 107.89 Smart Investing & Trading Score: 18 | |
| Day Percent Change: -2.85% Day Change: -3.17 | |
| Week Change: -0.77% Year-to-date Change: 0.2% | |
| TROW Links: Profile News Message Board | |
| Charts:- Daily , Weekly | |
| Add TROW to Watchlist: View: Get TROW Trend Analysis ➞ | |
 | COF Capital One Financial Corporation |
| Sector: Financials | |
| SubSector: Credit Services | |
| MarketCap: 23094.2 Millions | |
| Recent Price: 145.76 Smart Investing & Trading Score: 68 | |
| Day Percent Change: -2.09% Day Change: -3.11 | |
| Week Change: 2% Year-to-date Change: 11.2% | |
| COF Links: Profile News Message Board | |
| Charts:- Daily , Weekly | |
| Add COF to Watchlist: View: Get COF Trend Analysis ➞ | |
 | AFL Aflac Incorporated |
| Sector: Financials | |
| SubSector: Accident & Health Insurance | |
| MarketCap: 22706 Millions | |
| Recent Price: 83.34 Smart Investing & Trading Score: 42 | |
| Day Percent Change: -1.11% Day Change: -0.94 | |
| Week Change: 0.14% Year-to-date Change: 1.0% | |
| AFL Links: Profile News Message Board | |
| Charts:- Daily , Weekly | |
| Add AFL to Watchlist: View: Get AFL Trend Analysis ➞ | |
 | EQR Equity Residential |
| Sector: Financials | |
| SubSector: REIT - Residential | |
| MarketCap: 22061.9 Millions | |
| Recent Price: 64.00 Smart Investing & Trading Score: 100 | |
| Day Percent Change: -0.94% Day Change: -0.61 | |
| Week Change: 4% Year-to-date Change: 4.6% | |
| EQR Links: Profile News Message Board | |
| Charts:- Daily , Weekly | |
| Add EQR to Watchlist: View: Get EQR Trend Analysis ➞ | |
 | CSGP CoStar Group, Inc. |
| Sector: Financials | |
| SubSector: Property Management | |
| MarketCap: 21454.4 Millions | |
| Recent Price: 89.86 Smart Investing & Trading Score: 80 | |
| Day Percent Change: -2.28% Day Change: -2.09 | |
| Week Change: 6.64% Year-to-date Change: 2.8% | |
| CSGP Links: Profile News Message Board | |
| Charts:- Daily , Weekly | |
| Add CSGP to Watchlist: View: Get CSGP Trend Analysis ➞ | |
 | WELL Welltower Inc. |
| Sector: Financials | |
| SubSector: REIT - Healthcare Facilities | |
| MarketCap: 21398.8 Millions | |
| Recent Price: 92.89 Smart Investing & Trading Score: 80 | |
| Day Percent Change: -0.86% Day Change: -0.81 | |
| Week Change: 1.72% Year-to-date Change: 3.0% | |
| WELL Links: Profile News Message Board | |
| Charts:- Daily , Weekly | |
| Add WELL to Watchlist: View: Get WELL Trend Analysis ➞ | |
 | AIG American International Group, Inc. |
| Sector: Financials | |
| SubSector: Property & Casualty Insurance | |
| MarketCap: 21219 Millions | |
| Recent Price: 74.37 Smart Investing & Trading Score: 43 | |
| Day Percent Change: -0.80% Day Change: -0.60 | |
| Week Change: 0.19% Year-to-date Change: 9.8% | |
| AIG Links: Profile News Message Board | |
| Charts:- Daily , Weekly | |
| Add AIG to Watchlist: View: Get AIG Trend Analysis ➞ | |
 | PRU Prudential Financial, Inc. |
| Sector: Financials | |
| SubSector: Life Insurance | |
| MarketCap: 21001.6 Millions | |
| Recent Price: 111.01 Smart Investing & Trading Score: 51 | |
| Day Percent Change: -1.55% Day Change: -1.75 | |
| Week Change: 0.36% Year-to-date Change: 7.0% | |
| PRU Links: Profile News Message Board | |
| Charts:- Daily , Weekly | |
| Add PRU to Watchlist: View: Get PRU Trend Analysis ➞ | |
 | AVB AvalonBay Communities, Inc. |
| Sector: Financials | |
| SubSector: REIT - Residential | |
| MarketCap: 19921.9 Millions | |
| Recent Price: 189.46 Smart Investing & Trading Score: 100 | |
| Day Percent Change: -0.98% Day Change: -1.88 | |
| Week Change: 2.89% Year-to-date Change: 1.2% | |
| AVB Links: Profile News Message Board | |
| Charts:- Daily , Weekly | |
| Add AVB to Watchlist: View: Get AVB Trend Analysis ➞ | |
 | STT State Street Corporation |
| Sector: Financials | |
| SubSector: Asset Management | |
| MarketCap: 18623 Millions | |
| Recent Price: 73.03 Smart Investing & Trading Score: 0 | |
| Day Percent Change: -1.70% Day Change: -1.26 | |
| Week Change: -0.46% Year-to-date Change: -5.7% | |
| STT Links: Profile News Message Board | |
| Charts:- Daily , Weekly | |
| Add STT to Watchlist: View: Get STT Trend Analysis ➞ | |
 | SPG Simon Property Group, Inc. |
| Sector: Financials | |
| SubSector: REIT - Retail | |
| MarketCap: 17959.6 Millions | |
| Recent Price: 140.91 Smart Investing & Trading Score: 36 | |
| Day Percent Change: -1.33% Day Change: -1.90 | |
| Week Change: 0.33% Year-to-date Change: -1.2% | |
| SPG Links: Profile News Message Board | |
| Charts:- Daily , Weekly | |
| Add SPG to Watchlist: View: Get SPG Trend Analysis ➞ | |
 | O Realty Income Corporation |
| Sector: Financials | |
| SubSector: REIT - Retail | |
| MarketCap: 17647.4 Millions | |
| Recent Price: 53.04 Smart Investing & Trading Score: 74 | |
| Day Percent Change: -1.17% Day Change: -0.63 | |
| Week Change: 0% Year-to-date Change: -7.6% | |
| O Links: Profile News Message Board | |
| Charts:- Daily , Weekly | |
| Add O to Watchlist: View: Get O Trend Analysis ➞ | |
 | ARE Alexandria Real Estate Equities, Inc. |
| Sector: Financials | |
| SubSector: REIT - Office | |
| MarketCap: 16793.6 Millions | |
| Recent Price: 115.95 Smart Investing & Trading Score: 35 | |
| Day Percent Change: -3.09% Day Change: -3.70 | |
| Week Change: 0.22% Year-to-date Change: -8.5% | |
| ARE Links: Profile News Message Board | |
| Charts:- Daily , Weekly | |
| Add ARE to Watchlist: View: Get ARE Trend Analysis ➞ | |
 | NTRS Northern Trust Corporation |
| Sector: Financials | |
| SubSector: Asset Management | |
| MarketCap: 15316.8 Millions | |
| Recent Price: 83.03 Smart Investing & Trading Score: 54 | |
| Day Percent Change: -1.50% Day Change: -1.27 | |
| Week Change: 1.95% Year-to-date Change: -1.6% | |
| NTRS Links: Profile News Message Board | |
| Charts:- Daily , Weekly | |
| Add NTRS to Watchlist: View: Get NTRS Trend Analysis ➞ | |
 | NDAQ Nasdaq, Inc. |
| Sector: Financials | |
| SubSector: Diversified Investments | |
| MarketCap: 14885.2 Millions | |
| Recent Price: 58.54 Smart Investing & Trading Score: 61 | |
| Day Percent Change: -4.81% Day Change: -2.96 | |
| Week Change: -3% Year-to-date Change: 0.7% | |
| NDAQ Links: Profile News Message Board | |
| Charts:- Daily , Weekly | |
| Add NDAQ to Watchlist: View: Get NDAQ Trend Analysis ➞ | |
 | AJG Arthur J. Gallagher & Co. |
| Sector: Financials | |
| SubSector: Insurance Brokers | |
| MarketCap: 14852.2 Millions | |
| Recent Price: 234.50 Smart Investing & Trading Score: 51 | |
| Day Percent Change: -0.98% Day Change: -2.31 | |
| Week Change: -0.88% Year-to-date Change: 4.3% | |
| AJG Links: Profile News Message Board | |
| Charts:- Daily , Weekly | |
| Add AJG to Watchlist: View: Get AJG Trend Analysis ➞ | |
 | MTB M&T Bank Corporation |
| Sector: Financials | |
| SubSector: Regional - Northeast Banks | |
| MarketCap: 13950.9 Millions | |
| Recent Price: 146.46 Smart Investing & Trading Score: 88 | |
| Day Percent Change: -1.02% Day Change: -1.50 | |
| Week Change: 2.14% Year-to-date Change: 6.8% | |
| MTB Links: Profile News Message Board | |
| Charts:- Daily , Weekly | |
| Add MTB to Watchlist: View: Get MTB Trend Analysis ➞ | |
 | BXP Boston Properties, Inc. |
| Sector: Financials | |
| SubSector: REIT - Office | |
| MarketCap: 13788.6 Millions | |
| Recent Price: 60.82 Smart Investing & Trading Score: 22 | |
| Day Percent Change: -3.37% Day Change: -2.12 | |
| Week Change: 1.03% Year-to-date Change: -13.3% | |
| BXP Links: Profile News Message Board | |
| Charts:- Daily , Weekly | |
| Add BXP to Watchlist: View: Get BXP Trend Analysis ➞ | |
 | EFX Equifax Inc. |
| Sector: Financials | |
| SubSector: Credit Services | |
| MarketCap: 13754.6 Millions | |
| Recent Price: 221.35 Smart Investing & Trading Score: 25 | |
| Day Percent Change: -1.93% Day Change: -4.36 | |
| Week Change: 2.38% Year-to-date Change: -10.5% | |
| EFX Links: Profile News Message Board | |
| Charts:- Daily , Weekly | |
| Add EFX to Watchlist: View: Get EFX Trend Analysis ➞ | |
| For tabular summary view of above stock list: Summary View ➞ 0 - 25 , 25 - 50 , 50 - 75 , 75 - 100 | ||
| Click To Change The Sort Order: By Market Cap or Company Size Performance: Year-to-date, Week and Day | |
| Select Chart Type: | ||
|
Best Stocks Today 12Stocks.com |
© 2024 12Stocks.com Terms & Conditions Privacy Contact Us
All Information Provided Only For Education And Not To Be Used For Investing or Trading. See Terms & Conditions


One More Thing ... Get Best Stocks Delivered Daily!
Never Ever Miss A Move With Our Top Ten Stocks Lists
Find Best Stocks In Any Market - Bull or Bear Market
Take A Peek At Our Top Ten Stocks Lists: Daily, Weekly, Year-to-Date & Top Trends
Find Best Stocks In Any Market - Bull or Bear Market
Take A Peek At Our Top Ten Stocks Lists: Daily, Weekly, Year-to-Date & Top Trends
S&P 500 Stocks With Best Up Trends [0-bearish to 100-bullish]: Newmont [100], Dover [100], Chipotle Mexican[100], Merck [100], Boston Scientific[100], Northrop Grumman[100], Coca-Cola [100], Altria [100], Procter & Gamble[100], Hess [100], Analog Devices[100]
Best S&P 500 Stocks Year-to-Date:
NVIDIA [63.06%], Constellation [59.76%], NRG [38.59%], Targa Resources[34%], Marathon [33.53%], Chipotle Mexican[32.97%], Progressive [31.92%], Diamondback [31.62%], Eaton [30.71%], Micron [29.9%], Western Digital[28.49%] Best S&P 500 Stocks This Week:
Hasbro [14.94%], Tyler Technologies[14.26%], Globe Life[14.22%], Wabtec [11.99%], Microchip [11.17%], Tesla [10.83%], Teradyne [10.63%], NXP Semiconductors[10.09%], Texas Instruments[9.39%], Boston Scientific[9.19%], Monolithic Power[9.02%] Best S&P 500 Stocks Daily:
Tyler Technologies[9.99%], Newmont [5.84%], Carrier Global[5.73%], Teradyne [5.44%], ProShares UltraPro[4.55%], Dover [4.44%], Union Pacific[4.18%], Chipotle Mexican[3.90%], Keurig Dr[3.77%], Merck [3.15%], Rollins [3.03%]