
 Login Sign Up


| |||||
 |  | ||||

| 12Stocks.com Market Intelligence |
Best S&P 500 Stocks
|
On this page, you will find the most comprehensive analysis of S&P 500 stocks and ETFs - from latest trends to performances to charts ➞. First, here are the year-to-date (YTD) performances of the most requested S&P 500 stocks at 12Stocks.com (click stock for review):
| NVIDIA 66% | ||
| Caterpillar 23% | ||
| Amazon.com 18% | ||
| Merck 16% | ||
| Google 13% | ||
| JPMorgan Chase 13% | ||
| Walmart 12% | ||
| Goldman Sachs 10% | ||
| Chevron 9% | ||
| Microsoft 8% | ||
| Johnson & Johnson -5% | ||
| McDonald s -7% | ||
| Starbucks -8% | ||
| Apple -13% | ||
| Gilead -17% | ||
| Intel -32% | ||
| Boeing -35% | ||
| Quick: S&P 500 Stocks Lists: Performances & Trends, S&P 500 Stock Charts
Sort S&P 500 stocks: Daily, Weekly, Year-to-Date, Market Cap & Trends. Filter S&P 500 stocks list by sector: Show all, Tech, Finance, Energy, Staples, Retail, Industrial, Materials, Utilities and HealthCare |
| 12Stocks.com S&P 500 Stocks Performances & Trends Daily Report | |||||||||
|
| 
The overall Smart Investing & Trading Score is 58 (0-bearish to 100-bullish) which puts S&P 500 index in short term neutral trend. The Smart Investing & Trading Score from previous trading session is 51 and hence an improvement of trend. | ||||||||
Here are the Smart Investing & Trading Scores of the most requested S&P 500 stocks at 12Stocks.com (click stock name for detailed review):
|


| 12Stocks.com: Top Performing S&P 500 Index Stocks | ||||||||||||||||||||||||||||||||||||||||||||||||
 The top performing S&P 500 Index stocks year to date are
Now, more recently, over last week, the top performing S&P 500 Index stocks on the move are


|
||||||||||||||||||||||||||||||||||||||||||||||||
| 12Stocks.com: Investing in S&P 500 Index with Stocks | |
|
The following table helps investors and traders sort through current performance and trends (as measured by Smart Investing & Trading Score) of various
stocks in the S&P 500 Index. Quick View: Move mouse or cursor over stock symbol (ticker) to view short-term technical chart and over stock name to view long term chart. Click on  to add stock symbol to your watchlist and to add stock symbol to your watchlist and  to view watchlist. Click on any ticker or stock name for detailed market intelligence report for that stock. to view watchlist. Click on any ticker or stock name for detailed market intelligence report for that stock. |
12Stocks.com Performance of Stocks in S&P 500 Index
| Ticker | Stock Name | Watchlist | Category | Recent Price | Smart Investing & Trading Score | Change % | YTD Change% |
| ESS | Essex Property |   | Financials | 242.15 | 100 | 0.94% | -2.34% |
| CINF | Cincinnati Financial | | Financials | 120.83 | 83 | -0.11% | 16.79% |
| AMP | Ameriprise Financial | | Financials | 407.69 | 26 | -3.25% | 7.33% |
| CBRE | CBRE | | Financials | 87.11 | 58 | 1.24% | -6.42% |
| HIG | Hartford Financial | | Financials | 100.03 | 75 | 0.21% | 24.45% |
| MKTX | MarketAxess Holdings | | Financials | 204.77 | 35 | 0.17% | -30.08% |
| ACGL | Arch Capital | | Financials | 93.78 | 75 | -0.07% | 26.27% |
| MAA | Mid-America Apartment | | Financials | 127.49 | 76 | 0.02% | -5.18% |
| EXR | Extra Space | | Financials | 133.28 | 35 | 0.41% | -16.87% |
| VTR | Ventas | | Financials | 43.56 | 74 | 1.00% | -12.60% |
| L | Loews | | Financials | 76.72 | 88 | 0.31% | 10.25% |
| BRO | Brown & Brown | | Financials | 82.93 | 58 | 0.52% | 16.62% |
| FITB | Fifth Third | | Financials | 37.06 | 100 | 1.40% | 7.45% |
| UDR | UDR | | Financials | 37.27 | 100 | 0.70% | -2.66% |
| KEY | KeyCorp | | Financials | 14.72 | 61 | 0.55% | 2.22% |
| WRB | W. R. | | Financials | 79.08 | 0 | -5.21% | 11.82% |
| INVH | Invitation Homes | | Financials | 34.13 | 75 | 1.04% | 0.06% |
| RJF | Raymond James | | Financials | 127.14 | 75 | 1.32% | 14.03% |
| BEN | Franklin Resources | | Financials | 25.33 | 32 | -0.98% | -14.97% |
| SYF | Synchrony Financial | | Financials | 42.86 | 100 | 1.68% | 12.23% |
| DFS | Discover Financial | | Financials | 129.24 | 95 | 2.02% | 14.98% |
| RF | Regions Financial | | Financials | 19.35 | 68 | 0.89% | -0.15% |
| CBOE | Cboe Global | | Financials | 178.82 | 30 | -1.02% | 0.15% |
| HBAN | Huntington Bancshares | | Financials | 13.63 | 83 | 0.74% | 7.15% |
| HST | Host Hotels | | Financials | 19.29 | 45 | 1.53% | -0.92% |
| For chart view version of above stock list: Chart View ➞ 0 - 25 , 25 - 50 , 50 - 75 , 75 - 100 | ||
 | Click To Change The Sort Order: By Market Cap or Company Size Performance: Year-to-date, Week and Day |  |
|
Get the most comprehensive stock market coverage daily at 12Stocks.com ➞ Best Stocks Today ➞ Best Stocks Weekly ➞ Best Stocks Year-to-Date ➞ Best Stocks Trends ➞  Best Stocks Today 12Stocks.com Best Nasdaq Stocks ➞ Best S&P 500 Stocks ➞ Best Tech Stocks ➞ Best Biotech Stocks ➞ |
| Detailed Overview of S&P 500 Stocks |
| S&P 500 Technical Overview, Leaders & Laggards, Top S&P 500 ETF Funds & Detailed S&P 500 Stocks List, Charts, Trends & More |
| S&P 500: Technical Analysis, Trends & YTD Performance | |
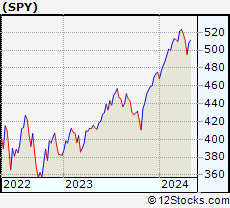
| S&P 500 index as represented by
SPY, an exchange-traded fund [ETF], holds basket of five hundred (mostly largecap) stocks from across all major sectors of the US stock market. The S&P 500 index (contains stocks like Apple and Exxon) is up by 6.38% and is currently outperforming the overall market by 0.74% year-to-date. Below is a quick view of technical charts and trends: | |
 SPY Weekly Chart |
|
| Long Term Trend: Good | |
| Medium Term Trend: Not Good | |
 SPY Daily Chart |
|
| Short Term Trend: Very Good | |
| Overall Trend Score: 58 | |
| YTD Performance: 6.38% | |
| **Trend Scores & Views Are Only For Educational Purposes And Not For Investing | |
| 12Stocks.com: Investing in S&P 500 Index using Exchange Traded Funds | |
|
The following table shows list of key exchange traded funds (ETF) that
help investors track S&P 500 index. The following list also includes leveraged ETF funds that track twice or thrice the daily returns of S&P 500 indices. Short or inverse ETF funds move in the opposite direction to the index they track and are useful during market pullbacks or during bear markets. Quick View: Move mouse or cursor over ETF symbol (ticker) to view short-term technical chart and over ETF name to view long term chart. Click on ticker or stock name for detailed view. Click on to add stock symbol to your watchlist and to view watchlist. |
12Stocks.com List of ETFs that track S&P 500 Index
| Ticker | ETF Name | Watchlist | Recent Price | Smart Investing & Trading Score | Change % | Week % | Year-to-date % |
| SPY | SPDR S&P 500 ETF | | 505.65 | 58 | 1.19 | 2.12 | 6.38% |
| IVV | iShares Core S&P 500 ETF | | 508.17 | 63 | 2.00 | 2.14 | 6.39% |
| VOO | Vanguard 500 ETF | | 464.84 | 63 | 2.03 | 2.14 | 6.42% |
| OEF | iShares S&P 100 | | 239.95 | 58 | 1.33 | 2.25 | 7.41% |
| SSO | ProShares Ultra S&P500 | | 72.04 | 58 | 2.43 | 4.24 | 10.71% |
| UPRO | ProShares UltraPro S&P500 | | 62.93 | 58 | 3.59 | 6.37 | 14.96% |
| SPXL | Direxion Daily S&P500 Bull 3X ETF | | 119.51 | 63 | 3.52 | 6.18 | 14.92% |
| SH | ProShares Short S&P500 | | 12.34 | 42 | -1.20 | -1.99 | -5% |
| SDS | ProShares UltraShort S&P500 | | 26.78 | 37 | -2.30 | -4.01 | -10.49% |
| SPXU | ProShares UltraPro Short S&P500 | | 35.99 | 42 | -3.62 | -6.1 | -16.3% |
| SPXS | Direxion Daily S&P 500 Bear 3X ETF | | 9.75 | 32 | -5.43 | -5.89 | -15.58% |
| 12Stocks.com: Charts, Trends, Fundamental Data and Performances of S&P 500 Stocks | |
|
We now take in-depth look at all S&P 500 stocks including charts, multi-period performances and overall trends (as measured by Smart Investing & Trading Score). One can sort S&P 500 stocks (click link to choose) by Daily, Weekly and by Year-to-Date performances. Also, one can sort by size of the company or by market capitalization. |
| Select Your Default Chart Type: | |||||
| |||||
| Click on stock symbol or name for detailed view. Click on to add stock symbol to your watchlist and to view watchlist. Quick View: Move mouse or cursor over "Daily" to quickly view daily technical stock chart and over "Weekly" to view weekly technical stock chart. | |||||

 | ESS Essex Property Trust, Inc. |
| Sector: Financials | |
| SubSector: REIT - Residential | |
| MarketCap: 13725.5 Millions | |
| Recent Price: 242.15 Smart Investing & Trading Score: 100 | |
| Day Percent Change: 0.94% Day Change: 2.26 | |
| Week Change: 2.97% Year-to-date Change: -2.3% | |
| ESS Links: Profile News Message Board | |
| Charts:- Daily , Weekly | |
| Add ESS to Watchlist: View: Get ESS Trend Analysis ➞ | |
 | CINF Cincinnati Financial Corporation |
| Sector: Financials | |
| SubSector: Property & Casualty Insurance | |
| MarketCap: 13637 Millions | |
| Recent Price: 120.83 Smart Investing & Trading Score: 83 | |
| Day Percent Change: -0.11% Day Change: -0.13 | |
| Week Change: 0.73% Year-to-date Change: 16.8% | |
| CINF Links: Profile News Message Board | |
| Charts:- Daily , Weekly | |
| Add CINF to Watchlist: View: Get CINF Trend Analysis ➞ | |
 | AMP Ameriprise Financial, Inc. |
| Sector: Financials | |
| SubSector: Asset Management | |
| MarketCap: 13270.5 Millions | |
| Recent Price: 407.69 Smart Investing & Trading Score: 26 | |
| Day Percent Change: -3.25% Day Change: -13.69 | |
| Week Change: -2.23% Year-to-date Change: 7.3% | |
| AMP Links: Profile News Message Board | |
| Charts:- Daily , Weekly | |
| Add AMP to Watchlist: View: Get AMP Trend Analysis ➞ | |
 | CBRE CBRE Group, Inc. |
| Sector: Financials | |
| SubSector: Property Management | |
| MarketCap: 12799.2 Millions | |
| Recent Price: 87.11 Smart Investing & Trading Score: 58 | |
| Day Percent Change: 1.24% Day Change: 1.07 | |
| Week Change: 2.6% Year-to-date Change: -6.4% | |
| CBRE Links: Profile News Message Board | |
| Charts:- Daily , Weekly | |
| Add CBRE to Watchlist: View: Get CBRE Trend Analysis ➞ | |
 | HIG The Hartford Financial Services Group, Inc. |
| Sector: Financials | |
| SubSector: Property & Casualty Insurance | |
| MarketCap: 12582.8 Millions | |
| Recent Price: 100.03 Smart Investing & Trading Score: 75 | |
| Day Percent Change: 0.21% Day Change: 0.21 | |
| Week Change: 1.09% Year-to-date Change: 24.5% | |
| HIG Links: Profile News Message Board | |
| Charts:- Daily , Weekly | |
| Add HIG to Watchlist: View: Get HIG Trend Analysis ➞ | |
 | MKTX MarketAxess Holdings Inc. |
| Sector: Financials | |
| SubSector: Investment Brokerage - National | |
| MarketCap: 12431.5 Millions | |
| Recent Price: 204.77 Smart Investing & Trading Score: 35 | |
| Day Percent Change: 0.17% Day Change: 0.34 | |
| Week Change: 0.37% Year-to-date Change: -30.1% | |
| MKTX Links: Profile News Message Board | |
| Charts:- Daily , Weekly | |
| Add MKTX to Watchlist: View: Get MKTX Trend Analysis ➞ | |
 | ACGL Arch Capital Group Ltd. |
| Sector: Financials | |
| SubSector: Property & Casualty Insurance | |
| MarketCap: 12350.9 Millions | |
| Recent Price: 93.78 Smart Investing & Trading Score: 75 | |
| Day Percent Change: -0.07% Day Change: -0.07 | |
| Week Change: 0.91% Year-to-date Change: 26.3% | |
| ACGL Links: Profile News Message Board | |
| Charts:- Daily , Weekly | |
| Add ACGL to Watchlist: View: Get ACGL Trend Analysis ➞ | |
 | MAA Mid-America Apartment Communities, Inc. |
| Sector: Financials | |
| SubSector: REIT - Residential | |
| MarketCap: 11385.5 Millions | |
| Recent Price: 127.49 Smart Investing & Trading Score: 76 | |
| Day Percent Change: 0.02% Day Change: 0.02 | |
| Week Change: 1.12% Year-to-date Change: -5.2% | |
| MAA Links: Profile News Message Board | |
| Charts:- Daily , Weekly | |
| Add MAA to Watchlist: View: Get MAA Trend Analysis ➞ | |
 | EXR Extra Space Storage Inc. |
| Sector: Financials | |
| SubSector: REIT - Industrial | |
| MarketCap: 11203.9 Millions | |
| Recent Price: 133.28 Smart Investing & Trading Score: 35 | |
| Day Percent Change: 0.41% Day Change: 0.54 | |
| Week Change: 0.62% Year-to-date Change: -16.9% | |
| EXR Links: Profile News Message Board | |
| Charts:- Daily , Weekly | |
| Add EXR to Watchlist: View: Get EXR Trend Analysis ➞ | |
 | VTR Ventas, Inc. |
| Sector: Financials | |
| SubSector: REIT - Healthcare Facilities | |
| MarketCap: 11180.4 Millions | |
| Recent Price: 43.56 Smart Investing & Trading Score: 74 | |
| Day Percent Change: 1.00% Day Change: 0.43 | |
| Week Change: 1% Year-to-date Change: -12.6% | |
| VTR Links: Profile News Message Board | |
| Charts:- Daily , Weekly | |
| Add VTR to Watchlist: View: Get VTR Trend Analysis ➞ | |
 | L Loews Corporation |
| Sector: Financials | |
| SubSector: Property & Casualty Insurance | |
| MarketCap: 10768.2 Millions | |
| Recent Price: 76.72 Smart Investing & Trading Score: 88 | |
| Day Percent Change: 0.31% Day Change: 0.24 | |
| Week Change: 1.43% Year-to-date Change: 10.3% | |
| L Links: Profile News Message Board | |
| Charts:- Daily , Weekly | |
| Add L to Watchlist: View: Get L Trend Analysis ➞ | |
 | BRO Brown & Brown, Inc. |
| Sector: Financials | |
| SubSector: Insurance Brokers | |
| MarketCap: 10475.7 Millions | |
| Recent Price: 82.93 Smart Investing & Trading Score: 58 | |
| Day Percent Change: 0.52% Day Change: 0.43 | |
| Week Change: 0.92% Year-to-date Change: 16.6% | |
| BRO Links: Profile News Message Board | |
| Charts:- Daily , Weekly | |
| Add BRO to Watchlist: View: Get BRO Trend Analysis ➞ | |
 | FITB Fifth Third Bancorp |
| Sector: Financials | |
| SubSector: Regional - Midwest Banks | |
| MarketCap: 10197 Millions | |
| Recent Price: 37.06 Smart Investing & Trading Score: 100 | |
| Day Percent Change: 1.40% Day Change: 0.51 | |
| Week Change: 2.23% Year-to-date Change: 7.5% | |
| FITB Links: Profile News Message Board | |
| Charts:- Daily , Weekly | |
| Add FITB to Watchlist: View: Get FITB Trend Analysis ➞ | |
 | UDR UDR, Inc. |
| Sector: Financials | |
| SubSector: REIT - Residential | |
| MarketCap: 10180.1 Millions | |
| Recent Price: 37.27 Smart Investing & Trading Score: 100 | |
| Day Percent Change: 0.70% Day Change: 0.26 | |
| Week Change: 2.39% Year-to-date Change: -2.7% | |
| UDR Links: Profile News Message Board | |
| Charts:- Daily , Weekly | |
| Add UDR to Watchlist: View: Get UDR Trend Analysis ➞ | |
 | KEY KeyCorp |
| Sector: Financials | |
| SubSector: Regional - Midwest Banks | |
| MarketCap: 10045 Millions | |
| Recent Price: 14.72 Smart Investing & Trading Score: 61 | |
| Day Percent Change: 0.55% Day Change: 0.08 | |
| Week Change: 0.62% Year-to-date Change: 2.2% | |
| KEY Links: Profile News Message Board | |
| Charts:- Daily , Weekly | |
| Add KEY to Watchlist: View: Get KEY Trend Analysis ➞ | |
 | WRB W. R. Berkley Corporation |
| Sector: Financials | |
| SubSector: Property & Casualty Insurance | |
| MarketCap: 9863.82 Millions | |
| Recent Price: 79.08 Smart Investing & Trading Score: 0 | |
| Day Percent Change: -5.21% Day Change: -4.35 | |
| Week Change: -4.03% Year-to-date Change: 11.8% | |
| WRB Links: Profile News Message Board | |
| Charts:- Daily , Weekly | |
| Add WRB to Watchlist: View: Get WRB Trend Analysis ➞ | |
 | INVH Invitation Homes Inc. |
| Sector: Financials | |
| SubSector: Real Estate Development | |
| MarketCap: 9782.89 Millions | |
| Recent Price: 34.13 Smart Investing & Trading Score: 75 | |
| Day Percent Change: 1.04% Day Change: 0.35 | |
| Week Change: 1.67% Year-to-date Change: 0.1% | |
| INVH Links: Profile News Message Board | |
| Charts:- Daily , Weekly | |
| Add INVH to Watchlist: View: Get INVH Trend Analysis ➞ | |
 | RJF Raymond James Financial, Inc. |
| Sector: Financials | |
| SubSector: Investment Brokerage - Regional | |
| MarketCap: 9490.65 Millions | |
| Recent Price: 127.14 Smart Investing & Trading Score: 75 | |
| Day Percent Change: 1.32% Day Change: 1.66 | |
| Week Change: 2.86% Year-to-date Change: 14.0% | |
| RJF Links: Profile News Message Board | |
| Charts:- Daily , Weekly | |
| Add RJF to Watchlist: View: Get RJF Trend Analysis ➞ | |
 | BEN Franklin Resources, Inc. |
| Sector: Financials | |
| SubSector: Asset Management | |
| MarketCap: 9419.73 Millions | |
| Recent Price: 25.33 Smart Investing & Trading Score: 32 | |
| Day Percent Change: -0.98% Day Change: -0.25 | |
| Week Change: 0.72% Year-to-date Change: -15.0% | |
| BEN Links: Profile News Message Board | |
| Charts:- Daily , Weekly | |
| Add BEN to Watchlist: View: Get BEN Trend Analysis ➞ | |
 | SYF Synchrony Financial |
| Sector: Financials | |
| SubSector: Credit Services | |
| MarketCap: 9297.28 Millions | |
| Recent Price: 42.86 Smart Investing & Trading Score: 100 | |
| Day Percent Change: 1.68% Day Change: 0.71 | |
| Week Change: 3.1% Year-to-date Change: 12.2% | |
| SYF Links: Profile News Message Board | |
| Charts:- Daily , Weekly | |
| Add SYF to Watchlist: View: Get SYF Trend Analysis ➞ | |
 | DFS Discover Financial Services |
| Sector: Financials | |
| SubSector: Credit Services | |
| MarketCap: 9228.88 Millions | |
| Recent Price: 129.24 Smart Investing & Trading Score: 95 | |
| Day Percent Change: 2.02% Day Change: 2.56 | |
| Week Change: 3.1% Year-to-date Change: 15.0% | |
| DFS Links: Profile News Message Board | |
| Charts:- Daily , Weekly | |
| Add DFS to Watchlist: View: Get DFS Trend Analysis ➞ | |
 | RF Regions Financial Corporation |
| Sector: Financials | |
| SubSector: Regional - Southeast Banks | |
| MarketCap: 8936.25 Millions | |
| Recent Price: 19.35 Smart Investing & Trading Score: 68 | |
| Day Percent Change: 0.89% Day Change: 0.17 | |
| Week Change: 2.38% Year-to-date Change: -0.2% | |
| RF Links: Profile News Message Board | |
| Charts:- Daily , Weekly | |
| Add RF to Watchlist: View: Get RF Trend Analysis ➞ | |
 | CBOE Cboe Global Markets, Inc. |
| Sector: Financials | |
| SubSector: Diversified Investments | |
| MarketCap: 8834.5 Millions | |
| Recent Price: 178.82 Smart Investing & Trading Score: 30 | |
| Day Percent Change: -1.02% Day Change: -1.84 | |
| Week Change: -1.12% Year-to-date Change: 0.2% | |
| CBOE Links: Profile News Message Board | |
| Charts:- Daily , Weekly | |
| Add CBOE to Watchlist: View: Get CBOE Trend Analysis ➞ | |
 | HBAN Huntington Bancshares Incorporated |
| Sector: Financials | |
| SubSector: Regional - Midwest Banks | |
| MarketCap: 8468.1 Millions | |
| Recent Price: 13.63 Smart Investing & Trading Score: 83 | |
| Day Percent Change: 0.74% Day Change: 0.10 | |
| Week Change: 2.64% Year-to-date Change: 7.2% | |
| HBAN Links: Profile News Message Board | |
| Charts:- Daily , Weekly | |
| Add HBAN to Watchlist: View: Get HBAN Trend Analysis ➞ | |
 | HST Host Hotels & Resorts, Inc. |
| Sector: Financials | |
| SubSector: REIT - Hotel/Motel | |
| MarketCap: 8253.74 Millions | |
| Recent Price: 19.29 Smart Investing & Trading Score: 45 | |
| Day Percent Change: 1.53% Day Change: 0.29 | |
| Week Change: 3.1% Year-to-date Change: -0.9% | |
| HST Links: Profile News Message Board | |
| Charts:- Daily , Weekly | |
| Add HST to Watchlist: View: Get HST Trend Analysis ➞ | |
| For tabular summary view of above stock list: Summary View ➞ 0 - 25 , 25 - 50 , 50 - 75 , 75 - 100 | ||
| Click To Change The Sort Order: By Market Cap or Company Size Performance: Year-to-date, Week and Day | |
| Select Chart Type: | ||
|
Best Stocks Today 12Stocks.com |
© 2024 12Stocks.com Terms & Conditions Privacy Contact Us
All Information Provided Only For Education And Not To Be Used For Investing or Trading. See Terms & Conditions


One More Thing ... Get Best Stocks Delivered Daily!
Never Ever Miss A Move With Our Top Ten Stocks Lists
Find Best Stocks In Any Market - Bull or Bear Market
Take A Peek At Our Top Ten Stocks Lists: Daily, Weekly, Year-to-Date & Top Trends
Find Best Stocks In Any Market - Bull or Bear Market
Take A Peek At Our Top Ten Stocks Lists: Daily, Weekly, Year-to-Date & Top Trends
S&P 500 Stocks With Best Up Trends [0-bearish to 100-bullish]: Danaher [100], Kimberly-Clark [100], Quest Diagnostics[100], Hasbro [100], Philip Morris[100], Citi [100], American Express[100], Truist Financial[100], Morgan Stanley[100], Federal Realty[100], Bank of America[100]
Best S&P 500 Stocks Year-to-Date:
NVIDIA [66.44%], Constellation [60.75%], Meta Platforms[40.09%], NRG [38.28%], Marathon [34.57%], Progressive [34.37%], Targa Resources[33.54%], Western Digital[33.51%], Micron [31.78%], Diamondback [31.78%], United Airlines[30.95%] Best S&P 500 Stocks This Week:
Globe Life[13.52%], General Electric[9.83%], NVIDIA [8.17%], Danaher [7.47%], Kimberly-Clark [7.26%], Pulte [6.95%], Norwegian Cruise[6.83%], Ford Motor[6.59%], Enphase [6.57%], General Motors[6.44%], Quest Diagnostics[6.43%] Best S&P 500 Stocks Daily:
Globe Life[14.11%], General Electric[8.28%], Danaher [7.21%], Kimberly-Clark [5.51%], Norwegian Cruise[5.39%], United Rentals[5.09%], Quest Diagnostics[5.08%], Builders FirstSource[5.07%], Thermo Fisher[4.78%], Waters [4.70%], Pulte [4.57%]