
 Login Sign Up


| |||||
 |  | ||||

| 12Stocks.com Market Intelligence |
Best Latin America Stocks
|
|
| Quick Read: Top Latin America Stocks By Performances & Trends: Daily, Weekly, Year-to-Date, Market Cap (Size) & Technical Trends | |||
| Best Latin America Views: Quick Browse View, Summary & Slide Show | |||
| 12Stocks.com Latin America Stocks Performances & Trends Daily | |||||||||
|
|  The overall market intelligence score is 40 (0-bearish to 100-bullish) which puts Latin America index in short term bearish to neutral trend. The market intelligence score from previous trading session is 50 and a deterioration of trend continues.
| ||||||||
Here are the market intelligence trend scores of the most requested Latin America stocks at 12Stocks.com (click stock name for detailed review):
| |||||||||||||||||||||||||
| Scroll down this page for most comprehensive review of Latin America stocks by performance, trends, technical analysis, charts, fund plays & more | |||||||||||||||||||||||||


| 12Stocks.com: Top Performing Latin America Index Stocks | ||||||||||||||||||||||||||||||||||||||||||||||||
 The top performing Latin America Index stocks year to date are
Now, more recently, over last week, the top performing Latin America Index stocks on the move are


|
||||||||||||||||||||||||||||||||||||||||||||||||
| 12Stocks.com: Investing in Latin America Index with Stocks | |
|
The following table helps investors and traders sort through current performance and trends (as measured by market intelligence score) of various
stocks in the Latin America Index. Quick View: Move mouse or cursor over stock symbol (ticker) to view short-term technical chart and over stock name to view long term chart. Click on  to add stock symbol to your watchlist and to add stock symbol to your watchlist and  to view watchlist. Click on any ticker or stock name for detailed market intelligence report for that stock. to view watchlist. Click on any ticker or stock name for detailed market intelligence report for that stock. |
12Stocks.com Performance of Stocks in Latin America Index
| Ticker | Stock Name | Watchlist | Category | Recent Price | Market Intelligence Score | Change % | YTD Change% |
| SRRA | Sierra Oncology |   | Health Care | 14.95 | 30 | 3.68 | 0.00% |
| TRQ | Turquoise Hill | | Materials | 167.45 | 100 | 3.40 | 0.00% |
| NAK | Northern Dynasty | | Materials | 1.22 | 70 | 3.39 | 79.41% |
| RPTX | Repare | | Health Care | 1.85 | 100 | 3.35 | 40.15% |
| CRESY | Cresud ADR | | Industrials | 9.44 | 70 | 3.06 | -29.45% |
| ACHV | Achieve Life | | Health Care | 3.19 | 100 | 2.90 | -13.55% |
| TRIL | Trillium | | Health Care | 56.00 | 80 | 2.88 | 0.00% |
| TMDI | Titan Medical | | Health Care | 0.16 | 20 | 2.87 | 0.00% |
| CEPU | Central Puerto | | Utilities | 7.98 | 10 | 2.84 | -49.11% |
| MFCB | MFC Bancorp | | Materials | 0.73 | 20 | 2.82 | 0.00% |
| MGA | Magna | | Services & Goods | 48.50 | 90 | 2.80 | 20.74% |
| GOOS | Canada Goose | | Services & Goods | 14.50 | 100 | 2.69 | 46.02% |
| CSIQ | Canadian Solar | | Technology | 15.26 | 100 | 2.48 | 26.74% |
| TGA | TransGlobe Energy | | Energy | 0.83 | 0 | 2.47 | 0.00% |
| TEO | Telecom Argentina | | Technology | 7.45 | 70 | 2.34 | -46.01% |
| VLRS | Controladora Vuela | | Industrials | 6.99 | 90 | 2.34 | -5.54% |
| QSR | Restaurant Brands | | Services & Goods | 67.68 | 90 | 2.30 | 5.17% |
| NSU | Nevsun Resources | | Materials | 23.97 | 100 | 2.30 | 0.00% |
| GFA | Gafisa S.A | | Industrials | 11.29 | 10 | 2.26 | 0.00% |
| GPL | Great Panther | | Materials | 32.25 | 100 | 2.19 | 0.00% |
| EXFO | EXFO | | Technology | 32.25 | 100 | 2.19 | 0.00% |
| TGS | Transportadora de | | Energy | 20.78 | 0 | 2.16 | -35.86% |
| POT | Potash | | Materials | 831.27 | 80 | 2.11 | 0.00% |
| AMX | America Movil | | Technology | 21.14 | 80 | 2.08 | 48.94% |
| USGO | U.S. GoldMining | | Materials | 13.20 | 43 | 2.05 | -7.43% |
| To view more stocks, click on Next / Previous arrows or select different range: 0 - 25 , 25 - 50 , 50 - 75 , 75 - 100 , 100 - 125 , 125 - 150 , 150 - 175 , 175 - 200 , 200 - 225 , 225 - 250 , 250 - 275 , 275 - 300 , 300 - 325 | ||
 | Click To Change The Sort Order: By Market Cap or Company Size Performance: Year-to-date, Week and Day |  |
| Detailed Overview Of Latin America Stocks |
| Latin America Technical Overview, Leaders & Laggards, Top Latin America ETF Funds & Detailed Latin America Stocks List, Charts, Trends & More |
| Latin America: Technical Analysis, Trends & YTD Performance | |
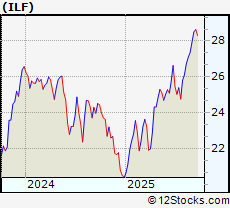
 ILF Weekly Chart |
|
| Long Term Trend: Very Good | |
| Medium Term Trend: Very Good | |
 ILF Daily Chart |
|
| Short Term Trend: Not Good | |
| Overall Trend Score: 40 | |
| YTD Performance: 37.1981% | |
| **Trend Scores & Views Are Only For Educational Purposes And Not For Investing | |
| 12Stocks.com: Investing in Latin America Index using Exchange Traded Funds | |
|
The following table shows list of key exchange traded funds (ETF) that
help investors play Latin America stock market. For detailed view, check out our ETF Funds section of our website. Quick View: Move mouse or cursor over ETF symbol (ticker) to view short-term technical chart and over ETF name to view long term chart. Click on ticker or stock name for detailed view. Click on to add stock symbol to your watchlist and to view watchlist. |
12Stocks.com List of ETFs that track Latin America Index
| Ticker | ETF Name | Watchlist | Recent Price | Market Intelligence Score | Change % | Week % | Year-to-date % |
| LBJ | Latin America Bull | | 60.40 | 50 | 0 | 0 | 0% |
| DBBR | Brazil Hedgd Eq | | 54.06 | 70 | -0.478645 | 0.632911 | 0% |
| FBZ | Brazil AlphaDEX | | 11.52 | 30 | 0 | 0 | 29.5955% |
| 12Stocks.com: Charts, Trends, Fundamental Data and Performances of Latin America Stocks | |
|
We now take in-depth look at all Latin America stocks including charts, multi-period performances and overall trends (as measured by market intelligence score). One can sort Latin America stocks (click link to choose) by Daily, Weekly and by Year-to-Date performances. Also, one can sort by size of the company or by market capitalization. |
| Select Your Default Chart Type: | |||||
| |||||
| Click on stock symbol or name for detailed view. Click on to add stock symbol to your watchlist and to view watchlist. Quick View: Move mouse or cursor over "Daily" to quickly view daily technical stock chart and over "Weekly" to view weekly technical stock chart. | |||||

 | SRRA Sierra Oncology, Inc. |
| Sector: Health Care | |
| SubSector: Biotechnology | |
| MarketCap: 125.185 Millions | |
| Recent Price: 14.95 Market Intelligence Score: 30 | |
| Day Percent Change: 3.67545% Day Change: -9999 | |
| Week Change: -72.8132% Year-to-date Change: 0.0% | |
| SRRA Links: Profile News Message Board | |
| Charts:- Daily , Weekly | |
| Add SRRA to Watchlist: View: Get Complete SRRA Trend Analysis ➞ | |
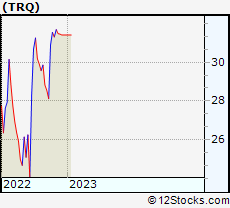 | TRQ Turquoise Hill Resources Ltd. |
| Sector: Materials | |
| SubSector: Copper | |
| MarketCap: 821.257 Millions | |
| Recent Price: 167.45 Market Intelligence Score: 100 | |
| Day Percent Change: 3.40249% Day Change: -9999 | |
| Week Change: 433.11% Year-to-date Change: 0.0% | |
| TRQ Links: Profile News Message Board | |
| Charts:- Daily , Weekly | |
| Add TRQ to Watchlist: View: Get Complete TRQ Trend Analysis ➞ | |
 | NAK Northern Dynasty Minerals Ltd |
| Sector: Materials | |
| SubSector: Other Industrial Metals & Mining | |
| MarketCap: 455.23 Millions | |
| Recent Price: 1.22 Market Intelligence Score: 70 | |
| Day Percent Change: 3.38983% Day Change: 0.03 | |
| Week Change: 11.9266% Year-to-date Change: 79.4% | |
| NAK Links: Profile News Message Board | |
| Charts:- Daily , Weekly | |
| Add NAK to Watchlist: View: Get Complete NAK Trend Analysis ➞ | |
 | RPTX Repare Therapeutics Inc |
| Sector: Health Care | |
| SubSector: Biotechnology | |
| MarketCap: 72.6 Millions | |
| Recent Price: 1.85 Market Intelligence Score: 100 | |
| Day Percent Change: 3.35196% Day Change: 0.01 | |
| Week Change: 7.24638% Year-to-date Change: 40.2% | |
| RPTX Links: Profile News Message Board | |
| Charts:- Daily , Weekly | |
| Add RPTX to Watchlist: View: Get Complete RPTX Trend Analysis ➞ | |
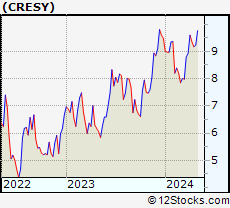 | CRESY Cresud ADR |
| Sector: Industrials | |
| SubSector: Conglomerates | |
| MarketCap: 595.06 Millions | |
| Recent Price: 9.44 Market Intelligence Score: 70 | |
| Day Percent Change: 3.05677% Day Change: 0.16 | |
| Week Change: -1.76899% Year-to-date Change: -29.4% | |
| CRESY Links: Profile News Message Board | |
| Charts:- Daily , Weekly | |
| Add CRESY to Watchlist: View: Get Complete CRESY Trend Analysis ➞ | |
 | ACHV Achieve Life Sciences Inc |
| Sector: Health Care | |
| SubSector: Biotechnology | |
| MarketCap: 144.63 Millions | |
| Recent Price: 3.19 Market Intelligence Score: 100 | |
| Day Percent Change: 2.90323% Day Change: 0.31 | |
| Week Change: 3.57143% Year-to-date Change: -13.6% | |
| ACHV Links: Profile News Message Board | |
| Charts:- Daily , Weekly | |
| Add ACHV to Watchlist: View: Get Complete ACHV Trend Analysis ➞ | |
 | TRIL Trillium Therapeutics Inc. |
| Sector: Health Care | |
| SubSector: Biotechnology | |
| MarketCap: 250.885 Millions | |
| Recent Price: 56.00 Market Intelligence Score: 80 | |
| Day Percent Change: 2.88444% Day Change: -9999 | |
| Week Change: 203.688% Year-to-date Change: 0.0% | |
| TRIL Links: Profile News Message Board | |
| Charts:- Daily , Weekly | |
| Add TRIL to Watchlist: View: Get Complete TRIL Trend Analysis ➞ | |
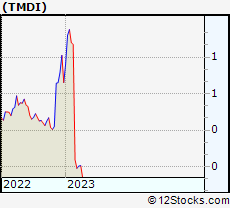 | TMDI Titan Medical Inc. |
| Sector: Health Care | |
| SubSector: Medical Appliances & Equipment | |
| MarketCap: 8.0508 Millions | |
| Recent Price: 0.16 Market Intelligence Score: 20 | |
| Day Percent Change: 2.86832% Day Change: -9999 | |
| Week Change: -2.77264% Year-to-date Change: 0.0% | |
| TMDI Links: Profile News Message Board | |
| Charts:- Daily , Weekly | |
| Add TMDI to Watchlist: View: Get Complete TMDI Trend Analysis ➞ | |
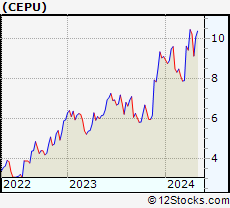 | CEPU Central Puerto ADR |
| Sector: Utilities | |
| SubSector: Utilities - Regulated Electric | |
| MarketCap: 1533.68 Millions | |
| Recent Price: 7.98 Market Intelligence Score: 10 | |
| Day Percent Change: 2.83505% Day Change: 0.12 | |
| Week Change: -11.3333% Year-to-date Change: -49.1% | |
| CEPU Links: Profile News Message Board | |
| Charts:- Daily , Weekly | |
| Add CEPU to Watchlist: View: Get Complete CEPU Trend Analysis ➞ | |
 | MFCB MFC Bancorp Ltd. |
| Sector: Materials | |
| SubSector: Industrial Metals & Minerals | |
| MarketCap: 123.17 Millions | |
| Recent Price: 0.73 Market Intelligence Score: 20 | |
| Day Percent Change: 2.8169% Day Change: -9999 | |
| Week Change: -96.4092% Year-to-date Change: 0.0% | |
| MFCB Links: Profile News Message Board | |
| Charts:- Daily , Weekly | |
| Add MFCB to Watchlist: View: Get Complete MFCB Trend Analysis ➞ | |
 | MGA Magna International Inc |
| Sector: Services & Goods | |
| SubSector: Auto Parts | |
| MarketCap: 12928.1 Millions | |
| Recent Price: 48.50 Market Intelligence Score: 90 | |
| Day Percent Change: 2.7978% Day Change: 0.57 | |
| Week Change: 5.36607% Year-to-date Change: 20.7% | |
| MGA Links: Profile News Message Board | |
| Charts:- Daily , Weekly | |
| Add MGA to Watchlist: View: Get Complete MGA Trend Analysis ➞ | |
 | GOOS Canada Goose Holdings Inc |
| Sector: Services & Goods | |
| SubSector: Apparel Manufacturing | |
| MarketCap: 1299.77 Millions | |
| Recent Price: 14.50 Market Intelligence Score: 100 | |
| Day Percent Change: 2.69122% Day Change: -0.07 | |
| Week Change: 7.24852% Year-to-date Change: 46.0% | |
| GOOS Links: Profile News Message Board | |
| Charts:- Daily , Weekly | |
| Add GOOS to Watchlist: View: Get Complete GOOS Trend Analysis ➞ | |
 | CSIQ Canadian Solar Inc |
| Sector: Technology | |
| SubSector: Solar | |
| MarketCap: 748.08 Millions | |
| Recent Price: 15.26 Market Intelligence Score: 100 | |
| Day Percent Change: 2.48489% Day Change: -2.37 | |
| Week Change: 17.8378% Year-to-date Change: 26.7% | |
| CSIQ Links: Profile News Message Board | |
| Charts:- Daily , Weekly | |
| Add CSIQ to Watchlist: View: Get Complete CSIQ Trend Analysis ➞ | |
 | TGA TransGlobe Energy Corporation |
| Sector: Energy | |
| SubSector: Independent Oil & Gas | |
| MarketCap: 31.2593 Millions | |
| Recent Price: 0.83 Market Intelligence Score: 0 | |
| Day Percent Change: 2.46914% Day Change: -9999 | |
| Week Change: -77.6882% Year-to-date Change: 0.0% | |
| TGA Links: Profile News Message Board | |
| Charts:- Daily , Weekly | |
| Add TGA to Watchlist: View: Get Complete TGA Trend Analysis ➞ | |
 | TEO Telecom Argentina S.A. ADR |
| Sector: Technology | |
| SubSector: Telecom Services | |
| MarketCap: 1070.2 Millions | |
| Recent Price: 7.45 Market Intelligence Score: 70 | |
| Day Percent Change: 2.33516% Day Change: 0.23 | |
| Week Change: -1.97368% Year-to-date Change: -46.0% | |
| TEO Links: Profile News Message Board | |
| Charts:- Daily , Weekly | |
| Add TEO to Watchlist: View: Get Complete TEO Trend Analysis ➞ | |
 | VLRS Controladora Vuela Cia De Aviacion ADR |
| Sector: Industrials | |
| SubSector: Airlines | |
| MarketCap: 706.64 Millions | |
| Recent Price: 6.99 Market Intelligence Score: 90 | |
| Day Percent Change: 2.34261% Day Change: -0.09 | |
| Week Change: 4.64072% Year-to-date Change: -5.5% | |
| VLRS Links: Profile News Message Board | |
| Charts:- Daily , Weekly | |
| Add VLRS to Watchlist: View: Get Complete VLRS Trend Analysis ➞ | |
 | QSR Restaurant Brands International Inc |
| Sector: Services & Goods | |
| SubSector: Restaurants | |
| MarketCap: 28696.9 Millions | |
| Recent Price: 67.68 Market Intelligence Score: 90 | |
| Day Percent Change: 2.29746% Day Change: 0.61 | |
| Week Change: 4.9465% Year-to-date Change: 5.2% | |
| QSR Links: Profile News Message Board | |
| Charts:- Daily , Weekly | |
| Add QSR to Watchlist: View: Get Complete QSR Trend Analysis ➞ | |
 | NSU Nevsun Resources Ltd. |
| Sector: Materials | |
| SubSector: Copper | |
| MarketCap: 738.36 Millions | |
| Recent Price: 23.97 Market Intelligence Score: 100 | |
| Day Percent Change: 2.30474% Day Change: -9999 | |
| Week Change: 402.516% Year-to-date Change: 0.0% | |
| NSU Links: Profile News Message Board | |
| Charts:- Daily , Weekly | |
| Add NSU to Watchlist: View: Get Complete NSU Trend Analysis ➞ | |
 | GFA Gafisa S.A. |
| Sector: Industrials | |
| SubSector: Residential Construction | |
| MarketCap: 304.96 Millions | |
| Recent Price: 11.29 Market Intelligence Score: 10 | |
| Day Percent Change: 2.26449% Day Change: -9999 | |
| Week Change: -43.8588% Year-to-date Change: 0.0% | |
| GFA Links: Profile News Message Board | |
| Charts:- Daily , Weekly | |
| Add GFA to Watchlist: View: Get Complete GFA Trend Analysis ➞ | |
 | GPL Great Panther Mining Limited |
| Sector: Materials | |
| SubSector: Silver | |
| MarketCap: 96.9456 Millions | |
| Recent Price: 32.25 Market Intelligence Score: 100 | |
| Day Percent Change: 2.18631% Day Change: -9999 | |
| Week Change: 33847.4% Year-to-date Change: 0.0% | |
| GPL Links: Profile News Message Board | |
| Charts:- Daily , Weekly | |
| Add GPL to Watchlist: View: Get Complete GPL Trend Analysis ➞ | |
 | EXFO EXFO Inc. |
| Sector: Technology | |
| SubSector: Communication Equipment | |
| MarketCap: 134.239 Millions | |
| Recent Price: 32.25 Market Intelligence Score: 100 | |
| Day Percent Change: 2.18631% Day Change: -9999 | |
| Week Change: 416.413% Year-to-date Change: 0.0% | |
| EXFO Links: Profile News Message Board | |
| Charts:- Daily , Weekly | |
| Add EXFO to Watchlist: View: Get Complete EXFO Trend Analysis ➞ | |
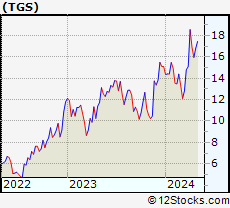 | TGS Transportadora de Gas del Sur ADR |
| Sector: Energy | |
| SubSector: Oil & Gas Integrated | |
| MarketCap: 1837.84 Millions | |
| Recent Price: 20.78 Market Intelligence Score: 0 | |
| Day Percent Change: 2.16323% Day Change: 0.89 | |
| Week Change: -10.2763% Year-to-date Change: -35.9% | |
| TGS Links: Profile News Message Board | |
| Charts:- Daily , Weekly | |
| Add TGS to Watchlist: View: Get Complete TGS Trend Analysis ➞ | |
 | POT Potash Corporation of Saskatchewan Inc. |
| Sector: Materials | |
| SubSector: Agricultural Chemicals | |
| MarketCap: 14493.6 Millions | |
| Recent Price: 831.27 Market Intelligence Score: 80 | |
| Day Percent Change: 2.10782% Day Change: -9999 | |
| Week Change: 77.1788% Year-to-date Change: 0.0% | |
| POT Links: Profile News Message Board | |
| Charts:- Daily , Weekly | |
| Add POT to Watchlist: View: Get Complete POT Trend Analysis ➞ | |
 | AMX America Movil S.A.B.DE C.V. ADR |
| Sector: Technology | |
| SubSector: Telecom Services | |
| MarketCap: 59926.6 Millions | |
| Recent Price: 21.14 Market Intelligence Score: 80 | |
| Day Percent Change: 2.07629% Day Change: -0.04 | |
| Week Change: 2.97126% Year-to-date Change: 48.9% | |
| AMX Links: Profile News Message Board | |
| Charts:- Daily , Weekly | |
| Add AMX to Watchlist: View: Get Complete AMX Trend Analysis ➞ | |
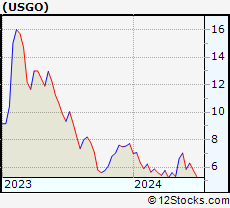 | USGO U.S. GoldMining Inc |
| Sector: Materials | |
| SubSector: Other Industrial Metals & Mining | |
| MarketCap: 114.71 Millions | |
| Recent Price: 13.20 Market Intelligence Score: 43 | |
| Day Percent Change: 2.05% Day Change: 0.16 | |
| Week Change: 0.89% Year-to-date Change: -7.4% | |
| USGO Links: Profile News Message Board | |
| Charts:- Daily , Weekly | |
| Add USGO to Watchlist: View: Get Complete USGO Trend Analysis ➞ | |
| To view more stocks, click on Next / Previous arrows or select different range: 0 - 25 , 25 - 50 , 50 - 75 , 75 - 100 , 100 - 125 , 125 - 150 , 150 - 175 , 175 - 200 , 200 - 225 , 225 - 250 , 250 - 275 , 275 - 300 , 300 - 325 | ||
| Click To Change The Sort Order: By Market Cap or Company Size Performance: Year-to-date, Week and Day | |
| Select Chart Type: | ||
 Best Stocks Today 12Stocks.com |
© 2025 12Stocks.com Terms & Conditions Privacy Contact Us
All Information Provided Only For Education And Not To Be Used For Investing or Trading. See Terms & Conditions


One More Thing ... Get Best Stocks Delivered Daily!
Never Ever Miss A Move With Our Top Ten Stocks Lists
Find Best Stocks In Any Market - Bull or Bear Market
Take A Peek At Our Top Ten Stocks Lists: Daily, Weekly, Year-to-Date & Top Trends
Find Best Stocks In Any Market - Bull or Bear Market
Take A Peek At Our Top Ten Stocks Lists: Daily, Weekly, Year-to-Date & Top Trends
Latin America Stocks With Best Up Trends [0-bearish to 100-bullish]: Milestone [100], BRP [100], Turquoise Hill[100], Canada Goose[100], Canadian Solar[100], Nevsun Resources[100], Iamgold Corp[100], Bellatrix Exploration[100], Silvercorp Metals[100], Gerdau S.A.[100], Crescent Point[100]
Best Latin America Stocks Year-to-Date:
Americas Gold[892.308%], Avino Silver[437.523%], Tower[254.565%], Gold Royalty[206.452%], EMX Royalty[189.655%], New Gold[180.534%], Celestica [169.593%], Kinross Gold[153.727%], Iamgold Corp[138.172%], Lithium Americas[124.183%], Vasta Platform[119.556%] Best Latin America Stocks This Week:
Companhia Brasileira[18587.4%], Cosan [16415.2%], Crescent Point[4066.17%], Golden Star[1837.95%], Grupo Financiero[1283.52%], Alexco Resource[690.301%], Yamana Gold[625.812%], Novelion [579.167%], Turquoise Hill[433.11%], Enerplus [415.601%], Nevsun Resources[402.516%] Best Latin America Stocks Daily:
Novelion [7.37813%], Ambipar Emergency[6.89655%], Grupo Supervielle[6.39659%], Milestone [6.34146%], Nutrien [5.50945%], Grupo Financiero[4.91926%], Mitel Networks[4.5045%], BRP [4.30981%], Empresa Distribuidora[4.06396%], Pampa Energia[4.0515%], Loma Negra[3.92707%]