
 Login Sign Up


| |||||
 |  | ||||

| 12Stocks.com Market Intelligence |
Best Financial Stocks
| In a hurry? Financial Stocks Lists: Performance Trends Table, Stock Charts
Sort Financial stocks: Daily, Weekly, Year-to-Date, Market Cap & Trends. Filter Financial stocks list by size:All Financial Large Mid-Range Small & MicroCap |
| 12Stocks.com Financial Stocks Performances & Trends Daily | |||||||||
|
|  The overall Smart Investing & Trading Score is 50 (0-bearish to 100-bullish) which puts Financial sector in short term neutral trend. The Smart Investing & Trading Score from previous trading session is 100 and hence a deterioration of trend.
| ||||||||
Here are the Smart Investing & Trading Scores of the most requested Financial stocks at 12Stocks.com (click stock name for detailed review):
|


| 12Stocks.com: Investing in Financial sector with Stocks | |
|
The following table helps investors and traders sort through current performance and trends (as measured by Smart Investing & Trading Score) of various
stocks in the Financial sector. Quick View: Move mouse or cursor over stock symbol (ticker) to view short-term Technical chart and over stock name to view long term chart. Click on  to add stock symbol to your watchlist and to add stock symbol to your watchlist and  to view watchlist. Click on any ticker or stock name for detailed market intelligence report for that stock. to view watchlist. Click on any ticker or stock name for detailed market intelligence report for that stock. |
12Stocks.com Performance of Stocks in Financial Sector
| Ticker | Stock Name | Watchlist | Category | Recent Price | Smart Investing & Trading Score | Change % | YTD Change% |
| BRO | Brown & Brown |   | Insurance | 95.31 | 30 | -1.69 | -8.68% |
| BK | Bank of New York | | Asset Mgmt | 103.82 | 60 | -1.69 | 22.24% |
| PSA | Public Storage | | REIT - Industrial | 289.57 | 20 | -1.70 | -1.03% |
| CHMI | Cherry Hill | | Mortgage | 2.87 | 40 | -1.70 | 20.42% |
| EXR | Extra Space | | REIT - Industrial | 141.13 | 30 | -1.71 | -6.30% |
| EQIX | Equinix . | | REIT - | 772.74 | 0 | -1.71 | -14.53% |
| NKSH | National Bankshares | | Regional Banks | 31.34 | 60 | -1.71 | 2.94% |
| CBFV | CB | | Regional Banks | 33.29 | 50 | -1.71 | 12.49% |
| SBSI | Southside Bancshares | | Regional Banks | 31.24 | 50 | -1.72 | -4.16% |
| AMT | American Tower | | REIT - | 200.33 | 0 | -1.73 | 10.07% |
| ZION | Zions Ban | | Regional Banks | 57.0 | 60 | -1.74 | 0.15% |
| COF | Capital One | | Credit Services | 223.27 | 50 | -1.74 | 10.28% |
| STRS | Stratus Properties | | Real Estatet | 19.46 | 40 | -1.74 | -13.15% |
| INN | Summit Hotel | | Real Estatet | 5.48 | 70 | -1.75 | -23.88% |
| CMA | Comerica | | Banks | 69.33 | 80 | -1.77 | 5.59% |
| NLY | Annaly Capital | | Mortgage | 21.19 | 90 | -1.77 | 20.52% |
| MKTX | MarketAxess | | Brokerage | 180.58 | 0 | -1.77 | -17.55% |
| IVZ | Invesco | | Asset Mgmt | 21.5 | 60 | -1.78 | 14.60% |
| CFG | Citizens | | Regional Banks | 51.35 | 60 | -1.78 | 10.12% |
| FNLC | First Bancorp | | Regional Banks | 27.18 | 50 | -1.80 | -2.15% |
| PFSI | PennyMac | | Mortgage | 110.10 | 90 | -1.80 | 1.84% |
| CIM | Chimera | | Mortgage | 14.17 | 80 | -1.81 | 2.52% |
| PROV | Provident | | S&L | 15.51 | 60 | -1.82 | -3.37% |
| MFA | MFA | | Mortgage | 10.20 | 50 | -1.83 | 2.16% |
| C | Citi | | Banks | 94.78 | 50 | -1.85 | 18.91% |
| For chart view version of above stock list: Chart View ➞ 0 - 25 , 25 - 50 , 50 - 75 , 75 - 100 , 100 - 125 , 125 - 150 , 150 - 175 , 175 - 200 , 200 - 225 , 225 - 250 , 250 - 275 , 275 - 300 , 300 - 325 , 325 - 350 , 350 - 375 , 375 - 400 , 400 - 425 , 425 - 450 , 450 - 475 , 475 - 500 , 500 - 525 , 525 - 550 , 550 - 575 , 575 - 600 , 600 - 625 , 625 - 650 , 650 - 675 , 675 - 700 , 700 - 725 , 725 - 750 , 750 - 775 , 775 - 800 , 800 - 825 , 825 - 850 , 850 - 875 , 875 - 900 , 900 - 925 , 925 - 950 , 950 - 975 , 975 - 1000 , 1000 - 1025 , 1025 - 1050 , 1050 - 1075 , 1075 - 1100 , 1100 - 1125 | ||
 | Click To Change The Sort Order: By Market Cap or Company Size Performance: Year-to-date, Week and Day |  |
|
Get the most comprehensive stock market coverage daily at 12Stocks.com ➞ Best Stocks Today ➞ Best Stocks Weekly ➞ Best Stocks Year-to-Date ➞ Best Stocks Trends ➞  Best Stocks Today 12Stocks.com Best Nasdaq Stocks ➞ Best S&P 500 Stocks ➞ Best Tech Stocks ➞ Best Biotech Stocks ➞ |
| Detailed Overview of Financial Stocks |
| Financial Technical Overview, Leaders & Laggards, Top Financial ETF Funds & Detailed Financial Stocks List, Charts, Trends & More |
| Financial Sector: Technical Analysis, Trends & YTD Performance | |
| Financial sector is composed of stocks
from banks, brokers, insurance, REITs
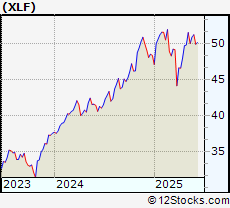
and services subsectors. Financial sector, as represented by XLF, an exchange-traded fund [ETF] that holds basket of Financial stocks (e.g, Bank of America, Goldman Sachs) is up by 4.86% and is currently underperforming the overall market by -1.66% year-to-date. Below is a quick view of Technical charts and trends: |
|
 XLF Weekly Chart |
|
| Long Term Trend: Good | |
| Medium Term Trend: Very Good | |
 XLF Daily Chart |
|
| Short Term Trend: Not Good | |
| Overall Trend Score: 50 | |
| YTD Performance: 4.86% | |
| **Trend Scores & Views Are Only For Educational Purposes And Not For Investing | |
| 12Stocks.com: Top Performing Financial Sector Stocks | ||||||||||||||||||||||||||||||||||||||||||||||||
 The top performing Financial sector stocks year to date are
Now, more recently, over last week, the top performing Financial sector stocks on the move are


|
||||||||||||||||||||||||||||||||||||||||||||||||
| 12Stocks.com: Investing in Financial Sector using Exchange Traded Funds | |
|
The following table shows list of key exchange traded funds (ETF) that
help investors track Financial Index. For detailed view, check out our ETF Funds section of our website. Quick View: Move mouse or cursor over ETF symbol (ticker) to view short-term Technical chart and over ETF name to view long term chart. Click on ticker or stock name for detailed view. Click on to add stock symbol to your watchlist and to view watchlist. |
12Stocks.com List of ETFs that track Financial Index
| Ticker | ETF Name | Watchlist | Recent Price | Smart Investing & Trading Score | Change % | Week % | Year-to-date % |
| XLF | Financial | | 53.59 | 50 | -0.74 | -0.74 | 4.86% |
| IAI | Broker-Dealers & Secs | | 174.18 | 20 | 1.92 | 0.6 | 12.72% |
| IYF | Financials | | 125.73 | 60 | -0.32 | -0.87 | 11.86% |
| IYG | Financial Services | | 89.69 | 60 | -0.27 | -1.08 | 12.5% |
| KRE | Regional Banking | | 65.51 | 70 | -0.4 | -1.29 | 3.78% |
| IXG | Global Financials | | 115.49 | 50 | -0.21 | -0.37 | 20.55% |
| VFH | Financials | | 131.97 | 60 | -0.32 | -0.85 | 9.82% |
| KBE | Bank | | 61.06 | 60 | 4.83 | 5.08 | 4.7% |
| FAS | Financial Bull 3X | | 180.01 | 50 | 4.68 | 5.86 | -1.42% |
| FAZ | Financial Bear 3X | | 4.06 | 60 | -4.81 | -5.67 | -19.26% |
| UYG | Financials | | 99.90 | 50 | 3.1 | 4.07 | 2.59% |
| IAT | Regional Banks | | 54.11 | 70 | -0.53 | -1.12 | 2.84% |
| KIE | Insurance | | 58.86 | 20 | 1.22 | 3.09 | 3.97% |
| PSCF | SmallCap Financials | | 58.90 | 50 | -0.44 | -0.75 | 2.76% |
| EUFN | Europe Financials | | 33.43 | 30 | -0.35 | -0.32 | 51.27% |
| PGF | Financial Preferred | | 14.44 | 60 | -0.14 | 0.35 | 3.03% |
| 12Stocks.com: Charts, Trends, Fundamental Data and Performances of Financial Stocks | |
|
We now take in-depth look at all Financial stocks including charts, multi-period performances and overall trends (as measured by Smart Investing & Trading Score). One can sort Financial stocks (click link to choose) by Daily, Weekly and by Year-to-Date performances. Also, one can sort by size of the company or by market capitalization. |
| Select Your Default Chart Type: | |||||
| |||||
| Click on stock symbol or name for detailed view. Click on to add stock symbol to your watchlist and to view watchlist. Quick View: Move mouse or cursor over "Daily" to quickly view daily Technical stock chart and over "Weekly" to view weekly Technical stock chart. | |||||

 | BRO Brown & Brown, Inc. |
| Sector: Financials | |
| SubSector: Insurance Brokers | |
| MarketCap: 10475.7 Millions | |
| Recent Price: 95.31 Smart Investing & Trading Score: 30 | |
| Day Percent Change: -1.69% Day Change: -1.64 | |
| Week Change: -1.69% Year-to-date Change: -8.7% | |
| BRO Links: Profile News Message Board | |
| Charts:- Daily , Weekly | |
| Add BRO to Watchlist: View: Get Complete BRO Trend Analysis ➞ | |
 | BK The Bank of New York Mellon Corporation |
| Sector: Financials | |
| SubSector: Asset Management | |
| MarketCap: 29807.5 Millions | |
| Recent Price: 103.82 Smart Investing & Trading Score: 60 | |
| Day Percent Change: -1.69% Day Change: -1.78 | |
| Week Change: -1.69% Year-to-date Change: 22.2% | |
| BK Links: Profile News Message Board | |
| Charts:- Daily , Weekly | |
| Add BK to Watchlist: View: Get Complete BK Trend Analysis ➞ | |
 | PSA Public Storage |
| Sector: Financials | |
| SubSector: REIT - Industrial | |
| MarketCap: 32733.9 Millions | |
| Recent Price: 289.57 Smart Investing & Trading Score: 20 | |
| Day Percent Change: -1.7% Day Change: -5.02 | |
| Week Change: -1.7% Year-to-date Change: -1.0% | |
| PSA Links: Profile News Message Board | |
| Charts:- Daily , Weekly | |
| Add PSA to Watchlist: View: Get Complete PSA Trend Analysis ➞ | |
 | CHMI Cherry Hill Mortgage Investment Corporation |
| Sector: Financials | |
| SubSector: Mortgage Investment | |
| MarketCap: 124.839 Millions | |
| Recent Price: 2.87 Smart Investing & Trading Score: 40 | |
| Day Percent Change: -1.7% Day Change: -0.05 | |
| Week Change: -1.7% Year-to-date Change: 20.4% | |
| CHMI Links: Profile News Message Board | |
| Charts:- Daily , Weekly | |
| Add CHMI to Watchlist: View: Get Complete CHMI Trend Analysis ➞ | |
 | EXR Extra Space Storage Inc. |
| Sector: Financials | |
| SubSector: REIT - Industrial | |
| MarketCap: 11203.9 Millions | |
| Recent Price: 141.13 Smart Investing & Trading Score: 30 | |
| Day Percent Change: -1.71% Day Change: -2.45 | |
| Week Change: -1.71% Year-to-date Change: -6.3% | |
| EXR Links: Profile News Message Board | |
| Charts:- Daily , Weekly | |
| Add EXR to Watchlist: View: Get Complete EXR Trend Analysis ➞ | |
 | EQIX Equinix, Inc. (REIT) |
| Sector: Financials | |
| SubSector: REIT - Diversified | |
| MarketCap: 45855.3 Millions | |
| Recent Price: 772.74 Smart Investing & Trading Score: 0 | |
| Day Percent Change: -1.71% Day Change: -13.45 | |
| Week Change: -1.71% Year-to-date Change: -14.5% | |
| EQIX Links: Profile News Message Board | |
| Charts:- Daily , Weekly | |
| Add EQIX to Watchlist: View: Get Complete EQIX Trend Analysis ➞ | |
 | NKSH National Bankshares, Inc. |
| Sector: Financials | |
| SubSector: Regional - Mid-Atlantic Banks | |
| MarketCap: 209.759 Millions | |
| Recent Price: 31.34 Smart Investing & Trading Score: 60 | |
| Day Percent Change: -1.71% Day Change: -0.5 | |
| Week Change: 0.31% Year-to-date Change: 2.9% | |
| NKSH Links: Profile News Message Board | |
| Charts:- Daily , Weekly | |
| Add NKSH to Watchlist: View: Get Complete NKSH Trend Analysis ➞ | |
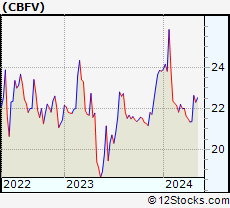 | CBFV CB Financial Services, Inc. |
| Sector: Financials | |
| SubSector: Regional - Northeast Banks | |
| MarketCap: 108.199 Millions | |
| Recent Price: 33.29 Smart Investing & Trading Score: 50 | |
| Day Percent Change: -1.71% Day Change: -0.55 | |
| Week Change: -0.85% Year-to-date Change: 12.5% | |
| CBFV Links: Profile News Message Board | |
| Charts:- Daily , Weekly | |
| Add CBFV to Watchlist: View: Get Complete CBFV Trend Analysis ➞ | |
 | SBSI Southside Bancshares, Inc. |
| Sector: Financials | |
| SubSector: Regional - Mid-Atlantic Banks | |
| MarketCap: 971.259 Millions | |
| Recent Price: 31.24 Smart Investing & Trading Score: 50 | |
| Day Percent Change: -1.72% Day Change: -0.52 | |
| Week Change: -2.84% Year-to-date Change: -4.2% | |
| SBSI Links: Profile News Message Board | |
| Charts:- Daily , Weekly | |
| Add SBSI to Watchlist: View: Get Complete SBSI Trend Analysis ➞ | |
 | AMT American Tower Corporation (REIT) |
| Sector: Financials | |
| SubSector: REIT - Diversified | |
| MarketCap: 92527 Millions | |
| Recent Price: 200.33 Smart Investing & Trading Score: 0 | |
| Day Percent Change: -1.73% Day Change: -3.52 | |
| Week Change: -1.73% Year-to-date Change: 10.1% | |
| AMT Links: Profile News Message Board | |
| Charts:- Daily , Weekly | |
| Add AMT to Watchlist: View: Get Complete AMT Trend Analysis ➞ | |
 | ZION Zions Bancorporation, National Association |
| Sector: Financials | |
| SubSector: Regional - Pacific Banks | |
| MarketCap: 4577.89 Millions | |
| Recent Price: 57.0 Smart Investing & Trading Score: 60 | |
| Day Percent Change: -1.74% Day Change: -1.01 | |
| Week Change: -1.74% Year-to-date Change: 0.2% | |
| ZION Links: Profile News Message Board | |
| Charts:- Daily , Weekly | |
| Add ZION to Watchlist: View: Get Complete ZION Trend Analysis ➞ | |
 | COF Capital One Financial Corporation |
| Sector: Financials | |
| SubSector: Credit Services | |
| MarketCap: 23094.2 Millions | |
| Recent Price: 223.27 Smart Investing & Trading Score: 50 | |
| Day Percent Change: -1.74% Day Change: -3.95 | |
| Week Change: -1.74% Year-to-date Change: 10.3% | |
| COF Links: Profile News Message Board | |
| Charts:- Daily , Weekly | |
| Add COF to Watchlist: View: Get Complete COF Trend Analysis ➞ | |
 | STRS Stratus Properties Inc. |
| Sector: Financials | |
| SubSector: Real Estate Development | |
| MarketCap: 167.819 Millions | |
| Recent Price: 19.46 Smart Investing & Trading Score: 40 | |
| Day Percent Change: -1.74% Day Change: -0.32 | |
| Week Change: 8.94% Year-to-date Change: -13.2% | |
| STRS Links: Profile News Message Board | |
| Charts:- Daily , Weekly | |
| Add STRS to Watchlist: View: Get Complete STRS Trend Analysis ➞ | |
 | INN Summit Hotel Properties, Inc. |
| Sector: Financials | |
| SubSector: Real Estate Development | |
| MarketCap: 402.019 Millions | |
| Recent Price: 5.48 Smart Investing & Trading Score: 70 | |
| Day Percent Change: -1.75% Day Change: -0.09 | |
| Week Change: -7.83% Year-to-date Change: -23.9% | |
| INN Links: Profile News Message Board | |
| Charts:- Daily , Weekly | |
| Add INN to Watchlist: View: Get Complete INN Trend Analysis ➞ | |
 | CMA Comerica Incorporated |
| Sector: Financials | |
| SubSector: Money Center Banks | |
| MarketCap: 4449.49 Millions | |
| Recent Price: 69.33 Smart Investing & Trading Score: 80 | |
| Day Percent Change: -1.77% Day Change: -1.25 | |
| Week Change: -1.77% Year-to-date Change: 5.6% | |
| CMA Links: Profile News Message Board | |
| Charts:- Daily , Weekly | |
| Add CMA to Watchlist: View: Get Complete CMA Trend Analysis ➞ | |
 | NLY Annaly Capital Management, Inc. |
| Sector: Financials | |
| SubSector: Mortgage Investment | |
| MarketCap: 9127.79 Millions | |
| Recent Price: 21.19 Smart Investing & Trading Score: 90 | |
| Day Percent Change: -1.77% Day Change: -0.37 | |
| Week Change: -1.39% Year-to-date Change: 20.5% | |
| NLY Links: Profile News Message Board | |
| Charts:- Daily , Weekly | |
| Add NLY to Watchlist: View: Get Complete NLY Trend Analysis ➞ | |
 | MKTX MarketAxess Holdings Inc. |
| Sector: Financials | |
| SubSector: Investment Brokerage - National | |
| MarketCap: 12431.5 Millions | |
| Recent Price: 180.58 Smart Investing & Trading Score: 0 | |
| Day Percent Change: -1.77% Day Change: -3.26 | |
| Week Change: -1.77% Year-to-date Change: -17.6% | |
| MKTX Links: Profile News Message Board | |
| Charts:- Daily , Weekly | |
| Add MKTX to Watchlist: View: Get Complete MKTX Trend Analysis ➞ | |
 | IVZ Invesco Ltd. |
| Sector: Financials | |
| SubSector: Asset Management | |
| MarketCap: 4578.23 Millions | |
| Recent Price: 21.5 Smart Investing & Trading Score: 60 | |
| Day Percent Change: -1.78% Day Change: -0.39 | |
| Week Change: -1.78% Year-to-date Change: 14.6% | |
| IVZ Links: Profile News Message Board | |
| Charts:- Daily , Weekly | |
| Add IVZ to Watchlist: View: Get Complete IVZ Trend Analysis ➞ | |
 | CFG Citizens Financial Group, Inc. |
| Sector: Financials | |
| SubSector: Regional - Mid-Atlantic Banks | |
| MarketCap: 8225.19 Millions | |
| Recent Price: 51.35 Smart Investing & Trading Score: 60 | |
| Day Percent Change: -1.78% Day Change: -0.93 | |
| Week Change: -1.78% Year-to-date Change: 10.1% | |
| CFG Links: Profile News Message Board | |
| Charts:- Daily , Weekly | |
| Add CFG to Watchlist: View: Get Complete CFG Trend Analysis ➞ | |
 | FNLC The First Bancorp, Inc. |
| Sector: Financials | |
| SubSector: Regional - Northeast Banks | |
| MarketCap: 264.799 Millions | |
| Recent Price: 27.18 Smart Investing & Trading Score: 50 | |
| Day Percent Change: -1.8% Day Change: -0.47 | |
| Week Change: -1.61% Year-to-date Change: -2.2% | |
| FNLC Links: Profile News Message Board | |
| Charts:- Daily , Weekly | |
| Add FNLC to Watchlist: View: Get Complete FNLC Trend Analysis ➞ | |
 | PFSI PennyMac Financial Services, Inc. |
| Sector: Financials | |
| SubSector: Mortgage Investment | |
| MarketCap: 1588.09 Millions | |
| Recent Price: 110.10 Smart Investing & Trading Score: 90 | |
| Day Percent Change: -1.8% Day Change: -1.9 | |
| Week Change: -4.63% Year-to-date Change: 1.8% | |
| PFSI Links: Profile News Message Board | |
| Charts:- Daily , Weekly | |
| Add PFSI to Watchlist: View: Get Complete PFSI Trend Analysis ➞ | |
 | CIM Chimera Investment Corporation |
| Sector: Financials | |
| SubSector: Mortgage Investment | |
| MarketCap: 2164.09 Millions | |
| Recent Price: 14.17 Smart Investing & Trading Score: 80 | |
| Day Percent Change: -1.81% Day Change: -0.25 | |
| Week Change: -0.88% Year-to-date Change: 2.5% | |
| CIM Links: Profile News Message Board | |
| Charts:- Daily , Weekly | |
| Add CIM to Watchlist: View: Get Complete CIM Trend Analysis ➞ | |
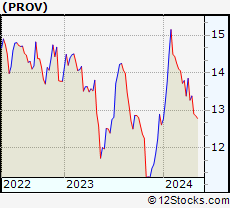 | PROV Provident Financial Holdings, Inc. |
| Sector: Financials | |
| SubSector: Savings & Loans | |
| MarketCap: 120.63 Millions | |
| Recent Price: 15.51 Smart Investing & Trading Score: 60 | |
| Day Percent Change: -1.82% Day Change: -0.28 | |
| Week Change: -2.96% Year-to-date Change: -3.4% | |
| PROV Links: Profile News Message Board | |
| Charts:- Daily , Weekly | |
| Add PROV to Watchlist: View: Get Complete PROV Trend Analysis ➞ | |
 | MFA MFA Financial, Inc. |
| Sector: Financials | |
| SubSector: Mortgage Investment | |
| MarketCap: 1869.69 Millions | |
| Recent Price: 10.20 Smart Investing & Trading Score: 50 | |
| Day Percent Change: -1.83% Day Change: -0.18 | |
| Week Change: -0.41% Year-to-date Change: 2.2% | |
| MFA Links: Profile News Message Board | |
| Charts:- Daily , Weekly | |
| Add MFA to Watchlist: View: Get Complete MFA Trend Analysis ➞ | |
 | C Citigroup Inc. |
| Sector: Financials | |
| SubSector: Money Center Banks | |
| MarketCap: 94128 Millions | |
| Recent Price: 94.78 Smart Investing & Trading Score: 50 | |
| Day Percent Change: -1.85% Day Change: -1.79 | |
| Week Change: -1.85% Year-to-date Change: 18.9% | |
| C Links: Profile News Message Board | |
| Charts:- Daily , Weekly | |
| Add C to Watchlist: View: Get Complete C Trend Analysis ➞ | |
| For tabular summary view of above stock list: Summary View ➞ 0 - 25 , 25 - 50 , 50 - 75 , 75 - 100 , 100 - 125 , 125 - 150 , 150 - 175 , 175 - 200 , 200 - 225 , 225 - 250 , 250 - 275 , 275 - 300 , 300 - 325 , 325 - 350 , 350 - 375 , 375 - 400 , 400 - 425 , 425 - 450 , 450 - 475 , 475 - 500 , 500 - 525 , 525 - 550 , 550 - 575 , 575 - 600 , 600 - 625 , 625 - 650 , 650 - 675 , 675 - 700 , 700 - 725 , 725 - 750 , 750 - 775 , 775 - 800 , 800 - 825 , 825 - 850 , 850 - 875 , 875 - 900 , 900 - 925 , 925 - 950 , 950 - 975 , 975 - 1000 , 1000 - 1025 , 1025 - 1050 , 1050 - 1075 , 1075 - 1100 , 1100 - 1125 | ||
| Click To Change The Sort Order: By Market Cap or Company Size Performance: Year-to-date, Week and Day | |
| Select Chart Type: | ||
|
Best Stocks Today 12Stocks.com |
© 2025 12Stocks.com Terms & Conditions Privacy Contact Us
All Information Provided Only For Education And Not To Be Used For Investing or Trading. See Terms & Conditions


One More Thing ... Get Best Stocks Delivered Daily!
Never Ever Miss A Move With Our Top Ten Stocks Lists
Find Best Stocks In Any Market - Bull or Bear Market
Take A Peek At Our Top Ten Stocks Lists: Daily, Weekly, Year-to-Date & Top Trends
Find Best Stocks In Any Market - Bull or Bear Market
Take A Peek At Our Top Ten Stocks Lists: Daily, Weekly, Year-to-Date & Top Trends
Financial Stocks With Best Up Trends [0-bearish to 100-bullish]: MicroSectors Gold[100], Offerpad [100], NexGen Energy[100], Healthcare Realty[100], Eagle Point[100], EZCORP [100], Monroe Capital[100], KraneShares Trust[100], Infusive Compounding[100], Credicorp [100], Mexico Fund[100]
Best Financial Stocks Year-to-Date:
ESSA Bancorp[2923.51%], MicroSectors Gold[261.7%], Banco Santander[113.19%], Banco Bilbao[102.83%], Iris Energy[99.49%], Bancolombia S.A[93.5%], Mr. Cooper[91.06%], Heritage Insurance[90.66%], Inter & Co[86.91%], Deutsche Bank[82.36%], X [80.17%] Best Financial Stocks This Week:
Plymouth Industrial[40.4%], SelectQuote [30.15%], Seritage Growth[20.21%], MBIA [18.44%], iShares iBonds[14.61%], Nu [13.82%], TD Ameritrade[11.19%], Cipher Mining[10.9%], Brookfield Business[10.18%], Brookfield Business[9.78%], Stratus Properties[8.94%] Best Financial Stocks Daily:
SelectQuote [41.53%], X [15.73%], CNFinance [7.77%], Aegon N.V[7.64%], AdvisorShares Pure[6.12%], FinVolution [5.55%], Hippo [5.47%], Lufax Holding[5.45%], MicroSectors Gold[4.98%], eHealth [4.65%], TD Ameritrade[3.76%]