
 Login Sign Up


| |||||
 |  | ||||

| 12Stocks.com Market Intelligence |
Best Consumer Services Stocks
| In a hurry? Services & Goods Stocks: Performance Trends Table, Stock Charts
Sort Consumer Services: Daily, Weekly, Year-to-Date, Market Cap & Trends. Filter Services & Goods stocks list by size: All Large Mid-Range Small |
| 12Stocks.com Consumer Services Stocks Performances & Trends Daily | |||||||||
|
|  The overall Smart Investing & Trading Score is 52 (0-bearish to 100-bullish) which puts Consumer Services sector in short term neutral trend. The Smart Investing & Trading Score from previous trading session is 64 and hence a deterioration of trend.
| ||||||||
Here are the Smart Investing & Trading Scores of the most requested Consumer Services stocks at 12Stocks.com (click stock name for detailed review):
|


| Consider signing up for our daily 12Stocks.com "Best Stocks Newsletter". You will never ever miss a big stock move again! |
| 12Stocks.com: Investing in Consumer Services sector with Stocks | |
|
The following table helps investors and traders sort through current performance and trends (as measured by Smart Investing & Trading Score) of various
stocks in the Consumer Services sector. Quick View: Move mouse or cursor over stock symbol (ticker) to view short-term Technical chart and over stock name to view long term chart. Click on  to add stock symbol to your watchlist and to add stock symbol to your watchlist and  to view watchlist. Click on any ticker or stock name for detailed market intelligence report for that stock. to view watchlist. Click on any ticker or stock name for detailed market intelligence report for that stock. |
12Stocks.com Performance of Stocks in Consumer Services Sector
| Ticker | Stock Name | Watchlist | Category | Recent Price | Smart Investing & Trading Score | Change % | YTD Change% |
| DIS | Walt Disney |   | Entertainment | 105.39 | 0 | -9.51% | 16.72% |
| J | Jacobs Engineering | | Services | 141.64 | 0 | -4.99% | 9.12% |
| BLMN | Bloomin | | Restaurants | 23.96 | 0 | -4.01% | -14.88% |
| NCLH | Norwegian Cruise | | Casinos | 15.60 | 0 | -3.70% | -22.16% |
| CBRL | Cracker Barrel | | Restaurants | 53.65 | 0 | -3.33% | -30.40% |
| EXPE | Expedia | | Lodging | 112.91 | 0 | -2.68% | -25.61% |
| PTVE | Pactiv Evergreen | | Packaging | 13.10 | 0 | -2.60% | -4.52% |
| FWRG | First Watch | | Restaurants | 21.51 | 0 | -14.27% | 7.93% |
| PTLO | Portillos | | Restaurants | 10.61 | 0 | -12.53% | -33.89% |
| DFH | Dream Finders | | Residential Construction | 30.76 | 0 | -1.76% | -14.56% |
| KELYA | Kelly Services | | Staffing | 23.48 | 0 | -0.80% | 8.60% |
| PZZA | Papa John | | Restaurants | 57.93 | 0 | -0.65% | -24.01% |
| FAST | Fastenal | | Equipment | 66.41 | 0 | -0.49% | 2.53% |
| MCS | Marcus | | Entertainment | 11.24 | 0 | -0.27% | -22.91% |
| For chart view version of above stock list: Chart View ➞ 0 - 25 , 25 - 50 , 50 - 75 , 75 - 100 , 100 - 125 , 125 - 150 , 150 - 175 , 175 - 200 , 200 - 225 , 225 - 250 , 250 - 275 , 275 - 300 , 300 - 325 , 325 - 350 , 350 - 375 , 375 - 400 , 400 - 425 , 425 - 450 , 450 - 475 | ||
 | Click To Change The Sort Order: By Market Cap or Company Size Performance: Year-to-date, Week and Day |  |
|
Get the most comprehensive stock market coverage daily at 12Stocks.com ➞ Best Stocks Today ➞ Best Stocks Weekly ➞ Best Stocks Year-to-Date ➞ Best Stocks Trends ➞  Best Stocks Today 12Stocks.com Best Nasdaq Stocks ➞ Best S&P 500 Stocks ➞ Best Tech Stocks ➞ Best Biotech Stocks ➞ |
| Detailed Overview of Consumer Services Stocks |
| Consumer Services Technical Overview, Leaders & Laggards, Top Consumer Services ETF Funds & Detailed Consumer Services Stocks List, Charts, Trends & More |
| Consumer Services Sector: Technical Analysis, Trends & YTD Performance | |
| Consumer Services sector is composed of stocks
from retail, entertainment, media/publishing, consumer goods
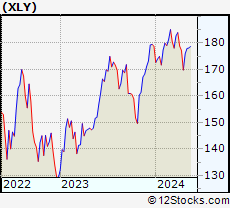
and services subsectors. Consumer Services sector, as represented by XLY, an exchange-traded fund [ETF] that holds basket of Consumer Services stocks (e.g, Walmart, Alibaba) is down by -0.16% and is currently underperforming the overall market by -8.28% year-to-date. Below is a quick view of Technical charts and trends: |
|
 XLY Weekly Chart |
|
| Long Term Trend: Not Good | |
| Medium Term Trend: Very Good | |
 XLY Daily Chart |
|
| Short Term Trend: Very Good | |
| Overall Trend Score: 52 | |
| YTD Performance: -0.16% | |
| **Trend Scores & Views Are Only For Educational Purposes And Not For Investing | |
| 12Stocks.com: Top Performing Consumer Services Sector Stocks | ||||||||||||||||||||||||||||||||||||||||||||||||
 The top performing Consumer Services sector stocks year to date are
Now, more recently, over last week, the top performing Consumer Services sector stocks on the move are


|
||||||||||||||||||||||||||||||||||||||||||||||||
| 12Stocks.com: Investing in Consumer Services Sector using Exchange Traded Funds | |
|
The following table shows list of key exchange traded funds (ETF) that
help investors track Consumer Services Index. For detailed view, check out our ETF Funds section of our website. Quick View: Move mouse or cursor over ETF symbol (ticker) to view short-term Technical chart and over ETF name to view long term chart. Click on ticker or stock name for detailed view. Click on to add stock symbol to your watchlist and to view watchlist. |
12Stocks.com List of ETFs that track Consumer Services Index
| Ticker | ETF Name | Watchlist | Recent Price | Smart Investing & Trading Score | Change % | Week % | Year-to-date % |
| XLY | Consumer Discret Sel | | 178.52 | 52 | -0.72 | 0.34 | -0.16% |
| RTH | Retail | | 202.48 | 64 | 0.80 | 0.98 | 7.57% |
| IYC | Consumer Services | | 79.65 | 64 | -0.51 | 0.71 | 5.12% |
| XRT | Retail | | 74.16 | 64 | -0.16 | 1.01 | 2.54% |
| IYK | Consumer Goods | | 67.19 | 100 | 0.90 | 0.9 | 5.14% |
| UCC | Consumer Services | | 35.22 | 64 | -0.14 | 3.39 | -1.91% |
| RETL | Retail Bull 3X | | 9.08 | 69 | -0.44 | 2.83 | -0.44% |
| RXI | Globl Consumer Discretionary | | 163.18 | 52 | -0.65 | 0.04 | 2.59% |
| SCC | Short Consumer Services | | 15.30 | 46 | 0.40 | -0.55 | -0.16% |
| UGE | Consumer Goods | | 17.61 | 95 | 2.22 | 1.99 | 11.89% |
| 12Stocks.com: Charts, Trends, Fundamental Data and Performances of Consumer Services Stocks | |
|
We now take in-depth look at all Consumer Services stocks including charts, multi-period performances and overall trends (as measured by Smart Investing & Trading Score). One can sort Consumer Services stocks (click link to choose) by Daily, Weekly and by Year-to-Date performances. Also, one can sort by size of the company or by market capitalization. |
| Select Your Default Chart Type: | |||||
| |||||
| Click on stock symbol or name for detailed view. Click on to add stock symbol to your watchlist and to view watchlist. Quick View: Move mouse or cursor over "Daily" to quickly view daily Technical stock chart and over "Weekly" to view weekly Technical stock chart. | |||||

 | DIS The Walt Disney Company |
| Sector: Services & Goods | |
| SubSector: Entertainment - Diversified | |
| MarketCap: 178396 Millions | |
| Recent Price: 105.39 Smart Investing & Trading Score: 0 | |
| Day Percent Change: -9.51% Day Change: -11.08 | |
| Week Change: -7.28% Year-to-date Change: 16.7% | |
| DIS Links: Profile News Message Board | |
| Charts:- Daily , Weekly | |
| Add DIS to Watchlist: View: Get Complete DIS Trend Analysis ➞ | |
 | J Jacobs Engineering Group Inc. |
| Sector: Services & Goods | |
| SubSector: Technical Services | |
| MarketCap: 9714.8 Millions | |
| Recent Price: 141.64 Smart Investing & Trading Score: 0 | |
| Day Percent Change: -4.99% Day Change: -7.44 | |
| Week Change: -4.36% Year-to-date Change: 9.1% | |
| J Links: Profile News Message Board | |
| Charts:- Daily , Weekly | |
| Add J to Watchlist: View: Get Complete J Trend Analysis ➞ | |
 | BLMN Bloomin Brands, Inc. |
| Sector: Services & Goods | |
| SubSector: Restaurants | |
| MarketCap: 503.47 Millions | |
| Recent Price: 23.96 Smart Investing & Trading Score: 0 | |
| Day Percent Change: -4.01% Day Change: -1.00 | |
| Week Change: -6.44% Year-to-date Change: -14.9% | |
| BLMN Links: Profile News Message Board | |
| Charts:- Daily , Weekly | |
| Add BLMN to Watchlist: View: Get Complete BLMN Trend Analysis ➞ | |
 | NCLH Norwegian Cruise Line Holdings Ltd. |
| Sector: Services & Goods | |
| SubSector: Resorts & Casinos | |
| MarketCap: 2895.54 Millions | |
| Recent Price: 15.60 Smart Investing & Trading Score: 0 | |
| Day Percent Change: -3.70% Day Change: -0.60 | |
| Week Change: -2.44% Year-to-date Change: -22.2% | |
| NCLH Links: Profile News Message Board | |
| Charts:- Daily , Weekly | |
| Add NCLH to Watchlist: View: Get Complete NCLH Trend Analysis ➞ | |
 | CBRL Cracker Barrel Old Country Store, Inc. |
| Sector: Services & Goods | |
| SubSector: Restaurants | |
| MarketCap: 1839.6 Millions | |
| Recent Price: 53.65 Smart Investing & Trading Score: 0 | |
| Day Percent Change: -3.33% Day Change: -1.85 | |
| Week Change: -4.49% Year-to-date Change: -30.4% | |
| CBRL Links: Profile News Message Board | |
| Charts:- Daily , Weekly | |
| Add CBRL to Watchlist: View: Get Complete CBRL Trend Analysis ➞ | |
 | EXPE Expedia Group, Inc. |
| Sector: Services & Goods | |
| SubSector: Lodging | |
| MarketCap: 8052.96 Millions | |
| Recent Price: 112.91 Smart Investing & Trading Score: 0 | |
| Day Percent Change: -2.68% Day Change: -3.11 | |
| Week Change: -2.1% Year-to-date Change: -25.6% | |
| EXPE Links: Profile News Message Board | |
| Charts:- Daily , Weekly | |
| Add EXPE to Watchlist: View: Get Complete EXPE Trend Analysis ➞ | |
 | PTVE Pactiv Evergreen Inc. |
| Sector: Services & Goods | |
| SubSector: Packaging & Containers | |
| MarketCap: 33427 Millions | |
| Recent Price: 13.10 Smart Investing & Trading Score: 0 | |
| Day Percent Change: -2.60% Day Change: -0.35 | |
| Week Change: -3.46% Year-to-date Change: -4.5% | |
| PTVE Links: Profile News Message Board | |
| Charts:- Daily , Weekly | |
| Add PTVE to Watchlist: View: Get Complete PTVE Trend Analysis ➞ | |
 | FWRG First Watch Restaurant Group, Inc. |
| Sector: Services & Goods | |
| SubSector: Restaurants | |
| MarketCap: 1000 Millions | |
| Recent Price: 21.51 Smart Investing & Trading Score: 0 | |
| Day Percent Change: -14.27% Day Change: -3.58 | |
| Week Change: -16.24% Year-to-date Change: 7.9% | |
| FWRG Links: Profile News Message Board | |
| Charts:- Daily , Weekly | |
| Add FWRG to Watchlist: View: Get Complete FWRG Trend Analysis ➞ | |
 | PTLO Portillos Inc. |
| Sector: Services & Goods | |
| SubSector: Restaurants | |
| MarketCap: 1590 Millions | |
| Recent Price: 10.61 Smart Investing & Trading Score: 0 | |
| Day Percent Change: -12.53% Day Change: -1.52 | |
| Week Change: -11.69% Year-to-date Change: -33.9% | |
| PTLO Links: Profile News Message Board | |
| Charts:- Daily , Weekly | |
| Add PTLO to Watchlist: View: Get Complete PTLO Trend Analysis ➞ | |
 | DFH Dream Finders Homes, Inc. |
| Sector: Services & Goods | |
| SubSector: Residential Construction | |
| MarketCap: 2270 Millions | |
| Recent Price: 30.76 Smart Investing & Trading Score: 0 | |
| Day Percent Change: -1.76% Day Change: -0.55 | |
| Week Change: -1.3% Year-to-date Change: -14.6% | |
| DFH Links: Profile News Message Board | |
| Charts:- Daily , Weekly | |
| Add DFH to Watchlist: View: Get Complete DFH Trend Analysis ➞ | |
 | KELYA Kelly Services, Inc. |
| Sector: Services & Goods | |
| SubSector: Staffing & Outsourcing Services | |
| MarketCap: 587.228 Millions | |
| Recent Price: 23.48 Smart Investing & Trading Score: 0 | |
| Day Percent Change: -0.80% Day Change: -0.19 | |
| Week Change: -0.63% Year-to-date Change: 8.6% | |
| KELYA Links: Profile News Message Board | |
| Charts:- Daily , Weekly | |
| Add KELYA to Watchlist: View: Get Complete KELYA Trend Analysis ➞ | |
 | PZZA Papa John s International, Inc. |
| Sector: Services & Goods | |
| SubSector: Specialty Eateries | |
| MarketCap: 1925.27 Millions | |
| Recent Price: 57.93 Smart Investing & Trading Score: 0 | |
| Day Percent Change: -0.65% Day Change: -0.38 | |
| Week Change: -1.78% Year-to-date Change: -24.0% | |
| PZZA Links: Profile News Message Board | |
| Charts:- Daily , Weekly | |
| Add PZZA to Watchlist: View: Get Complete PZZA Trend Analysis ➞ | |
 | FAST Fastenal Company |
| Sector: Services & Goods | |
| SubSector: Industrial Equipment Wholesale | |
| MarketCap: 17609.9 Millions | |
| Recent Price: 66.41 Smart Investing & Trading Score: 0 | |
| Day Percent Change: -0.49% Day Change: -0.33 | |
| Week Change: -2.95% Year-to-date Change: 2.5% | |
| FAST Links: Profile News Message Board | |
| Charts:- Daily , Weekly | |
| Add FAST to Watchlist: View: Get Complete FAST Trend Analysis ➞ | |
 | MCS The Marcus Corporation |
| Sector: Services & Goods | |
| SubSector: Entertainment - Diversified | |
| MarketCap: 441.437 Millions | |
| Recent Price: 11.24 Smart Investing & Trading Score: 0 | |
| Day Percent Change: -0.27% Day Change: -0.03 | |
| Week Change: -5.63% Year-to-date Change: -22.9% | |
| MCS Links: Profile News Message Board | |
| Charts:- Daily , Weekly | |
| Add MCS to Watchlist: View: Get Complete MCS Trend Analysis ➞ | |
| For tabular summary view of above stock list: Summary View ➞ 0 - 25 , 25 - 50 , 50 - 75 , 75 - 100 , 100 - 125 , 125 - 150 , 150 - 175 , 175 - 200 , 200 - 225 , 225 - 250 , 250 - 275 , 275 - 300 , 300 - 325 , 325 - 350 , 350 - 375 , 375 - 400 , 400 - 425 , 425 - 450 , 450 - 475 | ||
| Click To Change The Sort Order: By Market Cap or Company Size Performance: Year-to-date, Week and Day | |
| Select Chart Type: | ||
|
Best Stocks Today 12Stocks.com |
© 2024 12Stocks.com Terms & Conditions Privacy Contact Us
All Information Provided Only For Education And Not To Be Used For Investing or Trading. See Terms & Conditions


One More Thing ... Get Best Stocks Delivered Daily!
Never Ever Miss A Move With Our Top Ten Stocks Lists
Find Best Stocks In Any Market - Bull or Bear Market
Take A Peek At Our Top Ten Stocks Lists: Daily, Weekly, Year-to-Date & Top Trends
Find Best Stocks In Any Market - Bull or Bear Market
Take A Peek At Our Top Ten Stocks Lists: Daily, Weekly, Year-to-Date & Top Trends
Consumer Services Stocks With Best Up Trends [0-bearish to 100-bullish]: Jumia Technologies[100], Newtek Business[100], ATRenew [100], Boqii Holding[100], Mondee [100], WESCO [100], Nextdoor [100], Avnet [100], Daily Journal[100], GreenTree Hospitality[100], Verisk Analytics[100]
Best Consumer Services Stocks Year-to-Date:
U Power[3103.13%], Vroom [2064.76%], Yatsen Holding[505.52%], Fluent [456.72%], Research[148.88%], Codere Online[134.25%], Carvana Co[120.36%], Sweetgreen [105.75%], Smart Share[92.23%], RealReal [88.06%], Jumia Technologies[82.72%] Best Consumer Services Stocks This Week:
Jumia Technologies[27.47%], Children s[20.18%], ATRenew [16.94%], Gogoro [14.94%], Smart Share[13.79%], ThredUp [13.7%], Noodles & [12.66%], Newtek Business[10.48%], Wayfair [9.37%], MYT Netherlands[8%], CareDx [7.82%] Best Consumer Services Stocks Daily:
Jumia Technologies[17.92%], Children s[16.44%], Newtek Business[11.28%], ATRenew [8.86%], Boqii Holding[8.13%], Applied UV[7.50%], Vision Marine[7.35%], Allego N.V[6.96%], Lanvin [6.83%], Smart Share[6.45%], Gaia [6.25%]