
 Login Sign Up


| |||||
 |  | ||||

| 12Stocks.com Market Intelligence |
Best Consumer Services Stocks
| In a hurry? Services & Goods Stocks: Performance Trends Table, Stock Charts
Sort Consumer Services: Daily, Weekly, Year-to-Date, Market Cap & Trends. Filter Services & Goods stocks list by size: All Large Mid-Range Small |
| 12Stocks.com Consumer Services Stocks Performances & Trends Daily | |||||||||
|
|  The overall Smart Investing & Trading Score is 76 (0-bearish to 100-bullish) which puts Consumer Services sector in short term neutral to bullish trend. The Smart Investing & Trading Score from previous trading session is 90 and hence a deterioration of trend.
| ||||||||
Here are the Smart Investing & Trading Scores of the most requested Consumer Services stocks at 12Stocks.com (click stock name for detailed review):
|


| Consider signing up for our daily 12Stocks.com "Best Stocks Newsletter". You will never ever miss a big stock move again! |
| 12Stocks.com: Investing in Consumer Services sector with Stocks | |
|
The following table helps investors and traders sort through current performance and trends (as measured by Smart Investing & Trading Score) of various
stocks in the Consumer Services sector. Quick View: Move mouse or cursor over stock symbol (ticker) to view short-term Technical chart and over stock name to view long term chart. Click on  to add stock symbol to your watchlist and to add stock symbol to your watchlist and  to view watchlist. Click on any ticker or stock name for detailed market intelligence report for that stock. to view watchlist. Click on any ticker or stock name for detailed market intelligence report for that stock. |
12Stocks.com Performance of Stocks in Consumer Services Sector
| Ticker | Stock Name | Watchlist | Category | Recent Price | Smart Investing & Trading Score | Change % | YTD Change% |
| MYPS | PLAYSTUDIOS |   | Electronic Gaming & Multimedia | 2.16 | 61 | -3.57% | -19.25% |
| SPOT | Spotify Technology | | Broadcasting | 280.44 | 61 | -2.67% | 49.24% |
| ASGN | ASGN | | Staffing | 96.45 | 61 | -2.26% | 0.29% |
| MCK | McKesson | | Pharmacy | 537.21 | 61 | 0.21% | 16.03% |
| EEFT | Euronet Worldwide | | Services | 102.63 | 61 | -1.93% | 1.12% |
| KR | Kroger Co | | Grocery | 55.38 | 61 | -0.34% | 21.16% |
| MED | Medifast | | Retail | 27.53 | 60 | -22.47% | -59.04% |
| BIG | Big Lots | | Retail | 3.52 | 60 | -1.12% | -54.81% |
| NXST | Nexstar Media | | Broadcasting | 159.98 | 60 | -2.90% | 2.06% |
| TGNA | TEGNA | | Broadcasting | 13.64 | 60 | -0.73% | -10.85% |
| GGR | Gogoro | | Auto Parts | 1.58 | 59 | 2.60% | -39.23% |
| OLPX | Olaplex | | Specialty Retail | 1.38 | 59 | 0.00% | -46.09% |
| FYBR | Frontier | | Telecom Services | 23.16 | 59 | -1.86% | -8.20% |
| EVGO | EVgo | | Specialty Retail | 1.80 | 59 | -1.64% | -49.79% |
| GPS | Gap | | Apparel | 20.52 | 58 | -3.44% | -1.87% |
| AAP | Advance Auto | | Auto Parts | 72.98 | 58 | -3.24% | 19.58% |
| OMC | Omnicom | | Advertising | 92.84 | 58 | -3.18% | 7.32% |
| VRRM | Verra Mobility | | Security | 23.58 | 58 | -3.16% | 2.39% |
| DDS | Dillard s | | Department | 437.99 | 58 | -2.32% | 8.51% |
| SCVL | Shoe Carnival | | Apparel | 33.47 | 58 | -2.05% | 10.79% |
| AZO | AutoZone | | Auto Parts | 2956.40 | 58 | -1.41% | 14.34% |
| DFIN | Donnelley Financial | | Services | 62.78 | 58 | -1.37% | 0.66% |
| KRT | Karat Packaging | | Packaging | 27.18 | 58 | -0.95% | 9.11% |
| FND | Floor & Decor | | Retail | 110.33 | 58 | -0.84% | -1.10% |
| WMK | Weis Markets | | Grocery | 63.13 | 58 | -0.71% | -1.30% |
| For chart view version of above stock list: Chart View ➞ 0 - 25 , 25 - 50 , 50 - 75 , 75 - 100 , 100 - 125 , 125 - 150 , 150 - 175 , 175 - 200 , 200 - 225 , 225 - 250 , 250 - 275 , 275 - 300 , 300 - 325 , 325 - 350 , 350 - 375 , 375 - 400 , 400 - 425 , 425 - 450 , 450 - 475 | ||
 | Click To Change The Sort Order: By Market Cap or Company Size Performance: Year-to-date, Week and Day |  |
|
Get the most comprehensive stock market coverage daily at 12Stocks.com ➞ Best Stocks Today ➞ Best Stocks Weekly ➞ Best Stocks Year-to-Date ➞ Best Stocks Trends ➞  Best Stocks Today 12Stocks.com Best Nasdaq Stocks ➞ Best S&P 500 Stocks ➞ Best Tech Stocks ➞ Best Biotech Stocks ➞ |
| Detailed Overview of Consumer Services Stocks |
| Consumer Services Technical Overview, Leaders & Laggards, Top Consumer Services ETF Funds & Detailed Consumer Services Stocks List, Charts, Trends & More |
| Consumer Services Sector: Technical Analysis, Trends & YTD Performance | |
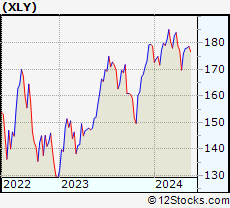
| Consumer Services sector is composed of stocks
from retail, entertainment, media/publishing, consumer goods
and services subsectors. Consumer Services sector, as represented by XLY, an exchange-traded fund [ETF] that holds basket of Consumer Services stocks (e.g, Walmart, Alibaba) is down by -1.78% and is currently underperforming the overall market by -6.58% year-to-date. Below is a quick view of Technical charts and trends: |
|
 XLY Weekly Chart |
|
| Long Term Trend: Good | |
| Medium Term Trend: Deteriorating | |
 XLY Daily Chart |
|
| Short Term Trend: Very Good | |
| Overall Trend Score: 76 | |
| YTD Performance: -1.78% | |
| **Trend Scores & Views Are Only For Educational Purposes And Not For Investing | |
| 12Stocks.com: Top Performing Consumer Services Sector Stocks | ||||||||||||||||||||||||||||||||||||||||||||||||
 The top performing Consumer Services sector stocks year to date are
Now, more recently, over last week, the top performing Consumer Services sector stocks on the move are


|
||||||||||||||||||||||||||||||||||||||||||||||||
| 12Stocks.com: Investing in Consumer Services Sector using Exchange Traded Funds | |
|
The following table shows list of key exchange traded funds (ETF) that
help investors track Consumer Services Index. For detailed view, check out our ETF Funds section of our website. Quick View: Move mouse or cursor over ETF symbol (ticker) to view short-term Technical chart and over ETF name to view long term chart. Click on ticker or stock name for detailed view. Click on to add stock symbol to your watchlist and to view watchlist. |
12Stocks.com List of ETFs that track Consumer Services Index
| Ticker | ETF Name | Watchlist | Recent Price | Smart Investing & Trading Score | Change % | Week % | Year-to-date % |
| XLY | Consumer Discret Sel | | 175.62 | 76 | -2.43 | -0.16 | -1.78% |
| RTH | Retail | | 198.86 | 41 | -1.02 | -1.1 | 5.65% |
| IYC | Consumer Services | | 77.88 | 76 | -1.82 | -0.61 | 2.78% |
| XRT | Retail | | 71.79 | 48 | -1.93 | -1.95 | -0.73% |
| IYK | Consumer Goods | | 66.92 | 81 | 0.07 | 0.24 | 4.72% |
| UCC | Consumer Services | | 34.21 | 83 | -2.15 | 0.16 | -4.72% |
| RETL | Retail Bull 3X | | 8.31 | 78 | -5.46 | -5.89 | -8.88% |
| RXI | Globl Consumer Discretionary | | 159.87 | 83 | -2.21 | -0.81 | 0.51% |
| SCC | Short Consumer Services | | 15.58 | 17 | 3.25 | -1.27 | 1.67% |
| UGE | Consumer Goods | | 17.10 | 83 | -0.44 | -0.41 | 8.63% |
| 12Stocks.com: Charts, Trends, Fundamental Data and Performances of Consumer Services Stocks | |
|
We now take in-depth look at all Consumer Services stocks including charts, multi-period performances and overall trends (as measured by Smart Investing & Trading Score). One can sort Consumer Services stocks (click link to choose) by Daily, Weekly and by Year-to-Date performances. Also, one can sort by size of the company or by market capitalization. |
| Select Your Default Chart Type: | |||||
| |||||
| Click on stock symbol or name for detailed view. Click on to add stock symbol to your watchlist and to view watchlist. Quick View: Move mouse or cursor over "Daily" to quickly view daily Technical stock chart and over "Weekly" to view weekly Technical stock chart. | |||||

 | MYPS PLAYSTUDIOS, Inc. |
| Sector: Services & Goods | |
| SubSector: Electronic Gaming & Multimedia | |
| MarketCap: 635 Millions | |
| Recent Price: 2.16 Smart Investing & Trading Score: 61 | |
| Day Percent Change: -3.57% Day Change: -0.08 | |
| Week Change: -3.79% Year-to-date Change: -19.3% | |
| MYPS Links: Profile News Message Board | |
| Charts:- Daily , Weekly | |
| Add MYPS to Watchlist: View: Get Complete MYPS Trend Analysis ➞ | |
 | SPOT Spotify Technology S.A. |
| Sector: Services & Goods | |
| SubSector: Broadcasting - Radio | |
| MarketCap: 24379.5 Millions | |
| Recent Price: 280.44 Smart Investing & Trading Score: 61 | |
| Day Percent Change: -2.67% Day Change: -7.69 | |
| Week Change: -3.16% Year-to-date Change: 49.2% | |
| SPOT Links: Profile News Message Board | |
| Charts:- Daily , Weekly | |
| Add SPOT to Watchlist: View: Get Complete SPOT Trend Analysis ➞ | |
 | ASGN ASGN Incorporated |
| Sector: Services & Goods | |
| SubSector: Staffing & Outsourcing Services | |
| MarketCap: 2035.88 Millions | |
| Recent Price: 96.45 Smart Investing & Trading Score: 61 | |
| Day Percent Change: -2.26% Day Change: -2.23 | |
| Week Change: -1.09% Year-to-date Change: 0.3% | |
| ASGN Links: Profile News Message Board | |
| Charts:- Daily , Weekly | |
| Add ASGN to Watchlist: View: Get Complete ASGN Trend Analysis ➞ | |
 | MCK McKesson Corporation |
| Sector: Services & Goods | |
| SubSector: Drugs Wholesale | |
| MarketCap: 24096.7 Millions | |
| Recent Price: 537.21 Smart Investing & Trading Score: 61 | |
| Day Percent Change: 0.21% Day Change: 1.12 | |
| Week Change: -1.12% Year-to-date Change: 16.0% | |
| MCK Links: Profile News Message Board | |
| Charts:- Daily , Weekly | |
| Add MCK to Watchlist: View: Get Complete MCK Trend Analysis ➞ | |
 | EEFT Euronet Worldwide, Inc. |
| Sector: Services & Goods | |
| SubSector: Business Services | |
| MarketCap: 4809.62 Millions | |
| Recent Price: 102.63 Smart Investing & Trading Score: 61 | |
| Day Percent Change: -1.93% Day Change: -2.02 | |
| Week Change: -1.16% Year-to-date Change: 1.1% | |
| EEFT Links: Profile News Message Board | |
| Charts:- Daily , Weekly | |
| Add EEFT to Watchlist: View: Get Complete EEFT Trend Analysis ➞ | |
 | KR The Kroger Co. |
| Sector: Services & Goods | |
| SubSector: Grocery Stores | |
| MarketCap: 26718.5 Millions | |
| Recent Price: 55.38 Smart Investing & Trading Score: 61 | |
| Day Percent Change: -0.34% Day Change: -0.19 | |
| Week Change: -0.2% Year-to-date Change: 21.2% | |
| KR Links: Profile News Message Board | |
| Charts:- Daily , Weekly | |
| Add KR to Watchlist: View: Get Complete KR Trend Analysis ➞ | |
 | MED Medifast, Inc. |
| Sector: Services & Goods | |
| SubSector: Specialty Retail, Other | |
| MarketCap: 681.044 Millions | |
| Recent Price: 27.53 Smart Investing & Trading Score: 60 | |
| Day Percent Change: -22.47% Day Change: -7.98 | |
| Week Change: -18.33% Year-to-date Change: -59.0% | |
| MED Links: Profile News Message Board | |
| Charts:- Daily , Weekly | |
| Add MED to Watchlist: View: Get Complete MED Trend Analysis ➞ | |
 | BIG Big Lots, Inc. |
| Sector: Services & Goods | |
| SubSector: Discount, Variety Stores | |
| MarketCap: 603.572 Millions | |
| Recent Price: 3.52 Smart Investing & Trading Score: 60 | |
| Day Percent Change: -1.12% Day Change: -0.04 | |
| Week Change: 1.44% Year-to-date Change: -54.8% | |
| BIG Links: Profile News Message Board | |
| Charts:- Daily , Weekly | |
| Add BIG to Watchlist: View: Get Complete BIG Trend Analysis ➞ | |
 | NXST Nexstar Media Group, Inc. |
| Sector: Services & Goods | |
| SubSector: Broadcasting - TV | |
| MarketCap: 2763.73 Millions | |
| Recent Price: 159.98 Smart Investing & Trading Score: 60 | |
| Day Percent Change: -2.90% Day Change: -4.77 | |
| Week Change: 0.67% Year-to-date Change: 2.1% | |
| NXST Links: Profile News Message Board | |
| Charts:- Daily , Weekly | |
| Add NXST to Watchlist: View: Get Complete NXST Trend Analysis ➞ | |
 | TGNA TEGNA Inc. |
| Sector: Services & Goods | |
| SubSector: Broadcasting - TV | |
| MarketCap: 2791.83 Millions | |
| Recent Price: 13.64 Smart Investing & Trading Score: 60 | |
| Day Percent Change: -0.73% Day Change: -0.10 | |
| Week Change: 0.74% Year-to-date Change: -10.9% | |
| TGNA Links: Profile News Message Board | |
| Charts:- Daily , Weekly | |
| Add TGNA to Watchlist: View: Get Complete TGNA Trend Analysis ➞ | |
 | GGR Gogoro Inc. |
| Sector: Services & Goods | |
| SubSector: Auto Parts | |
| MarketCap: 856 Millions | |
| Recent Price: 1.58 Smart Investing & Trading Score: 59 | |
| Day Percent Change: 2.60% Day Change: 0.04 | |
| Week Change: 3.27% Year-to-date Change: -39.2% | |
| GGR Links: Profile News Message Board | |
| Charts:- Daily , Weekly | |
| Add GGR to Watchlist: View: Get Complete GGR Trend Analysis ➞ | |
 | OLPX Olaplex Holdings, Inc. |
| Sector: Services & Goods | |
| SubSector: Specialty Retail | |
| MarketCap: 2340 Millions | |
| Recent Price: 1.38 Smart Investing & Trading Score: 59 | |
| Day Percent Change: 0.00% Day Change: 0.00 | |
| Week Change: 2.99% Year-to-date Change: -46.1% | |
| OLPX Links: Profile News Message Board | |
| Charts:- Daily , Weekly | |
| Add OLPX to Watchlist: View: Get Complete OLPX Trend Analysis ➞ | |
 | FYBR Frontier Communications Parent, Inc. |
| Sector: Services & Goods | |
| SubSector: Telecom Services | |
| MarketCap: 4460 Millions | |
| Recent Price: 23.16 Smart Investing & Trading Score: 59 | |
| Day Percent Change: -1.86% Day Change: -0.44 | |
| Week Change: 0.89% Year-to-date Change: -8.2% | |
| FYBR Links: Profile News Message Board | |
| Charts:- Daily , Weekly | |
| Add FYBR to Watchlist: View: Get Complete FYBR Trend Analysis ➞ | |
 | EVGO EVgo, Inc. |
| Sector: Services & Goods | |
| SubSector: Specialty Retail | |
| MarketCap: 1140 Millions | |
| Recent Price: 1.80 Smart Investing & Trading Score: 59 | |
| Day Percent Change: -1.64% Day Change: -0.03 | |
| Week Change: 0% Year-to-date Change: -49.8% | |
| EVGO Links: Profile News Message Board | |
| Charts:- Daily , Weekly | |
| Add EVGO to Watchlist: View: Get Complete EVGO Trend Analysis ➞ | |
 | GPS The Gap, Inc. |
| Sector: Services & Goods | |
| SubSector: Apparel Stores | |
| MarketCap: 2936.08 Millions | |
| Recent Price: 20.52 Smart Investing & Trading Score: 58 | |
| Day Percent Change: -3.44% Day Change: -0.73 | |
| Week Change: -3.89% Year-to-date Change: -1.9% | |
| GPS Links: Profile News Message Board | |
| Charts:- Daily , Weekly | |
| Add GPS to Watchlist: View: Get Complete GPS Trend Analysis ➞ | |
 | AAP Advance Auto Parts, Inc. |
| Sector: Services & Goods | |
| SubSector: Auto Parts Stores | |
| MarketCap: 5977.7 Millions | |
| Recent Price: 72.98 Smart Investing & Trading Score: 58 | |
| Day Percent Change: -3.24% Day Change: -2.44 | |
| Week Change: -2.87% Year-to-date Change: 19.6% | |
| AAP Links: Profile News Message Board | |
| Charts:- Daily , Weekly | |
| Add AAP to Watchlist: View: Get Complete AAP Trend Analysis ➞ | |
 | OMC Omnicom Group Inc. |
| Sector: Services & Goods | |
| SubSector: Advertising Agencies | |
| MarketCap: 11813.5 Millions | |
| Recent Price: 92.84 Smart Investing & Trading Score: 58 | |
| Day Percent Change: -3.18% Day Change: -3.05 | |
| Week Change: -3.18% Year-to-date Change: 7.3% | |
| OMC Links: Profile News Message Board | |
| Charts:- Daily , Weekly | |
| Add OMC to Watchlist: View: Get Complete OMC Trend Analysis ➞ | |
 | VRRM Verra Mobility Corporation |
| Sector: Services & Goods | |
| SubSector: Security & Protection Services | |
| MarketCap: 1265.03 Millions | |
| Recent Price: 23.58 Smart Investing & Trading Score: 58 | |
| Day Percent Change: -3.16% Day Change: -0.77 | |
| Week Change: -2.68% Year-to-date Change: 2.4% | |
| VRRM Links: Profile News Message Board | |
| Charts:- Daily , Weekly | |
| Add VRRM to Watchlist: View: Get Complete VRRM Trend Analysis ➞ | |
 | DDS Dillard s, Inc. |
| Sector: Services & Goods | |
| SubSector: Department Stores | |
| MarketCap: 1170.82 Millions | |
| Recent Price: 437.99 Smart Investing & Trading Score: 58 | |
| Day Percent Change: -2.32% Day Change: -10.41 | |
| Week Change: -2.45% Year-to-date Change: 8.5% | |
| DDS Links: Profile News Message Board | |
| Charts:- Daily , Weekly | |
| Add DDS to Watchlist: View: Get Complete DDS Trend Analysis ➞ | |
 | SCVL Shoe Carnival, Inc. |
| Sector: Services & Goods | |
| SubSector: Apparel Stores | |
| MarketCap: 252.508 Millions | |
| Recent Price: 33.47 Smart Investing & Trading Score: 58 | |
| Day Percent Change: -2.05% Day Change: -0.70 | |
| Week Change: -3.07% Year-to-date Change: 10.8% | |
| SCVL Links: Profile News Message Board | |
| Charts:- Daily , Weekly | |
| Add SCVL to Watchlist: View: Get Complete SCVL Trend Analysis ➞ | |
 | AZO AutoZone, Inc. |
| Sector: Services & Goods | |
| SubSector: Auto Parts Stores | |
| MarketCap: 19128 Millions | |
| Recent Price: 2956.40 Smart Investing & Trading Score: 58 | |
| Day Percent Change: -1.41% Day Change: -42.38 | |
| Week Change: 0.35% Year-to-date Change: 14.3% | |
| AZO Links: Profile News Message Board | |
| Charts:- Daily , Weekly | |
| Add AZO to Watchlist: View: Get Complete AZO Trend Analysis ➞ | |
 | DFIN Donnelley Financial Solutions, Inc. |
| Sector: Services & Goods | |
| SubSector: Business Services | |
| MarketCap: 229.882 Millions | |
| Recent Price: 62.78 Smart Investing & Trading Score: 58 | |
| Day Percent Change: -1.37% Day Change: -0.87 | |
| Week Change: -0.38% Year-to-date Change: 0.7% | |
| DFIN Links: Profile News Message Board | |
| Charts:- Daily , Weekly | |
| Add DFIN to Watchlist: View: Get Complete DFIN Trend Analysis ➞ | |
 | KRT Karat Packaging Inc. |
| Sector: Services & Goods | |
| SubSector: Packaging & Containers | |
| MarketCap: 357 Millions | |
| Recent Price: 27.18 Smart Investing & Trading Score: 58 | |
| Day Percent Change: -0.95% Day Change: -0.26 | |
| Week Change: -0.48% Year-to-date Change: 9.1% | |
| KRT Links: Profile News Message Board | |
| Charts:- Daily , Weekly | |
| Add KRT to Watchlist: View: Get Complete KRT Trend Analysis ➞ | |
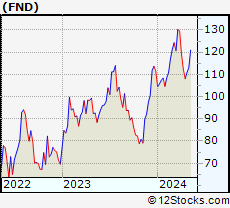 | FND Floor & Decor Holdings, Inc. |
| Sector: Services & Goods | |
| SubSector: Home Improvement Stores | |
| MarketCap: 3327.52 Millions | |
| Recent Price: 110.33 Smart Investing & Trading Score: 58 | |
| Day Percent Change: -0.84% Day Change: -0.93 | |
| Week Change: -0.54% Year-to-date Change: -1.1% | |
| FND Links: Profile News Message Board | |
| Charts:- Daily , Weekly | |
| Add FND to Watchlist: View: Get Complete FND Trend Analysis ➞ | |
 | WMK Weis Markets, Inc. |
| Sector: Services & Goods | |
| SubSector: Grocery Stores | |
| MarketCap: 1148.75 Millions | |
| Recent Price: 63.13 Smart Investing & Trading Score: 58 | |
| Day Percent Change: -0.71% Day Change: -0.45 | |
| Week Change: -0.83% Year-to-date Change: -1.3% | |
| WMK Links: Profile News Message Board | |
| Charts:- Daily , Weekly | |
| Add WMK to Watchlist: View: Get Complete WMK Trend Analysis ➞ | |
| For tabular summary view of above stock list: Summary View ➞ 0 - 25 , 25 - 50 , 50 - 75 , 75 - 100 , 100 - 125 , 125 - 150 , 150 - 175 , 175 - 200 , 200 - 225 , 225 - 250 , 250 - 275 , 275 - 300 , 300 - 325 , 325 - 350 , 350 - 375 , 375 - 400 , 400 - 425 , 425 - 450 , 450 - 475 | ||
| Click To Change The Sort Order: By Market Cap or Company Size Performance: Year-to-date, Week and Day | |
| Select Chart Type: | ||
|
Best Stocks Today 12Stocks.com |
© 2024 12Stocks.com Terms & Conditions Privacy Contact Us
All Information Provided Only For Education And Not To Be Used For Investing or Trading. See Terms & Conditions


One More Thing ... Get Best Stocks Delivered Daily!
Never Ever Miss A Move With Our Top Ten Stocks Lists
Find Best Stocks In Any Market - Bull or Bear Market
Take A Peek At Our Top Ten Stocks Lists: Daily, Weekly, Year-to-Date & Top Trends
Find Best Stocks In Any Market - Bull or Bear Market
Take A Peek At Our Top Ten Stocks Lists: Daily, Weekly, Year-to-Date & Top Trends
Consumer Services Stocks With Best Up Trends [0-bearish to 100-bullish]: Brinker [100], CAVA [100], Allego N.V[100], ATRenew [100], Domino s[100], Formula One[100], Formula One[100], Gaia [100], Watsco [100], Seaways[100], Universal Technical[100]
Best Consumer Services Stocks Year-to-Date:
U Power[2902.23%], Vroom [1764.74%], Yatsen Holding[497.32%], Fluent [370.15%], Research[129.49%], Codere Online[121.58%], Sweetgreen [98.85%], RealReal [90.3%], CAVA [65.46%], PaySign [63.75%], Bright Scholar[60%] Best Consumer Services Stocks This Week:
Golden Heaven[22.32%], Polestar Automotive[16.53%], SES AI[16.18%], Lanvin [13.92%], Smart Share[13.68%], Noodles & [11.43%], Research[11.28%], Brinker [9.77%], MOGU [9.03%], SunCar Technology[8.68%], Liberty SiriusXM[8.53%] Best Consumer Services Stocks Daily:
Golden Heaven[25.95%], Lanvin [19.21%], SES AI[17.04%], Research[12.98%], Polestar Automotive[11.79%], Smart Share[10.33%], MOGU [10.22%], Qurate Retail[10.05%], Brinker [7.93%], Sunlands Technology[7.86%], China Online[6.43%]