
 Login Sign Up


| |||||
 |  | ||||

| 12Stocks.com Market Intelligence |
Best Consumer Services Stocks
| In a hurry? Services & Goods Stocks: Performance Trends Table, Stock Charts
Sort Consumer Services: Daily, Weekly, Year-to-Date, Market Cap & Trends. Filter Services & Goods stocks list by size: All Large Mid-Range Small |
| 12Stocks.com Consumer Services Stocks Performances & Trends Daily | |||||||||
|
|  The overall Smart Investing & Trading Score is 35 (0-bearish to 100-bullish) which puts Consumer Services sector in short term bearish to neutral trend. The Smart Investing & Trading Score from previous trading session is 7 and hence an improvement of trend.
| ||||||||
Here are the Smart Investing & Trading Scores of the most requested Consumer Services stocks at 12Stocks.com (click stock name for detailed review):
|


| Consider signing up for our daily 12Stocks.com "Best Stocks Newsletter". You will never ever miss a big stock move again! |
| 12Stocks.com: Investing in Consumer Services sector with Stocks | |
|
The following table helps investors and traders sort through current performance and trends (as measured by Smart Investing & Trading Score) of various
stocks in the Consumer Services sector. Quick View: Move mouse or cursor over stock symbol (ticker) to view short-term Technical chart and over stock name to view long term chart. Click on  to add stock symbol to your watchlist and to add stock symbol to your watchlist and  to view watchlist. Click on any ticker or stock name for detailed market intelligence report for that stock. to view watchlist. Click on any ticker or stock name for detailed market intelligence report for that stock. |
12Stocks.com Performance of Stocks in Consumer Services Sector
| Ticker | Stock Name | Watchlist | Category | Recent Price | Smart Investing & Trading Score | Change % | YTD Change% |
| MCO | Moody s |   | Services | 376.40 | 25 | 0.94% | -3.63% |
| WINA | Winmark | | Retail | 360.57 | 25 | 0.35% | -13.65% |
| LVS | Las Vegas | | Casinos | 46.65 | 25 | 4.74% | -5.20% |
| WW | WW | | Services | 1.89 | 25 | 3.28% | -78.40% |
| EDU | New Oriental | | Education | 80.89 | 25 | 3.19% | 10.38% |
| CBZ | CBIZ | | Services | 72.55 | 25 | 1.65% | 15.91% |
| MATW | Matthews | | Services | 27.12 | 25 | 1.54% | -26.00% |
| BYD | Boyd Gaming | | Casinos | 54.16 | 25 | 1.52% | -13.50% |
| IMAX | IMAX | | Entertainment | 16.38 | 25 | 1.17% | 9.05% |
| HD | Home Depot | | Retail | 335.53 | 25 | 1.07% | -3.18% |
| CAH | Cardinal Health | | Pharmacy | 102.98 | 25 | 0.79% | 2.16% |
| AZO | AutoZone | | Auto Parts | 2962.09 | 25 | 0.52% | 14.56% |
| SCHL | Scholastic | | Publishing | 35.95 | 25 | 0.48% | -4.64% |
| EYE | National Vision | | Retail | 17.57 | 25 | -0.73% | -16.05% |
| FUN | Cedar Fair | | Entertainment | 37.86 | 25 | -0.63% | -4.87% |
| FAST | Fastenal | | Equipment | 68.09 | 25 | -0.13% | 5.13% |
| RH | RH | | Retail | 262.01 | 24 | 6.94% | -10.11% |
| LQDT | Liquidity Services | | Retail | 17.75 | 24 | 2.01% | 3.14% |
| LPX | Louisiana-Pacific | | Wholesale | 73.85 | 23 | 1.34% | 4.26% |
| WOOF | Petco Health | | Specialty Retail | 1.57 | 23 | 0.64% | -50.32% |
| DBI | Designer Brands | | Apparel | 9.41 | 22 | 2.39% | 6.33% |
| BIRD | Allbirds | | Apparel Retail | 0.61 | 22 | 12.36% | -50.40% |
| QRTEA | Qurate Retail | | Retail | 0.94 | 22 | 12.13% | 7.34% |
| PAG | Penske Automotive | | Automobile | 152.50 | 22 | 0.34% | -4.99% |
| GENI | Genius Sports | | Internet Content & Information | 5.13 | 20 | 1.89% | -17.67% |
| For chart view version of above stock list: Chart View ➞ 0 - 25 , 25 - 50 , 50 - 75 , 75 - 100 , 100 - 125 , 125 - 150 , 150 - 175 , 175 - 200 , 200 - 225 , 225 - 250 , 250 - 275 , 275 - 300 , 300 - 325 , 325 - 350 , 350 - 375 , 375 - 400 , 400 - 425 , 425 - 450 , 450 - 475 | ||
 | Click To Change The Sort Order: By Market Cap or Company Size Performance: Year-to-date, Week and Day |  |
|
Get the most comprehensive stock market coverage daily at 12Stocks.com ➞ Best Stocks Today ➞ Best Stocks Weekly ➞ Best Stocks Year-to-Date ➞ Best Stocks Trends ➞  Best Stocks Today 12Stocks.com Best Nasdaq Stocks ➞ Best S&P 500 Stocks ➞ Best Tech Stocks ➞ Best Biotech Stocks ➞ |
| Detailed Overview of Consumer Services Stocks |
| Consumer Services Technical Overview, Leaders & Laggards, Top Consumer Services ETF Funds & Detailed Consumer Services Stocks List, Charts, Trends & More |
| Consumer Services Sector: Technical Analysis, Trends & YTD Performance | |
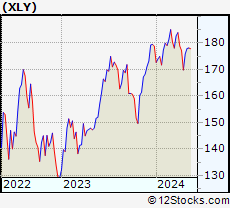
| Consumer Services sector is composed of stocks
from retail, entertainment, media/publishing, consumer goods
and services subsectors. Consumer Services sector, as represented by XLY, an exchange-traded fund [ETF] that holds basket of Consumer Services stocks (e.g, Walmart, Alibaba) is down by -1.17% and is currently underperforming the overall market by -6.79% year-to-date. Below is a quick view of Technical charts and trends: |
|
 XLY Weekly Chart |
|
| Long Term Trend: Not Good | |
| Medium Term Trend: Deteriorating | |
 XLY Daily Chart |
|
| Short Term Trend: Deteriorating | |
| Overall Trend Score: 35 | |
| YTD Performance: -1.17% | |
| **Trend Scores & Views Are Only For Educational Purposes And Not For Investing | |
| 12Stocks.com: Top Performing Consumer Services Sector Stocks | ||||||||||||||||||||||||||||||||||||||||||||||||
 The top performing Consumer Services sector stocks year to date are
Now, more recently, over last week, the top performing Consumer Services sector stocks on the move are


|
||||||||||||||||||||||||||||||||||||||||||||||||
| 12Stocks.com: Investing in Consumer Services Sector using Exchange Traded Funds | |
|
The following table shows list of key exchange traded funds (ETF) that
help investors track Consumer Services Index. For detailed view, check out our ETF Funds section of our website. Quick View: Move mouse or cursor over ETF symbol (ticker) to view short-term Technical chart and over ETF name to view long term chart. Click on ticker or stock name for detailed view. Click on to add stock symbol to your watchlist and to view watchlist. |
12Stocks.com List of ETFs that track Consumer Services Index
| Ticker | ETF Name | Watchlist | Recent Price | Smart Investing & Trading Score | Change % | Week % | Year-to-date % |
| XLY | Consumer Discret Sel | | 176.72 | 35 | 1.26 | 0.46 | -1.17% |
| RTH | Retail | | 198.79 | 7 | 1.39 | -1.14 | 5.61% |
| IYC | Consumer Services | | 78.43 | 7 | 1.38 | 0.09 | 3.51% |
| XRT | Retail | | 72.49 | 25 | 1.70 | -1 | 0.24% |
| IYK | Consumer Goods | | 66.46 | 63 | 0.51 | -0.45 | 4% |
| UCC | Consumer Services | | 33.96 | 49 | 1.98 | -0.59 | -5.42% |
| RETL | Retail Bull 3X | | 8.53 | 5 | 5.44 | -3.4 | -6.47% |
| RXI | Globl Consumer Discretionary | | 161.47 | 27 | 1.46 | 0.18 | 1.52% |
| SCC | Short Consumer Services | | 15.64 | 88 | -2.13 | -0.89 | 2.06% |
| UGE | Consumer Goods | | 17.16 | 80 | 1.81 | -0.06 | 9.01% |
| 12Stocks.com: Charts, Trends, Fundamental Data and Performances of Consumer Services Stocks | |
|
We now take in-depth look at all Consumer Services stocks including charts, multi-period performances and overall trends (as measured by Smart Investing & Trading Score). One can sort Consumer Services stocks (click link to choose) by Daily, Weekly and by Year-to-Date performances. Also, one can sort by size of the company or by market capitalization. |
| Select Your Default Chart Type: | |||||
| |||||
| Click on stock symbol or name for detailed view. Click on to add stock symbol to your watchlist and to view watchlist. Quick View: Move mouse or cursor over "Daily" to quickly view daily Technical stock chart and over "Weekly" to view weekly Technical stock chart. | |||||

 | MCO Moody s Corporation |
| Sector: Services & Goods | |
| SubSector: Business Services | |
| MarketCap: 35998.5 Millions | |
| Recent Price: 376.40 Smart Investing & Trading Score: 25 | |
| Day Percent Change: 0.94% Day Change: 3.51 | |
| Week Change: 0.07% Year-to-date Change: -3.6% | |
| MCO Links: Profile News Message Board | |
| Charts:- Daily , Weekly | |
| Add MCO to Watchlist: View: Get Complete MCO Trend Analysis ➞ | |
 | WINA Winmark Corporation |
| Sector: Services & Goods | |
| SubSector: Specialty Retail, Other | |
| MarketCap: 520.444 Millions | |
| Recent Price: 360.57 Smart Investing & Trading Score: 25 | |
| Day Percent Change: 0.35% Day Change: 1.27 | |
| Week Change: 0.16% Year-to-date Change: -13.7% | |
| WINA Links: Profile News Message Board | |
| Charts:- Daily , Weekly | |
| Add WINA to Watchlist: View: Get Complete WINA Trend Analysis ➞ | |
 | LVS Las Vegas Sands Corp. |
| Sector: Services & Goods | |
| SubSector: Resorts & Casinos | |
| MarketCap: 36431.6 Millions | |
| Recent Price: 46.65 Smart Investing & Trading Score: 25 | |
| Day Percent Change: 4.74% Day Change: 2.11 | |
| Week Change: 2.64% Year-to-date Change: -5.2% | |
| LVS Links: Profile News Message Board | |
| Charts:- Daily , Weekly | |
| Add LVS to Watchlist: View: Get Complete LVS Trend Analysis ➞ | |
 | WW WW International, Inc. |
| Sector: Services & Goods | |
| SubSector: Personal Services | |
| MarketCap: 1186.25 Millions | |
| Recent Price: 1.89 Smart Investing & Trading Score: 25 | |
| Day Percent Change: 3.28% Day Change: 0.06 | |
| Week Change: 8% Year-to-date Change: -78.4% | |
| WW Links: Profile News Message Board | |
| Charts:- Daily , Weekly | |
| Add WW to Watchlist: View: Get Complete WW Trend Analysis ➞ | |
 | EDU New Oriental Education & Technology Group Inc. |
| Sector: Services & Goods | |
| SubSector: Education & Training Services | |
| MarketCap: 18673.7 Millions | |
| Recent Price: 80.89 Smart Investing & Trading Score: 25 | |
| Day Percent Change: 3.19% Day Change: 2.50 | |
| Week Change: -2.85% Year-to-date Change: 10.4% | |
| EDU Links: Profile News Message Board | |
| Charts:- Daily , Weekly | |
| Add EDU to Watchlist: View: Get Complete EDU Trend Analysis ➞ | |
 | CBZ CBIZ, Inc. |
| Sector: Services & Goods | |
| SubSector: Business Services | |
| MarketCap: 1121.32 Millions | |
| Recent Price: 72.55 Smart Investing & Trading Score: 25 | |
| Day Percent Change: 1.65% Day Change: 1.18 | |
| Week Change: -0.29% Year-to-date Change: 15.9% | |
| CBZ Links: Profile News Message Board | |
| Charts:- Daily , Weekly | |
| Add CBZ to Watchlist: View: Get Complete CBZ Trend Analysis ➞ | |
 | MATW Matthews International Corporation |
| Sector: Services & Goods | |
| SubSector: Personal Services | |
| MarketCap: 803.325 Millions | |
| Recent Price: 27.12 Smart Investing & Trading Score: 25 | |
| Day Percent Change: 1.54% Day Change: 0.41 | |
| Week Change: -0.11% Year-to-date Change: -26.0% | |
| MATW Links: Profile News Message Board | |
| Charts:- Daily , Weekly | |
| Add MATW to Watchlist: View: Get Complete MATW Trend Analysis ➞ | |
 | BYD Boyd Gaming Corporation |
| Sector: Services & Goods | |
| SubSector: Resorts & Casinos | |
| MarketCap: 1652.54 Millions | |
| Recent Price: 54.16 Smart Investing & Trading Score: 25 | |
| Day Percent Change: 1.52% Day Change: 0.81 | |
| Week Change: 1.84% Year-to-date Change: -13.5% | |
| BYD Links: Profile News Message Board | |
| Charts:- Daily , Weekly | |
| Add BYD to Watchlist: View: Get Complete BYD Trend Analysis ➞ | |
 | IMAX IMAX Corporation |
| Sector: Services & Goods | |
| SubSector: Entertainment - Diversified | |
| MarketCap: 874.237 Millions | |
| Recent Price: 16.38 Smart Investing & Trading Score: 25 | |
| Day Percent Change: 1.17% Day Change: 0.19 | |
| Week Change: -4.49% Year-to-date Change: 9.1% | |
| IMAX Links: Profile News Message Board | |
| Charts:- Daily , Weekly | |
| Add IMAX to Watchlist: View: Get Complete IMAX Trend Analysis ➞ | |
 | HD The Home Depot, Inc. |
| Sector: Services & Goods | |
| SubSector: Home Improvement Stores | |
| MarketCap: 185389 Millions | |
| Recent Price: 335.53 Smart Investing & Trading Score: 25 | |
| Day Percent Change: 1.07% Day Change: 3.56 | |
| Week Change: 0.13% Year-to-date Change: -3.2% | |
| HD Links: Profile News Message Board | |
| Charts:- Daily , Weekly | |
| Add HD to Watchlist: View: Get Complete HD Trend Analysis ➞ | |
 | CAH Cardinal Health, Inc. |
| Sector: Services & Goods | |
| SubSector: Drugs Wholesale | |
| MarketCap: 14509.9 Millions | |
| Recent Price: 102.98 Smart Investing & Trading Score: 25 | |
| Day Percent Change: 0.79% Day Change: 0.81 | |
| Week Change: -0.22% Year-to-date Change: 2.2% | |
| CAH Links: Profile News Message Board | |
| Charts:- Daily , Weekly | |
| Add CAH to Watchlist: View: Get Complete CAH Trend Analysis ➞ | |
 | AZO AutoZone, Inc. |
| Sector: Services & Goods | |
| SubSector: Auto Parts Stores | |
| MarketCap: 19128 Millions | |
| Recent Price: 2962.09 Smart Investing & Trading Score: 25 | |
| Day Percent Change: 0.52% Day Change: 15.28 | |
| Week Change: 0.55% Year-to-date Change: 14.6% | |
| AZO Links: Profile News Message Board | |
| Charts:- Daily , Weekly | |
| Add AZO to Watchlist: View: Get Complete AZO Trend Analysis ➞ | |
 | SCHL Scholastic Corporation |
| Sector: Services & Goods | |
| SubSector: Publishing - Books | |
| MarketCap: 791 Millions | |
| Recent Price: 35.95 Smart Investing & Trading Score: 25 | |
| Day Percent Change: 0.48% Day Change: 0.17 | |
| Week Change: -1.29% Year-to-date Change: -4.6% | |
| SCHL Links: Profile News Message Board | |
| Charts:- Daily , Weekly | |
| Add SCHL to Watchlist: View: Get Complete SCHL Trend Analysis ➞ | |
 | EYE National Vision Holdings, Inc. |
| Sector: Services & Goods | |
| SubSector: Specialty Retail, Other | |
| MarketCap: 1290.84 Millions | |
| Recent Price: 17.57 Smart Investing & Trading Score: 25 | |
| Day Percent Change: -0.73% Day Change: -0.13 | |
| Week Change: -1.73% Year-to-date Change: -16.1% | |
| EYE Links: Profile News Message Board | |
| Charts:- Daily , Weekly | |
| Add EYE to Watchlist: View: Get Complete EYE Trend Analysis ➞ | |
 | FUN Cedar Fair, L.P. |
| Sector: Services & Goods | |
| SubSector: General Entertainment | |
| MarketCap: 1440.49 Millions | |
| Recent Price: 37.86 Smart Investing & Trading Score: 25 | |
| Day Percent Change: -0.63% Day Change: -0.24 | |
| Week Change: -1.2% Year-to-date Change: -4.9% | |
| FUN Links: Profile News Message Board | |
| Charts:- Daily , Weekly | |
| Add FUN to Watchlist: View: Get Complete FUN Trend Analysis ➞ | |
 | FAST Fastenal Company |
| Sector: Services & Goods | |
| SubSector: Industrial Equipment Wholesale | |
| MarketCap: 17609.9 Millions | |
| Recent Price: 68.09 Smart Investing & Trading Score: 25 | |
| Day Percent Change: -0.13% Day Change: -0.09 | |
| Week Change: -0.12% Year-to-date Change: 5.1% | |
| FAST Links: Profile News Message Board | |
| Charts:- Daily , Weekly | |
| Add FAST to Watchlist: View: Get Complete FAST Trend Analysis ➞ | |
 | RH RH |
| Sector: Services & Goods | |
| SubSector: Home Furnishing Stores | |
| MarketCap: 1828.25 Millions | |
| Recent Price: 262.01 Smart Investing & Trading Score: 24 | |
| Day Percent Change: 6.94% Day Change: 17.01 | |
| Week Change: 5.26% Year-to-date Change: -10.1% | |
| RH Links: Profile News Message Board | |
| Charts:- Daily , Weekly | |
| Add RH to Watchlist: View: Get Complete RH Trend Analysis ➞ | |
 | LQDT Liquidity Services, Inc. |
| Sector: Services & Goods | |
| SubSector: Catalog & Mail Order Houses | |
| MarketCap: 144.492 Millions | |
| Recent Price: 17.75 Smart Investing & Trading Score: 24 | |
| Day Percent Change: 2.01% Day Change: 0.35 | |
| Week Change: 1.89% Year-to-date Change: 3.1% | |
| LQDT Links: Profile News Message Board | |
| Charts:- Daily , Weekly | |
| Add LQDT to Watchlist: View: Get Complete LQDT Trend Analysis ➞ | |
 | LPX Louisiana-Pacific Corporation |
| Sector: Services & Goods | |
| SubSector: Building Materials Wholesale | |
| MarketCap: 1943.43 Millions | |
| Recent Price: 73.85 Smart Investing & Trading Score: 23 | |
| Day Percent Change: 1.34% Day Change: 0.98 | |
| Week Change: -0.97% Year-to-date Change: 4.3% | |
| LPX Links: Profile News Message Board | |
| Charts:- Daily , Weekly | |
| Add LPX to Watchlist: View: Get Complete LPX Trend Analysis ➞ | |
 | WOOF Petco Health and Wellness Company, Inc. |
| Sector: Services & Goods | |
| SubSector: Specialty Retail | |
| MarketCap: 2030 Millions | |
| Recent Price: 1.57 Smart Investing & Trading Score: 23 | |
| Day Percent Change: 0.64% Day Change: 0.01 | |
| Week Change: 3.97% Year-to-date Change: -50.3% | |
| WOOF Links: Profile News Message Board | |
| Charts:- Daily , Weekly | |
| Add WOOF to Watchlist: View: Get Complete WOOF Trend Analysis ➞ | |
 | DBI Designer Brands Inc. |
| Sector: Services & Goods | |
| SubSector: Apparel Stores | |
| MarketCap: 467.308 Millions | |
| Recent Price: 9.41 Smart Investing & Trading Score: 22 | |
| Day Percent Change: 2.39% Day Change: 0.22 | |
| Week Change: -2.59% Year-to-date Change: 6.3% | |
| DBI Links: Profile News Message Board | |
| Charts:- Daily , Weekly | |
| Add DBI to Watchlist: View: Get Complete DBI Trend Analysis ➞ | |
 | BIRD Allbirds, Inc. |
| Sector: Services & Goods | |
| SubSector: Apparel Retail | |
| MarketCap: 184 Millions | |
| Recent Price: 0.61 Smart Investing & Trading Score: 22 | |
| Day Percent Change: 12.36% Day Change: 0.07 | |
| Week Change: -0.41% Year-to-date Change: -50.4% | |
| BIRD Links: Profile News Message Board | |
| Charts:- Daily , Weekly | |
| Add BIRD to Watchlist: View: Get Complete BIRD Trend Analysis ➞ | |
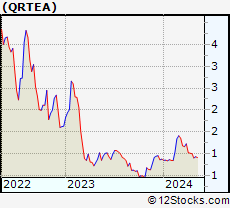 | QRTEA Qurate Retail, Inc. |
| Sector: Services & Goods | |
| SubSector: Specialty Retail, Other | |
| MarketCap: 1980.44 Millions | |
| Recent Price: 0.94 Smart Investing & Trading Score: 22 | |
| Day Percent Change: 12.13% Day Change: 0.10 | |
| Week Change: 4.29% Year-to-date Change: 7.3% | |
| QRTEA Links: Profile News Message Board | |
| Charts:- Daily , Weekly | |
| Add QRTEA to Watchlist: View: Get Complete QRTEA Trend Analysis ➞ | |
 | PAG Penske Automotive Group, Inc. |
| Sector: Services & Goods | |
| SubSector: Auto Dealerships | |
| MarketCap: 2088.81 Millions | |
| Recent Price: 152.50 Smart Investing & Trading Score: 22 | |
| Day Percent Change: 0.34% Day Change: 0.52 | |
| Week Change: -2.01% Year-to-date Change: -5.0% | |
| PAG Links: Profile News Message Board | |
| Charts:- Daily , Weekly | |
| Add PAG to Watchlist: View: Get Complete PAG Trend Analysis ➞ | |
 | GENI Genius Sports Limited |
| Sector: Services & Goods | |
| SubSector: Internet Content & Information | |
| MarketCap: 1410 Millions | |
| Recent Price: 5.13 Smart Investing & Trading Score: 20 | |
| Day Percent Change: 1.89% Day Change: 0.09 | |
| Week Change: -1.25% Year-to-date Change: -17.7% | |
| GENI Links: Profile News Message Board | |
| Charts:- Daily , Weekly | |
| Add GENI to Watchlist: View: Get Complete GENI Trend Analysis ➞ | |
| For tabular summary view of above stock list: Summary View ➞ 0 - 25 , 25 - 50 , 50 - 75 , 75 - 100 , 100 - 125 , 125 - 150 , 150 - 175 , 175 - 200 , 200 - 225 , 225 - 250 , 250 - 275 , 275 - 300 , 300 - 325 , 325 - 350 , 350 - 375 , 375 - 400 , 400 - 425 , 425 - 450 , 450 - 475 | ||
| Click To Change The Sort Order: By Market Cap or Company Size Performance: Year-to-date, Week and Day | |
| Select Chart Type: | ||
|
Best Stocks Today 12Stocks.com |
© 2024 12Stocks.com Terms & Conditions Privacy Contact Us
All Information Provided Only For Education And Not To Be Used For Investing or Trading. See Terms & Conditions


One More Thing ... Get Best Stocks Delivered Daily!
Never Ever Miss A Move With Our Top Ten Stocks Lists
Find Best Stocks In Any Market - Bull or Bear Market
Take A Peek At Our Top Ten Stocks Lists: Daily, Weekly, Year-to-Date & Top Trends
Find Best Stocks In Any Market - Bull or Bear Market
Take A Peek At Our Top Ten Stocks Lists: Daily, Weekly, Year-to-Date & Top Trends
Consumer Services Stocks With Best Up Trends [0-bearish to 100-bullish]: Perdoceo Education[100], Gannett Co[100], Sprouts Farmers[100], MINISO [100], Smart Share[100], Thomson Reuters[100], Gray Television[100], WESCO [100], Alibaba [100], Tetra Tech[100], Outbrain [100]
Best Consumer Services Stocks Year-to-Date:
U Power[2974.78%], Vroom [1965.31%], Yatsen Holding[475.45%], Fluent [397.76%], Research[138.8%], Codere Online[132.88%], Carvana Co[120.06%], Sweetgreen [88.85%], RealReal [87.56%], Smart Share[68.74%], PaySign [64.64%] Best Consumer Services Stocks This Week:
Chicken Soup[157.39%], Smart Share[39.89%], Carvana Co[38.18%], Perdoceo Education[27.84%], Olaplex [24.63%], CareDx [22.62%], Polestar Automotive[21.61%], XPeng [19.9%], Gannett Co[18.6%], OneSpaWorld [16.28%], Li Auto[15.79%] Best Consumer Services Stocks Daily:
Carvana Co[33.77%], Perdoceo Education[31.46%], Gannett Co[26.97%], Sunnova Energy[25.21%], Chicken Soup[20.82%], Olaplex [19.29%], GameStop [16.96%], Wayfair [16.05%], XPeng [15.76%], Children s[14.88%], OneWater Marine[14.09%]