
 Login Sign Up


| |||||
 |  | ||||

| 12Stocks.com Market Intelligence |
Best Consumer Services Stocks
| In a hurry? Services & Goods Stocks: Performance Trends Table, Stock Charts
Sort Consumer Services: Daily, Weekly, Year-to-Date, Market Cap & Trends. Filter Services & Goods stocks list by size: All Large Mid-Range Small |
| 12Stocks.com Consumer Services Stocks Performances & Trends Daily | |||||||||
|
|  The overall Smart Investing & Trading Score is 35 (0-bearish to 100-bullish) which puts Consumer Services sector in short term bearish to neutral trend. The Smart Investing & Trading Score from previous trading session is 7 and hence an improvement of trend.
| ||||||||
Here are the Smart Investing & Trading Scores of the most requested Consumer Services stocks at 12Stocks.com (click stock name for detailed review):
|


| Consider signing up for our daily 12Stocks.com "Best Stocks Newsletter". You will never ever miss a big stock move again! |
| 12Stocks.com: Investing in Consumer Services sector with Stocks | |
|
The following table helps investors and traders sort through current performance and trends (as measured by Smart Investing & Trading Score) of various
stocks in the Consumer Services sector. Quick View: Move mouse or cursor over stock symbol (ticker) to view short-term Technical chart and over stock name to view long term chart. Click on  to add stock symbol to your watchlist and to add stock symbol to your watchlist and  to view watchlist. Click on any ticker or stock name for detailed market intelligence report for that stock. to view watchlist. Click on any ticker or stock name for detailed market intelligence report for that stock. |
12Stocks.com Performance of Stocks in Consumer Services Sector
| Ticker | Stock Name | Watchlist | Category | Recent Price | Smart Investing & Trading Score | Change % | YTD Change% |
| SGHC | Super |   | Gambling | 3.31 | 100 | 1.53% | 3.60% |
| OUT | Outfront Media | | Marketing | 16.04 | 58 | -1.53% | 14.90% |
| NSP | Insperity | | Services | 103.17 | 26 | -1.08% | -11.99% |
| FIGS | FIGS | | Apparel Manufacturing | 5.03 | 45 | -0.89% | -29.52% |
| KTOS | Kratos Defense | | Security | 18.11 | 7 | -0.44% | -10.74% |
| VSCO | Victorias Secret | | Apparel Retail | 17.69 | 30 | 1.26% | -33.55% |
| HGV | Hilton Grand | | Casinos | 43.12 | 27 | 3.36% | 7.32% |
| BKR | Baker Hughes | | Services | 31.93 | 36 | 0.14% | -6.57% |
| HSAI | Hesai | | Auto Parts | 4.90 | 100 | 4.93% | -46.04% |
| GDEV | GDEV | | Electronic Gaming & Multimedia | 2.17 | 27 | 0.46% | -1.37% |
| EYE | National Vision | | Retail | 17.56 | 25 | -0.79% | -16.10% |
| PRAA | PRA | | Services | 24.68 | 57 | 1.67% | -5.78% |
| SIX | Six Flags | | Entertainment | 23.99 | 42 | 1.95% | -4.35% |
| ATGE | Adtalem Global | | Education | 52.40 | 90 | 3.72% | -11.11% |
| VRRM | Verra Mobility | | Security | 24.07 | 43 | 1.58% | 4.54% |
| SBH | Sally Beauty | | Retail | 10.95 | 49 | 3.50% | -17.55% |
| ICFI | ICF | | Services | 146.29 | 37 | 1.64% | 9.10% |
| ABG | Asbury Automotive | | Automobile | 208.45 | 20 | -1.04% | -7.34% |
| GHG | GreenTree Hospitality | | Lodging | 3.06 | 93 | -4.38% | -18.62% |
| WW | WW | | Services | 1.89 | 25 | 3.28% | -78.40% |
| PENN | Penn National | | Casinos | 14.99 | 0 | -8.79% | -42.37% |
| RUSHA | Rush Enterprises | | Automobile | 43.34 | 10 | 1.24% | -13.84% |
| NOVA | Sunnova Energy | | Services | 4.42 | 44 | 25.21% | -71.02% |
| DDS | Dillard s | | Department | 431.30 | 48 | 1.97% | 6.85% |
| KIND | Nextdoor | | Internet Content & Information | 2.16 | 64 | 1.89% | 16.76% |
| For chart view version of above stock list: Chart View ➞ 0 - 25 , 25 - 50 , 50 - 75 , 75 - 100 , 100 - 125 , 125 - 150 , 150 - 175 , 175 - 200 , 200 - 225 , 225 - 250 , 250 - 275 , 275 - 300 , 300 - 325 , 325 - 350 , 350 - 375 , 375 - 400 , 400 - 425 , 425 - 450 , 450 - 475 | ||
 | Click To Change The Sort Order: By Market Cap or Company Size Performance: Year-to-date, Week and Day |  |
|
Get the most comprehensive stock market coverage daily at 12Stocks.com ➞ Best Stocks Today ➞ Best Stocks Weekly ➞ Best Stocks Year-to-Date ➞ Best Stocks Trends ➞  Best Stocks Today 12Stocks.com Best Nasdaq Stocks ➞ Best S&P 500 Stocks ➞ Best Tech Stocks ➞ Best Biotech Stocks ➞ |
| Detailed Overview of Consumer Services Stocks |
| Consumer Services Technical Overview, Leaders & Laggards, Top Consumer Services ETF Funds & Detailed Consumer Services Stocks List, Charts, Trends & More |
| Consumer Services Sector: Technical Analysis, Trends & YTD Performance | |
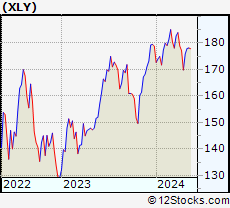
| Consumer Services sector is composed of stocks
from retail, entertainment, media/publishing, consumer goods
and services subsectors. Consumer Services sector, as represented by XLY, an exchange-traded fund [ETF] that holds basket of Consumer Services stocks (e.g, Walmart, Alibaba) is down by -1.17% and is currently underperforming the overall market by -6.79% year-to-date. Below is a quick view of Technical charts and trends: |
|
 XLY Weekly Chart |
|
| Long Term Trend: Not Good | |
| Medium Term Trend: Deteriorating | |
 XLY Daily Chart |
|
| Short Term Trend: Deteriorating | |
| Overall Trend Score: 35 | |
| YTD Performance: -1.17% | |
| **Trend Scores & Views Are Only For Educational Purposes And Not For Investing | |
| 12Stocks.com: Top Performing Consumer Services Sector Stocks | ||||||||||||||||||||||||||||||||||||||||||||||||
 The top performing Consumer Services sector stocks year to date are
Now, more recently, over last week, the top performing Consumer Services sector stocks on the move are


|
||||||||||||||||||||||||||||||||||||||||||||||||
| 12Stocks.com: Investing in Consumer Services Sector using Exchange Traded Funds | |
|
The following table shows list of key exchange traded funds (ETF) that
help investors track Consumer Services Index. For detailed view, check out our ETF Funds section of our website. Quick View: Move mouse or cursor over ETF symbol (ticker) to view short-term Technical chart and over ETF name to view long term chart. Click on ticker or stock name for detailed view. Click on to add stock symbol to your watchlist and to view watchlist. |
12Stocks.com List of ETFs that track Consumer Services Index
| Ticker | ETF Name | Watchlist | Recent Price | Smart Investing & Trading Score | Change % | Week % | Year-to-date % |
| XLY | Consumer Discret Sel | | 176.72 | 35 | 1.26 | 0.46 | -1.17% |
| RTH | Retail | | 199.00 | 7 | 1.49 | -1.03 | 5.72% |
| IYC | Consumer Services | | 78.35 | 7 | 1.28 | -0.01 | 3.41% |
| XRT | Retail | | 72.49 | 25 | 1.70 | -1 | 0.24% |
| IYK | Consumer Goods | | 66.46 | 63 | 0.51 | -0.45 | 4% |
| UCC | Consumer Services | | 33.96 | 49 | 1.98 | -0.59 | -5.42% |
| RETL | Retail Bull 3X | | 8.53 | 5 | 5.44 | -3.4 | -6.47% |
| RXI | Globl Consumer Discretionary | | 161.47 | 27 | 1.46 | 0.18 | 1.52% |
| SCC | Short Consumer Services | | 15.66 | 88 | -1.97 | -0.73 | 2.23% |
| UGE | Consumer Goods | | 16.92 | 80 | 0.39 | -1.46 | 7.49% |
| 12Stocks.com: Charts, Trends, Fundamental Data and Performances of Consumer Services Stocks | |
|
We now take in-depth look at all Consumer Services stocks including charts, multi-period performances and overall trends (as measured by Smart Investing & Trading Score). One can sort Consumer Services stocks (click link to choose) by Daily, Weekly and by Year-to-Date performances. Also, one can sort by size of the company or by market capitalization. |
| Select Your Default Chart Type: | |||||
| |||||
| Click on stock symbol or name for detailed view. Click on to add stock symbol to your watchlist and to view watchlist. Quick View: Move mouse or cursor over "Daily" to quickly view daily Technical stock chart and over "Weekly" to view weekly Technical stock chart. | |||||

 | SGHC Super Group (SGHC) Limited |
| Sector: Services & Goods | |
| SubSector: Gambling | |
| MarketCap: 1390 Millions | |
| Recent Price: 3.31 Smart Investing & Trading Score: 100 | |
| Day Percent Change: 1.53% Day Change: 0.05 | |
| Week Change: 9.97% Year-to-date Change: 3.6% | |
| SGHC Links: Profile News Message Board | |
| Charts:- Daily , Weekly | |
| Add SGHC to Watchlist: View: Get Complete SGHC Trend Analysis ➞ | |
 | OUT Outfront Media Inc. |
| Sector: Services & Goods | |
| SubSector: Marketing Services | |
| MarketCap: 1388.15 Millions | |
| Recent Price: 16.04 Smart Investing & Trading Score: 58 | |
| Day Percent Change: -1.53% Day Change: -0.25 | |
| Week Change: 1.97% Year-to-date Change: 14.9% | |
| OUT Links: Profile News Message Board | |
| Charts:- Daily , Weekly | |
| Add OUT to Watchlist: View: Get Complete OUT Trend Analysis ➞ | |
 | NSP Insperity, Inc. |
| Sector: Services & Goods | |
| SubSector: Business Services | |
| MarketCap: 1385.32 Millions | |
| Recent Price: 103.17 Smart Investing & Trading Score: 26 | |
| Day Percent Change: -1.08% Day Change: -1.13 | |
| Week Change: -0.96% Year-to-date Change: -12.0% | |
| NSP Links: Profile News Message Board | |
| Charts:- Daily , Weekly | |
| Add NSP to Watchlist: View: Get Complete NSP Trend Analysis ➞ | |
 | FIGS FIGS, Inc. |
| Sector: Services & Goods | |
| SubSector: Apparel Manufacturing | |
| MarketCap: 1370 Millions | |
| Recent Price: 5.03 Smart Investing & Trading Score: 45 | |
| Day Percent Change: -0.89% Day Change: -0.04 | |
| Week Change: 2.13% Year-to-date Change: -29.5% | |
| FIGS Links: Profile News Message Board | |
| Charts:- Daily , Weekly | |
| Add FIGS to Watchlist: View: Get Complete FIGS Trend Analysis ➞ | |
 | KTOS Kratos Defense & Security Solutions, Inc. |
| Sector: Services & Goods | |
| SubSector: Security & Protection Services | |
| MarketCap: 1369.63 Millions | |
| Recent Price: 18.11 Smart Investing & Trading Score: 7 | |
| Day Percent Change: -0.44% Day Change: -0.08 | |
| Week Change: -3.95% Year-to-date Change: -10.7% | |
| KTOS Links: Profile News Message Board | |
| Charts:- Daily , Weekly | |
| Add KTOS to Watchlist: View: Get Complete KTOS Trend Analysis ➞ | |
 | VSCO Victorias Secret & Co. |
| Sector: Services & Goods | |
| SubSector: Apparel Retail | |
| MarketCap: 1340 Millions | |
| Recent Price: 17.69 Smart Investing & Trading Score: 30 | |
| Day Percent Change: 1.26% Day Change: 0.22 | |
| Week Change: 1.49% Year-to-date Change: -33.6% | |
| VSCO Links: Profile News Message Board | |
| Charts:- Daily , Weekly | |
| Add VSCO to Watchlist: View: Get Complete VSCO Trend Analysis ➞ | |
 | HGV Hilton Grand Vacations Inc. |
| Sector: Services & Goods | |
| SubSector: Resorts & Casinos | |
| MarketCap: 1333.04 Millions | |
| Recent Price: 43.12 Smart Investing & Trading Score: 27 | |
| Day Percent Change: 3.36% Day Change: 1.40 | |
| Week Change: -2.75% Year-to-date Change: 7.3% | |
| HGV Links: Profile News Message Board | |
| Charts:- Daily , Weekly | |
| Add HGV to Watchlist: View: Get Complete HGV Trend Analysis ➞ | |
 | BKR Baker Hughes Company |
| Sector: Services & Goods | |
| SubSector: Technical Services | |
| MarketCap: 1330 Millions | |
| Recent Price: 31.93 Smart Investing & Trading Score: 36 | |
| Day Percent Change: 0.14% Day Change: 0.04 | |
| Week Change: -2.76% Year-to-date Change: -6.6% | |
| BKR Links: Profile News Message Board | |
| Charts:- Daily , Weekly | |
| Add BKR to Watchlist: View: Get Complete BKR Trend Analysis ➞ | |
 | HSAI Hesai Group |
| Sector: Services & Goods | |
| SubSector: Auto Parts | |
| MarketCap: 1330 Millions | |
| Recent Price: 4.90 Smart Investing & Trading Score: 100 | |
| Day Percent Change: 4.93% Day Change: 0.23 | |
| Week Change: 11.36% Year-to-date Change: -46.0% | |
| HSAI Links: Profile News Message Board | |
| Charts:- Daily , Weekly | |
| Add HSAI to Watchlist: View: Get Complete HSAI Trend Analysis ➞ | |
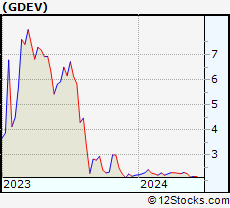 | GDEV GDEV Inc. |
| Sector: Services & Goods | |
| SubSector: Electronic Gaming & Multimedia | |
| MarketCap: 1300 Millions | |
| Recent Price: 2.17 Smart Investing & Trading Score: 27 | |
| Day Percent Change: 0.46% Day Change: 0.01 | |
| Week Change: 2.36% Year-to-date Change: -1.4% | |
| GDEV Links: Profile News Message Board | |
| Charts:- Daily , Weekly | |
| Add GDEV to Watchlist: View: Get Complete GDEV Trend Analysis ➞ | |
 | EYE National Vision Holdings, Inc. |
| Sector: Services & Goods | |
| SubSector: Specialty Retail, Other | |
| MarketCap: 1290.84 Millions | |
| Recent Price: 17.56 Smart Investing & Trading Score: 25 | |
| Day Percent Change: -0.79% Day Change: -0.14 | |
| Week Change: -1.79% Year-to-date Change: -16.1% | |
| EYE Links: Profile News Message Board | |
| Charts:- Daily , Weekly | |
| Add EYE to Watchlist: View: Get Complete EYE Trend Analysis ➞ | |
 | PRAA PRA Group, Inc. |
| Sector: Services & Goods | |
| SubSector: Business Services | |
| MarketCap: 1290.32 Millions | |
| Recent Price: 24.68 Smart Investing & Trading Score: 57 | |
| Day Percent Change: 1.67% Day Change: 0.40 | |
| Week Change: 2.38% Year-to-date Change: -5.8% | |
| PRAA Links: Profile News Message Board | |
| Charts:- Daily , Weekly | |
| Add PRAA to Watchlist: View: Get Complete PRAA Trend Analysis ➞ | |
 | SIX Six Flags Entertainment Corporation |
| Sector: Services & Goods | |
| SubSector: General Entertainment | |
| MarketCap: 1282.69 Millions | |
| Recent Price: 23.99 Smart Investing & Trading Score: 42 | |
| Day Percent Change: 1.95% Day Change: 0.46 | |
| Week Change: 1.1% Year-to-date Change: -4.4% | |
| SIX Links: Profile News Message Board | |
| Charts:- Daily , Weekly | |
| Add SIX to Watchlist: View: Get Complete SIX Trend Analysis ➞ | |
 | ATGE Adtalem Global Education Inc. |
| Sector: Services & Goods | |
| SubSector: Education & Training Services | |
| MarketCap: 1273.86 Millions | |
| Recent Price: 52.40 Smart Investing & Trading Score: 90 | |
| Day Percent Change: 3.72% Day Change: 1.88 | |
| Week Change: 5.48% Year-to-date Change: -11.1% | |
| ATGE Links: Profile News Message Board | |
| Charts:- Daily , Weekly | |
| Add ATGE to Watchlist: View: Get Complete ATGE Trend Analysis ➞ | |
 | VRRM Verra Mobility Corporation |
| Sector: Services & Goods | |
| SubSector: Security & Protection Services | |
| MarketCap: 1265.03 Millions | |
| Recent Price: 24.07 Smart Investing & Trading Score: 43 | |
| Day Percent Change: 1.58% Day Change: 0.38 | |
| Week Change: -0.64% Year-to-date Change: 4.5% | |
| VRRM Links: Profile News Message Board | |
| Charts:- Daily , Weekly | |
| Add VRRM to Watchlist: View: Get Complete VRRM Trend Analysis ➞ | |
 | SBH Sally Beauty Holdings, Inc. |
| Sector: Services & Goods | |
| SubSector: Specialty Retail, Other | |
| MarketCap: 1229.44 Millions | |
| Recent Price: 10.95 Smart Investing & Trading Score: 49 | |
| Day Percent Change: 3.50% Day Change: 0.37 | |
| Week Change: -0.45% Year-to-date Change: -17.6% | |
| SBH Links: Profile News Message Board | |
| Charts:- Daily , Weekly | |
| Add SBH to Watchlist: View: Get Complete SBH Trend Analysis ➞ | |
 | ICFI ICF International, Inc. |
| Sector: Services & Goods | |
| SubSector: Management Services | |
| MarketCap: 1218.75 Millions | |
| Recent Price: 146.29 Smart Investing & Trading Score: 37 | |
| Day Percent Change: 1.64% Day Change: 2.36 | |
| Week Change: 3.1% Year-to-date Change: 9.1% | |
| ICFI Links: Profile News Message Board | |
| Charts:- Daily , Weekly | |
| Add ICFI to Watchlist: View: Get Complete ICFI Trend Analysis ➞ | |
 | ABG Asbury Automotive Group, Inc. |
| Sector: Services & Goods | |
| SubSector: Auto Dealerships | |
| MarketCap: 1203.21 Millions | |
| Recent Price: 208.45 Smart Investing & Trading Score: 20 | |
| Day Percent Change: -1.04% Day Change: -2.19 | |
| Week Change: -6.09% Year-to-date Change: -7.3% | |
| ABG Links: Profile News Message Board | |
| Charts:- Daily , Weekly | |
| Add ABG to Watchlist: View: Get Complete ABG Trend Analysis ➞ | |
 | GHG GreenTree Hospitality Group Ltd. |
| Sector: Services & Goods | |
| SubSector: Lodging | |
| MarketCap: 1195.36 Millions | |
| Recent Price: 3.06 Smart Investing & Trading Score: 93 | |
| Day Percent Change: -4.38% Day Change: -0.14 | |
| Week Change: -1.29% Year-to-date Change: -18.6% | |
| GHG Links: Profile News Message Board | |
| Charts:- Daily , Weekly | |
| Add GHG to Watchlist: View: Get Complete GHG Trend Analysis ➞ | |
 | WW WW International, Inc. |
| Sector: Services & Goods | |
| SubSector: Personal Services | |
| MarketCap: 1186.25 Millions | |
| Recent Price: 1.89 Smart Investing & Trading Score: 25 | |
| Day Percent Change: 3.28% Day Change: 0.06 | |
| Week Change: 8% Year-to-date Change: -78.4% | |
| WW Links: Profile News Message Board | |
| Charts:- Daily , Weekly | |
| Add WW to Watchlist: View: Get Complete WW Trend Analysis ➞ | |
 | PENN Penn National Gaming, Inc. |
| Sector: Services & Goods | |
| SubSector: Resorts & Casinos | |
| MarketCap: 1183.84 Millions | |
| Recent Price: 14.99 Smart Investing & Trading Score: 0 | |
| Day Percent Change: -8.79% Day Change: -1.45 | |
| Week Change: -11.06% Year-to-date Change: -42.4% | |
| PENN Links: Profile News Message Board | |
| Charts:- Daily , Weekly | |
| Add PENN to Watchlist: View: Get Complete PENN Trend Analysis ➞ | |
 | RUSHA Rush Enterprises, Inc. |
| Sector: Services & Goods | |
| SubSector: Auto Dealerships | |
| MarketCap: 1183.21 Millions | |
| Recent Price: 43.34 Smart Investing & Trading Score: 10 | |
| Day Percent Change: 1.24% Day Change: 0.53 | |
| Week Change: -7.31% Year-to-date Change: -13.8% | |
| RUSHA Links: Profile News Message Board | |
| Charts:- Daily , Weekly | |
| Add RUSHA to Watchlist: View: Get Complete RUSHA Trend Analysis ➞ | |
 | NOVA Sunnova Energy International Inc. |
| Sector: Services & Goods | |
| SubSector: Management Services | |
| MarketCap: 1180.45 Millions | |
| Recent Price: 4.42 Smart Investing & Trading Score: 44 | |
| Day Percent Change: 25.21% Day Change: 0.89 | |
| Week Change: 10.5% Year-to-date Change: -71.0% | |
| NOVA Links: Profile News Message Board | |
| Charts:- Daily , Weekly | |
| Add NOVA to Watchlist: View: Get Complete NOVA Trend Analysis ➞ | |
 | DDS Dillard s, Inc. |
| Sector: Services & Goods | |
| SubSector: Department Stores | |
| MarketCap: 1170.82 Millions | |
| Recent Price: 431.30 Smart Investing & Trading Score: 48 | |
| Day Percent Change: 1.97% Day Change: 8.33 | |
| Week Change: -3.94% Year-to-date Change: 6.9% | |
| DDS Links: Profile News Message Board | |
| Charts:- Daily , Weekly | |
| Add DDS to Watchlist: View: Get Complete DDS Trend Analysis ➞ | |
 | KIND Nextdoor Holdings, Inc. |
| Sector: Services & Goods | |
| SubSector: Internet Content & Information | |
| MarketCap: 1170 Millions | |
| Recent Price: 2.16 Smart Investing & Trading Score: 64 | |
| Day Percent Change: 1.89% Day Change: 0.04 | |
| Week Change: 6.93% Year-to-date Change: 16.8% | |
| KIND Links: Profile News Message Board | |
| Charts:- Daily , Weekly | |
| Add KIND to Watchlist: View: Get Complete KIND Trend Analysis ➞ | |
| For tabular summary view of above stock list: Summary View ➞ 0 - 25 , 25 - 50 , 50 - 75 , 75 - 100 , 100 - 125 , 125 - 150 , 150 - 175 , 175 - 200 , 200 - 225 , 225 - 250 , 250 - 275 , 275 - 300 , 300 - 325 , 325 - 350 , 350 - 375 , 375 - 400 , 400 - 425 , 425 - 450 , 450 - 475 | ||
| Click To Change The Sort Order: By Market Cap or Company Size Performance: Year-to-date, Week and Day | |
| Select Chart Type: | ||
|
Best Stocks Today 12Stocks.com |
© 2024 12Stocks.com Terms & Conditions Privacy Contact Us
All Information Provided Only For Education And Not To Be Used For Investing or Trading. See Terms & Conditions


One More Thing ... Get Best Stocks Delivered Daily!
Never Ever Miss A Move With Our Top Ten Stocks Lists
Find Best Stocks In Any Market - Bull or Bear Market
Take A Peek At Our Top Ten Stocks Lists: Daily, Weekly, Year-to-Date & Top Trends
Find Best Stocks In Any Market - Bull or Bear Market
Take A Peek At Our Top Ten Stocks Lists: Daily, Weekly, Year-to-Date & Top Trends
Consumer Services Stocks With Best Up Trends [0-bearish to 100-bullish]: Perdoceo Education[100], Gannett Co[100], Sprouts Farmers[100], MINISO [100], Smart Share[100], Thomson Reuters[100], Gray Television[100], WESCO [100], Alibaba [100], Tetra Tech[100], Hesai [100]
Best Consumer Services Stocks Year-to-Date:
U Power[2974.78%], Vroom [1965.31%], Yatsen Holding[475.45%], Fluent [397.76%], Research[136.47%], Codere Online[132.88%], Carvana Co[120.06%], Sweetgreen [88.85%], RealReal [87.06%], Smart Share[68.74%], PaySign [65.36%] Best Consumer Services Stocks This Week:
Chicken Soup[156.52%], Smart Share[39.89%], Carvana Co[38.18%], Perdoceo Education[28.15%], Olaplex [24.63%], CareDx [22.75%], Polestar Automotive[21.61%], XPeng [19.9%], Gannett Co[18.6%], OneSpaWorld [16.2%], Li Auto[15.79%] Best Consumer Services Stocks Daily:
Carvana Co[33.77%], Perdoceo Education[31.79%], Gannett Co[26.97%], Sunnova Energy[25.21%], Chicken Soup[20.41%], Olaplex [19.29%], GameStop [16.96%], Wayfair [16.05%], XPeng [15.76%], Children s[14.58%], OneWater Marine[14.09%]