
 Login Sign Up


| |||||
 |  | ||||

| 12Stocks.com Market Intelligence |
Best Consumer Services Stocks
| In a hurry? Services & Goods Stocks: Performance Trends Table, Stock Charts
Sort Consumer Services: Daily, Weekly, Year-to-Date, Market Cap & Trends. Filter Services & Goods stocks list by size: All Large Mid-Range Small |
| 12Stocks.com Consumer Services Stocks Performances & Trends Daily | |||||||||
|
|  The overall Smart Investing & Trading Score is 90 (0-bearish to 100-bullish) which puts Consumer Services sector in short term bullish trend. The Smart Investing & Trading Score from previous trading session is 50 and hence an improvement of trend.
| ||||||||
Here are the Smart Investing & Trading Scores of the most requested Consumer Services stocks at 12Stocks.com (click stock name for detailed review):
|


| Consider signing up for our daily 12Stocks.com "Best Stocks Newsletter". You will never ever miss a big stock move again! |
| 12Stocks.com: Investing in Consumer Services sector with Stocks | |
|
The following table helps investors and traders sort through current performance and trends (as measured by Smart Investing & Trading Score) of various
stocks in the Consumer Services sector. Quick View: Move mouse or cursor over stock symbol (ticker) to view short-term Technical chart and over stock name to view long term chart. Click on  to add stock symbol to your watchlist and to add stock symbol to your watchlist and  to view watchlist. Click on any ticker or stock name for detailed market intelligence report for that stock. to view watchlist. Click on any ticker or stock name for detailed market intelligence report for that stock. |
12Stocks.com Performance of Stocks in Consumer Services Sector
| Ticker | Stock Name | Watchlist | Category | Recent Price | Smart Investing & Trading Score | Change % | Weekly Change% |
| M | Macy s |   | Department | 12.73 | 80 | 5.03% | 6.08% |
| DBI | Designer Brands | | Apparel | 3.02 | 70 | 4.60% | 5.96% |
| ICFI | ICF | | Services | 95.63 | 80 | 2.37% | 5.80% |
| HTHT | Huazhu | | Lodging | 32.24 | 10 | -37.77% | 5.77% |
| GPI | 1 | | Automobile | 444.21 | 80 | 3.90% | 5.76% |
| SBGI | Slair Broadcast | | Broadcasting | 14.97 | 90 | 1.30% | 5.57% |
| CMPR | Cimpress | | Services | 58.42 | 100 | 1.97% | 5.38% |
| NEWT | Newtek Business | | Services | 11.98 | 90 | 3.05% | 5.36% |
| MCW | Mister Car | | Services | 5.91 | 50 | 2.72% | 5.35% |
| LYV | Live Nation | | Entertainment | 158.43 | 100 | 0.88% | 5.33% |
| SSP | E.W. Scripps | | Broadcasting | 3.16 | 70 | 6.93% | 5.33% |
| HSII | Heidrick & Struggles | | Staffing | 48.04 | 80 | 32.48% | 5.21% |
| GPN | Global Payments | | Services | 82.39 | 40 | 1.09% | 5.08% |
| AN | AutoNation | | Automobile | 205.37 | 90 | 4.40% | 5.05% |
| COST | Costco Wholesale | | Retail | 991.25 | 70 | 58.10% | 5.05% |
| BBY | Best Buy | | Retail | 70.24 | 80 | 2.92% | 4.87% |
| ARW | Arrow Electronics | | Retail | 123.40 | 70 | 4.45% | 4.87% |
| SIG | Signet Jewelers | | Retail | 79.68 | 80 | 3.32% | 4.87% |
| GAMB | Gambling.com | | Gambling | 10.62 | 50 | 1.91% | 4.84% |
| SFIX | Stitch Fix | | Retail | 4.84 | 70 | 8.51% | 4.76% |
| SES | SES AI | | Auto Parts | 1.10 | 30 | 4.39% | 4.76% |
| IHG | InterContinental Hotels | | Lodging | 120.75 | 60 | 1.61% | 4.74% |
| DKS | DICK S | | Retail | 222.21 | 100 | 2.03% | 4.71% |
| CTRN | Citi Trends | | Apparel | 31.80 | 80 | 4.45% | 4.71% |
| DJCO | Daily Journal | | Publishing | 424.66 | 80 | 57.50% | 4.67% |
| For chart view version of above stock list: Chart View ➞ 0 - 25 , 25 - 50 , 50 - 75 , 75 - 100 , 100 - 125 , 125 - 150 , 150 - 175 , 175 - 200 , 200 - 225 , 225 - 250 , 250 - 275 , 275 - 300 , 300 - 325 , 325 - 350 , 350 - 375 | ||
 | Click To Change The Sort Order: By Market Cap or Company Size Performance: Year-to-date, Week and Day |  |
|
Get the most comprehensive stock market coverage daily at 12Stocks.com ➞ Best Stocks Today ➞ Best Stocks Weekly ➞ Best Stocks Year-to-Date ➞ Best Stocks Trends ➞  Best Stocks Today 12Stocks.com Best Nasdaq Stocks ➞ Best S&P 500 Stocks ➞ Best Tech Stocks ➞ Best Biotech Stocks ➞ |
| Detailed Overview of Consumer Services Stocks |
| Consumer Services Technical Overview, Leaders & Laggards, Top Consumer Services ETF Funds & Detailed Consumer Services Stocks List, Charts, Trends & More |
| Consumer Services Sector: Technical Analysis, Trends & YTD Performance | |
| Consumer Services sector is composed of stocks
from retail, entertainment, media/publishing, consumer goods
and services subsectors. Consumer Services sector, as represented by XLY, an exchange-traded fund [ETF] that holds basket of Consumer Services stocks (e.g, Walmart, Alibaba) is up by 1.56% and is currently underperforming the overall market by -8.24% year-to-date. Below is a quick view of Technical charts and trends: |
|
 XLY Weekly Chart |
|
| Long Term Trend: Very Good | |
| Medium Term Trend: Very Good | |
 XLY Daily Chart |
|
| Short Term Trend: Very Good | |
| Overall Trend Score: 90 | |
| YTD Performance: 1.56% | |
| **Trend Scores & Views Are Only For Educational Purposes And Not For Investing | |
| 12Stocks.com: Top Performing Consumer Services Sector Stocks | ||||||||||||||||||||||||||||||||||||||||||||||||
 The top performing Consumer Services sector stocks year to date are
Now, more recently, over last week, the top performing Consumer Services sector stocks on the move are


|
||||||||||||||||||||||||||||||||||||||||||||||||
| 12Stocks.com: Investing in Consumer Services Sector using Exchange Traded Funds | |
|
The following table shows list of key exchange traded funds (ETF) that
help investors track Consumer Services Index. For detailed view, check out our ETF Funds section of our website. Quick View: Move mouse or cursor over ETF symbol (ticker) to view short-term Technical chart and over ETF name to view long term chart. Click on ticker or stock name for detailed view. Click on to add stock symbol to your watchlist and to view watchlist. |
12Stocks.com List of ETFs that track Consumer Services Index
| Ticker | ETF Name | Watchlist | Recent Price | Smart Investing & Trading Score | Change % | Week % | Year-to-date % |
| XLY | Consumer Discret Sel | | 226.74 | 90 | 2.01 | 3.58 | 1.56% |
| RTH | Retail | | 245.88 | 90 | 0.63 | 2.04 | 9.67% |
| IYC | Consumer Services | | 101.87 | 90 | 1.68 | 2.71 | 6.29% |
| XRT | Retail | | 83.23 | 90 | 2.54 | 4.59 | 5.13% |
| IYK | Consumer Goods | | 70.15 | 40 | 0.37 | 1.9 | 8.01% |
| UCC | Consumer Services | | 48.63 | 90 | 2.96 | 7 | -5.38% |
| RETL | Retail Bull 3X | | 9.28 | 90 | 26.94 | 13.31 | -5.36% |
| SCC | Short Consumer Services | | 16.35 | 0 | -19.86 | -6.67 | -9.94% |
| UGE | Consumer Goods | | 19.12 | 50 | 1.05 | 5.18 | 6.94% |
| 12Stocks.com: Charts, Trends, Fundamental Data and Performances of Consumer Services Stocks | |
|
We now take in-depth look at all Consumer Services stocks including charts, multi-period performances and overall trends (as measured by Smart Investing & Trading Score). One can sort Consumer Services stocks (click link to choose) by Daily, Weekly and by Year-to-Date performances. Also, one can sort by size of the company or by market capitalization. |
| Select Your Default Chart Type: | |||||
| |||||
| Click on stock symbol or name for detailed view. Click on to add stock symbol to your watchlist and to view watchlist. Quick View: Move mouse or cursor over "Daily" to quickly view daily Technical stock chart and over "Weekly" to view weekly Technical stock chart. | |||||

 | M Macy s, Inc. |
| Sector: Services & Goods | |
| SubSector: Department Stores | |
| MarketCap: 2391.72 Millions | |
| Recent Price: 12.73 Smart Investing & Trading Score: 80 | |
| Day Percent Change: 5.03% Day Change: 0.77 | |
| Week Change: 6.08% Year-to-date Change: -22.6% | |
| M Links: Profile News Message Board | |
| Charts:- Daily , Weekly | |
| Add M to Watchlist: View: Get Complete M Trend Analysis ➞ | |
 | DBI Designer Brands Inc. |
| Sector: Services & Goods | |
| SubSector: Apparel Stores | |
| MarketCap: 467.308 Millions | |
| Recent Price: 3.02 Smart Investing & Trading Score: 70 | |
| Day Percent Change: 4.6% Day Change: 0.36 | |
| Week Change: 5.96% Year-to-date Change: -42.7% | |
| DBI Links: Profile News Message Board | |
| Charts:- Daily , Weekly | |
| Add DBI to Watchlist: View: Get Complete DBI Trend Analysis ➞ | |
 | ICFI ICF International, Inc. |
| Sector: Services & Goods | |
| SubSector: Management Services | |
| MarketCap: 1218.75 Millions | |
| Recent Price: 95.63 Smart Investing & Trading Score: 80 | |
| Day Percent Change: 2.37% Day Change: 3.77 | |
| Week Change: 5.8% Year-to-date Change: -19.5% | |
| ICFI Links: Profile News Message Board | |
| Charts:- Daily , Weekly | |
| Add ICFI to Watchlist: View: Get Complete ICFI Trend Analysis ➞ | |
 | HTHT Huazhu Group Limited |
| Sector: Services & Goods | |
| SubSector: Lodging | |
| MarketCap: 9164.46 Millions | |
| Recent Price: 32.24 Smart Investing & Trading Score: 10 | |
| Day Percent Change: -37.77% Day Change: -17.65 | |
| Week Change: 5.77% Year-to-date Change: 0.8% | |
| HTHT Links: Profile News Message Board | |
| Charts:- Daily , Weekly | |
| Add HTHT to Watchlist: View: Get Complete HTHT Trend Analysis ➞ | |
 | GPI Group 1 Automotive, Inc. |
| Sector: Services & Goods | |
| SubSector: Auto Dealerships | |
| MarketCap: 921.021 Millions | |
| Recent Price: 444.21 Smart Investing & Trading Score: 80 | |
| Day Percent Change: 3.9% Day Change: 13.85 | |
| Week Change: 5.76% Year-to-date Change: 5.6% | |
| GPI Links: Profile News Message Board | |
| Charts:- Daily , Weekly | |
| Add GPI to Watchlist: View: Get Complete GPI Trend Analysis ➞ | |
 | SBGI Sinclair Broadcast Group, Inc. |
| Sector: Services & Goods | |
| SubSector: Broadcasting - TV | |
| MarketCap: 1461.73 Millions | |
| Recent Price: 14.97 Smart Investing & Trading Score: 90 | |
| Day Percent Change: 1.3% Day Change: 0.18 | |
| Week Change: 5.57% Year-to-date Change: -4.0% | |
| SBGI Links: Profile News Message Board | |
| Charts:- Daily , Weekly | |
| Add SBGI to Watchlist: View: Get Complete SBGI Trend Analysis ➞ | |
 | CMPR Cimpress plc |
| Sector: Services & Goods | |
| SubSector: Business Services | |
| MarketCap: 1675.02 Millions | |
| Recent Price: 58.42 Smart Investing & Trading Score: 100 | |
| Day Percent Change: 1.97% Day Change: 1.78 | |
| Week Change: 5.38% Year-to-date Change: -18.5% | |
| CMPR Links: Profile News Message Board | |
| Charts:- Daily , Weekly | |
| Add CMPR to Watchlist: View: Get Complete CMPR Trend Analysis ➞ | |
 | NEWT Newtek Business Services Corp. |
| Sector: Services & Goods | |
| SubSector: Business Services | |
| MarketCap: 243.982 Millions | |
| Recent Price: 11.98 Smart Investing & Trading Score: 90 | |
| Day Percent Change: 3.05% Day Change: 0.38 | |
| Week Change: 5.36% Year-to-date Change: -2.9% | |
| NEWT Links: Profile News Message Board | |
| Charts:- Daily , Weekly | |
| Add NEWT to Watchlist: View: Get Complete NEWT Trend Analysis ➞ | |
 | MCW Mister Car Wash, Inc. |
| Sector: Services & Goods | |
| SubSector: Personal Services | |
| MarketCap: 2790 Millions | |
| Recent Price: 5.91 Smart Investing & Trading Score: 50 | |
| Day Percent Change: 2.72% Day Change: 0.18 | |
| Week Change: 5.35% Year-to-date Change: -18.9% | |
| MCW Links: Profile News Message Board | |
| Charts:- Daily , Weekly | |
| Add MCW to Watchlist: View: Get Complete MCW Trend Analysis ➞ | |
 | LYV Live Nation Entertainment, Inc. |
| Sector: Services & Goods | |
| SubSector: Entertainment - Diversified | |
| MarketCap: 8457.17 Millions | |
| Recent Price: 158.43 Smart Investing & Trading Score: 100 | |
| Day Percent Change: 0.88% Day Change: 0.84 | |
| Week Change: 5.33% Year-to-date Change: 22.3% | |
| LYV Links: Profile News Message Board | |
| Charts:- Daily , Weekly | |
| Add LYV to Watchlist: View: Get Complete LYV Trend Analysis ➞ | |
 | SSP The E.W. Scripps Company |
| Sector: Services & Goods | |
| SubSector: Broadcasting - TV | |
| MarketCap: 766.163 Millions | |
| Recent Price: 3.16 Smart Investing & Trading Score: 70 | |
| Day Percent Change: 6.93% Day Change: 0.14 | |
| Week Change: 5.33% Year-to-date Change: 43.0% | |
| SSP Links: Profile News Message Board | |
| Charts:- Daily , Weekly | |
| Add SSP to Watchlist: View: Get Complete SSP Trend Analysis ➞ | |
 | HSII Heidrick & Struggles International, Inc. |
| Sector: Services & Goods | |
| SubSector: Staffing & Outsourcing Services | |
| MarketCap: 431.428 Millions | |
| Recent Price: 48.04 Smart Investing & Trading Score: 80 | |
| Day Percent Change: 32.48% Day Change: 9.15 | |
| Week Change: 5.21% Year-to-date Change: 9.2% | |
| HSII Links: Profile News Message Board | |
| Charts:- Daily , Weekly | |
| Add HSII to Watchlist: View: Get Complete HSII Trend Analysis ➞ | |
 | GPN Global Payments Inc. |
| Sector: Services & Goods | |
| SubSector: Business Services | |
| MarketCap: 39068.8 Millions | |
| Recent Price: 82.39 Smart Investing & Trading Score: 40 | |
| Day Percent Change: 1.09% Day Change: 1.19 | |
| Week Change: 5.08% Year-to-date Change: -26.0% | |
| GPN Links: Profile News Message Board | |
| Charts:- Daily , Weekly | |
| Add GPN to Watchlist: View: Get Complete GPN Trend Analysis ➞ | |
 | AN AutoNation, Inc. |
| Sector: Services & Goods | |
| SubSector: Auto Dealerships | |
| MarketCap: 2732.61 Millions | |
| Recent Price: 205.37 Smart Investing & Trading Score: 90 | |
| Day Percent Change: 4.4% Day Change: 7.61 | |
| Week Change: 5.05% Year-to-date Change: 20.9% | |
| AN Links: Profile News Message Board | |
| Charts:- Daily , Weekly | |
| Add AN to Watchlist: View: Get Complete AN Trend Analysis ➞ | |
 | COST Costco Wholesale Corporation |
| Sector: Services & Goods | |
| SubSector: Discount, Variety Stores | |
| MarketCap: 136355 Millions | |
| Recent Price: 991.25 Smart Investing & Trading Score: 70 | |
| Day Percent Change: 58.1% Day Change: 323.09 | |
| Week Change: 5.05% Year-to-date Change: 8.6% | |
| COST Links: Profile News Message Board | |
| Charts:- Daily , Weekly | |
| Add COST to Watchlist: View: Get Complete COST Trend Analysis ➞ | |
 | BBY Best Buy Co., Inc. |
| Sector: Services & Goods | |
| SubSector: Electronics Stores | |
| MarketCap: 15771.3 Millions | |
| Recent Price: 70.24 Smart Investing & Trading Score: 80 | |
| Day Percent Change: 2.92% Day Change: 2.5 | |
| Week Change: 4.87% Year-to-date Change: -15.9% | |
| BBY Links: Profile News Message Board | |
| Charts:- Daily , Weekly | |
| Add BBY to Watchlist: View: Get Complete BBY Trend Analysis ➞ | |
 | ARW Arrow Electronics, Inc. |
| Sector: Services & Goods | |
| SubSector: Electronics Wholesale | |
| MarketCap: 4155.03 Millions | |
| Recent Price: 123.40 Smart Investing & Trading Score: 70 | |
| Day Percent Change: 4.45% Day Change: 5.67 | |
| Week Change: 4.87% Year-to-date Change: 9.1% | |
| ARW Links: Profile News Message Board | |
| Charts:- Daily , Weekly | |
| Add ARW to Watchlist: View: Get Complete ARW Trend Analysis ➞ | |
 | SIG Signet Jewelers Limited |
| Sector: Services & Goods | |
| SubSector: Jewelry Stores | |
| MarketCap: 518.1 Millions | |
| Recent Price: 79.68 Smart Investing & Trading Score: 80 | |
| Day Percent Change: 3.32% Day Change: 2.58 | |
| Week Change: 4.87% Year-to-date Change: 0.1% | |
| SIG Links: Profile News Message Board | |
| Charts:- Daily , Weekly | |
| Add SIG to Watchlist: View: Get Complete SIG Trend Analysis ➞ | |
 | GAMB Gambling.com Group Limited |
| Sector: Services & Goods | |
| SubSector: Gambling | |
| MarketCap: 376 Millions | |
| Recent Price: 10.62 Smart Investing & Trading Score: 50 | |
| Day Percent Change: 1.91% Day Change: 0.19 | |
| Week Change: 4.84% Year-to-date Change: -24.6% | |
| GAMB Links: Profile News Message Board | |
| Charts:- Daily , Weekly | |
| Add GAMB to Watchlist: View: Get Complete GAMB Trend Analysis ➞ | |
 | SFIX Stitch Fix, Inc. |
| Sector: Services & Goods | |
| SubSector: Specialty Retail, Other | |
| MarketCap: 1693.64 Millions | |
| Recent Price: 4.84 Smart Investing & Trading Score: 70 | |
| Day Percent Change: 8.51% Day Change: 0.31 | |
| Week Change: 4.76% Year-to-date Change: 12.3% | |
| SFIX Links: Profile News Message Board | |
| Charts:- Daily , Weekly | |
| Add SFIX to Watchlist: View: Get Complete SFIX Trend Analysis ➞ | |
 | SES SES AI Corporation |
| Sector: Services & Goods | |
| SubSector: Auto Parts | |
| MarketCap: 893 Millions | |
| Recent Price: 1.10 Smart Investing & Trading Score: 30 | |
| Day Percent Change: 4.39% Day Change: 0.05 | |
| Week Change: 4.76% Year-to-date Change: -49.8% | |
| SES Links: Profile News Message Board | |
| Charts:- Daily , Weekly | |
| Add SES to Watchlist: View: Get Complete SES Trend Analysis ➞ | |
 | IHG InterContinental Hotels Group PLC |
| Sector: Services & Goods | |
| SubSector: Lodging | |
| MarketCap: 6387.46 Millions | |
| Recent Price: 120.75 Smart Investing & Trading Score: 60 | |
| Day Percent Change: 1.61% Day Change: 1.58 | |
| Week Change: 4.74% Year-to-date Change: -2.3% | |
| IHG Links: Profile News Message Board | |
| Charts:- Daily , Weekly | |
| Add IHG to Watchlist: View: Get Complete IHG Trend Analysis ➞ | |
 | DKS DICK S Sporting Goods, Inc. |
| Sector: Services & Goods | |
| SubSector: Sporting Goods Stores | |
| MarketCap: 1672.04 Millions | |
| Recent Price: 222.21 Smart Investing & Trading Score: 100 | |
| Day Percent Change: 2.03% Day Change: 4.76 | |
| Week Change: 4.71% Year-to-date Change: -1.7% | |
| DKS Links: Profile News Message Board | |
| Charts:- Daily , Weekly | |
| Add DKS to Watchlist: View: Get Complete DKS Trend Analysis ➞ | |
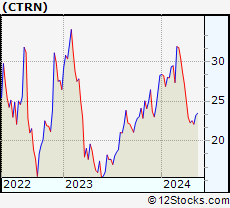 | CTRN Citi Trends, Inc. |
| Sector: Services & Goods | |
| SubSector: Apparel Stores | |
| MarketCap: 117.808 Millions | |
| Recent Price: 31.80 Smart Investing & Trading Score: 80 | |
| Day Percent Change: 4.45% Day Change: 0.68 | |
| Week Change: 4.71% Year-to-date Change: 21.1% | |
| CTRN Links: Profile News Message Board | |
| Charts:- Daily , Weekly | |
| Add CTRN to Watchlist: View: Get Complete CTRN Trend Analysis ➞ | |
 | DJCO Daily Journal Corporation |
| Sector: Services & Goods | |
| SubSector: Publishing - Newspapers | |
| MarketCap: 306.822 Millions | |
| Recent Price: 424.66 Smart Investing & Trading Score: 80 | |
| Day Percent Change: 57.5% Day Change: 178.35 | |
| Week Change: 4.67% Year-to-date Change: -25.2% | |
| DJCO Links: Profile News Message Board | |
| Charts:- Daily , Weekly | |
| Add DJCO to Watchlist: View: Get Complete DJCO Trend Analysis ➞ | |
| For tabular summary view of above stock list: Summary View ➞ 0 - 25 , 25 - 50 , 50 - 75 , 75 - 100 , 100 - 125 , 125 - 150 , 150 - 175 , 175 - 200 , 200 - 225 , 225 - 250 , 250 - 275 , 275 - 300 , 300 - 325 , 325 - 350 , 350 - 375 | ||
| Click To Change The Sort Order: By Market Cap or Company Size Performance: Year-to-date, Week and Day | |
| Select Chart Type: | ||
|
Best Stocks Today 12Stocks.com |
© 2025 12Stocks.com Terms & Conditions Privacy Contact Us
All Information Provided Only For Education And Not To Be Used For Investing or Trading. See Terms & Conditions


One More Thing ... Get Best Stocks Delivered Daily!
Never Ever Miss A Move With Our Top Ten Stocks Lists
Find Best Stocks In Any Market - Bull or Bear Market
Take A Peek At Our Top Ten Stocks Lists: Daily, Weekly, Year-to-Date & Top Trends
Find Best Stocks In Any Market - Bull or Bear Market
Take A Peek At Our Top Ten Stocks Lists: Daily, Weekly, Year-to-Date & Top Trends
Consumer Services Stocks With Best Up Trends [0-bearish to 100-bullish]: VSE [100], eBay [100], Kratos Defense[100], Graham [100], CompX [100], Fastenal [100], Jacobs Engineering[100], Willdan [100], Gray Television[100], Williams-Sonoma [100], Rush Enterprises[100]
Best Consumer Services Stocks Year-to-Date:
ThredUp [640.29%], Vivid Seats[278.19%], Willdan [211.45%], Kratos Defense[162.09%], Roblox [123.87%], National Vision[120.92%], Altisource Portfolio[99.84%], Noodles & [90.05%], Gray Television[89.96%], QuantumScape [80.15%], PaySign [80.13%] Best Consumer Services Stocks This Week:
Vivid Seats[1616.67%], Holley [66.18%], Money[64.55%], Myriad Genetics[55.81%], Grocery Outlet[42.09%], RealReal [33.98%], CompX [30.87%], Willdan [30.08%], comScore [29.36%], Arhaus [27.48%], Gray Television[26.37%] Best Consumer Services Stocks Daily:
CareDx [185.69%], Wingstop [150.46%], National CineMedia[112.46%], VSE [69.41%], Burlington Stores[66.03%], Myriad Genetics[64.88%], Costco Wholesale[58.1%], Daily Journal[57.5%], Texas Roadhouse[55.27%], Royal Caribbean[53.63%], CRA [53.26%]