
 Login Sign Up


| |||||
 |  | ||||

| 12Stocks.com Market Intelligence |
Best Consumer Services Stocks
| In a hurry? Services & Goods Stocks: Performance Trends Table, Stock Charts
Sort Consumer Services: Daily, Weekly, Year-to-Date, Market Cap & Trends. Filter Services & Goods stocks list by size: All Large Mid-Range Small |
| 12Stocks.com Consumer Services Stocks Performances & Trends Daily | |||||||||
|
|  The overall Smart Investing & Trading Score is 58 (0-bearish to 100-bullish) which puts Consumer Services sector in short term neutral trend. The Smart Investing & Trading Score from previous trading session is 23 and hence an improvement of trend.
| ||||||||
Here are the Smart Investing & Trading Scores of the most requested Consumer Services stocks at 12Stocks.com (click stock name for detailed review):
|


| Consider signing up for our daily 12Stocks.com "Best Stocks Newsletter". You will never ever miss a big stock move again! |
| 12Stocks.com: Investing in Consumer Services sector with Stocks | |
|
The following table helps investors and traders sort through current performance and trends (as measured by Smart Investing & Trading Score) of various
stocks in the Consumer Services sector. Quick View: Move mouse or cursor over stock symbol (ticker) to view short-term Technical chart and over stock name to view long term chart. Click on  to add stock symbol to your watchlist and to add stock symbol to your watchlist and  to view watchlist. Click on any ticker or stock name for detailed market intelligence report for that stock. to view watchlist. Click on any ticker or stock name for detailed market intelligence report for that stock. |
12Stocks.com Performance of Stocks in Consumer Services Sector
| Ticker | Stock Name | Watchlist | Category | Recent Price | Smart Investing & Trading Score | Change % | Weekly Change% |
| PSO | Pearson |   | Publishing | 12.64 | 70 | 0.96% | 2.76% |
| PZZA | Papa John | | Restaurants | 64.22 | 57 | 1.58% | 2.75% |
| ADT | ADT | | Security | 6.36 | 42 | 1.27% | 2.75% |
| VVI | Viad Corp | | Services | 35.67 | 63 | 1.16% | 2.74% |
| GDEN | Golden Entertainment | | Casinos | 34.90 | 59 | 0.66% | 2.74% |
| ACEL | Accel Entertainment | | Gaming | 11.68 | 60 | 1.04% | 2.73% |
| HSIC | Henry Schein | | Medical | 72.79 | 67 | 1.04% | 2.72% |
| ARW | Arrow Electronics | | Retail | 125.02 | 80 | 1.41% | 2.72% |
| RBLX | Roblox | | Electronic Gaming & Multimedia | 36.30 | 42 | 3.83% | 2.72% |
| IHS | IHS Holding | | Telecom Services | 3.41 | 54 | 1.79% | 2.71% |
| BATRK | Liberty Braves | | Broadcasting | 38.28 | 42 | 1.82% | 2.70% |
| BAH | Booz Allen | | Services | 145.96 | 73 | 2.06% | 2.69% |
| AN | AutoNation | | Automobile | 158.27 | 75 | 2.39% | 2.68% |
| BCO | Brink s | | Security | 89.37 | 88 | 1.41% | 2.68% |
| CPRT | Copart | | Automobile | 54.29 | 58 | 1.86% | 2.67% |
| EEFT | Euronet Worldwide | | Services | 105.78 | 75 | 1.82% | 2.66% |
| REZI | Resideo Technologies | | Security | 19.78 | 43 | 2.59% | 2.65% |
| M | Macy s | | Department | 19.02 | 76 | 1.44% | 2.64% |
| PLTK | Playtika Holding | | Electronic Gaming & Multimedia | 7.06 | 62 | 1.44% | 2.62% |
| MCS | Marcus | | Entertainment | 13.55 | 62 | 1.65% | 2.57% |
| QS | QuantumScape | | Auto Parts | 5.59 | 47 | 3.71% | 2.57% |
| WISH | ContextLogic | | Internet Retail | 5.99 | 95 | 2.22% | 2.57% |
| VSEC | VSE | | Services | 77.61 | 68 | 1.55% | 2.56% |
| CAVA | CAVA | | Restaurants | 61.19 | 53 | 2.65% | 2.55% |
| NWSA | News | | Broadcasting | 24.63 | 45 | 0.82% | 2.54% |
| For chart view version of above stock list: Chart View ➞ 0 - 25 , 25 - 50 , 50 - 75 , 75 - 100 , 100 - 125 , 125 - 150 , 150 - 175 , 175 - 200 , 200 - 225 , 225 - 250 , 250 - 275 , 275 - 300 , 300 - 325 , 325 - 350 , 350 - 375 , 375 - 400 , 400 - 425 , 425 - 450 , 450 - 475 | ||
 | Click To Change The Sort Order: By Market Cap or Company Size Performance: Year-to-date, Week and Day |  |
|
Get the most comprehensive stock market coverage daily at 12Stocks.com ➞ Best Stocks Today ➞ Best Stocks Weekly ➞ Best Stocks Year-to-Date ➞ Best Stocks Trends ➞  Best Stocks Today 12Stocks.com Best Nasdaq Stocks ➞ Best S&P 500 Stocks ➞ Best Tech Stocks ➞ Best Biotech Stocks ➞ |
| Detailed Overview of Consumer Services Stocks |
| Consumer Services Technical Overview, Leaders & Laggards, Top Consumer Services ETF Funds & Detailed Consumer Services Stocks List, Charts, Trends & More |
| Consumer Services Sector: Technical Analysis, Trends & YTD Performance | |
| Consumer Services sector is composed of stocks
from retail, entertainment, media/publishing, consumer goods
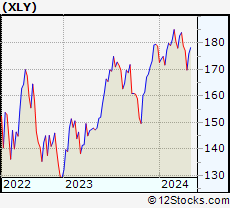
and services subsectors. Consumer Services sector, as represented by XLY, an exchange-traded fund [ETF] that holds basket of Consumer Services stocks (e.g, Walmart, Alibaba) is down by -3.51% and is currently underperforming the overall market by -9.15% year-to-date. Below is a quick view of Technical charts and trends: |
|
 XLY Weekly Chart |
|
| Long Term Trend: Good | |
| Medium Term Trend: Not Good | |
 XLY Daily Chart |
|
| Short Term Trend: Very Good | |
| Overall Trend Score: 58 | |
| YTD Performance: -3.51% | |
| **Trend Scores & Views Are Only For Educational Purposes And Not For Investing | |
| 12Stocks.com: Top Performing Consumer Services Sector Stocks | ||||||||||||||||||||||||||||||||||||||||||||||||
 The top performing Consumer Services sector stocks year to date are
Now, more recently, over last week, the top performing Consumer Services sector stocks on the move are


|
||||||||||||||||||||||||||||||||||||||||||||||||
| 12Stocks.com: Investing in Consumer Services Sector using Exchange Traded Funds | |
|
The following table shows list of key exchange traded funds (ETF) that
help investors track Consumer Services Index. For detailed view, check out our ETF Funds section of our website. Quick View: Move mouse or cursor over ETF symbol (ticker) to view short-term Technical chart and over ETF name to view long term chart. Click on ticker or stock name for detailed view. Click on to add stock symbol to your watchlist and to view watchlist. |
12Stocks.com List of ETFs that track Consumer Services Index
| Ticker | ETF Name | Watchlist | Recent Price | Smart Investing & Trading Score | Change % | Week % | Year-to-date % |
| XLY | Consumer Discret Sel | | 172.54 | 58 | 1.19 | 1.64 | -3.51% |
| RTH | Retail | | 200.42 | 58 | 0.12 | 0.9 | 6.48% |
| IYC | Consumer Services | | 77.76 | 51 | 1.49 | 1.96 | 2.63% |
| XRT | Retail | | 73.04 | 70 | 2.20 | 2.63 | 1% |
| IYK | Consumer Goods | | 66.61 | 100 | 0.29 | 1.22 | 4.24% |
| UCC | Consumer Services | | 32.68 | 32 | 1.64 | 3.49 | -8.99% |
| RETL | Retail Bull 3X | | 8.77 | 70 | 6.38 | 7.96 | -3.88% |
| RXI | Globl Consumer Discretionary | | 159.29 | 43 | 1.23 | 1.36 | 0.14% |
| SCC | Short Consumer Services | | 16.45 | 50 | -2.08 | -2.97 | 7.35% |
| UGE | Consumer Goods | | 17.03 | 80 | 0.29 | 2.42 | 8.19% |
| 12Stocks.com: Charts, Trends, Fundamental Data and Performances of Consumer Services Stocks | |
|
We now take in-depth look at all Consumer Services stocks including charts, multi-period performances and overall trends (as measured by Smart Investing & Trading Score). One can sort Consumer Services stocks (click link to choose) by Daily, Weekly and by Year-to-Date performances. Also, one can sort by size of the company or by market capitalization. |
| Select Your Default Chart Type: | |||||
| |||||
| Click on stock symbol or name for detailed view. Click on to add stock symbol to your watchlist and to view watchlist. Quick View: Move mouse or cursor over "Daily" to quickly view daily Technical stock chart and over "Weekly" to view weekly Technical stock chart. | |||||

 | PSO Pearson plc |
| Sector: Services & Goods | |
| SubSector: Publishing - Books | |
| MarketCap: 4595.42 Millions | |
| Recent Price: 12.64 Smart Investing & Trading Score: 70 | |
| Day Percent Change: 0.96% Day Change: 0.12 | |
| Week Change: 2.76% Year-to-date Change: 2.9% | |
| PSO Links: Profile News Message Board | |
| Charts:- Daily , Weekly | |
| Add PSO to Watchlist: View: Get Complete PSO Trend Analysis ➞ | |
 | PZZA Papa John s International, Inc. |
| Sector: Services & Goods | |
| SubSector: Specialty Eateries | |
| MarketCap: 1925.27 Millions | |
| Recent Price: 64.22 Smart Investing & Trading Score: 57 | |
| Day Percent Change: 1.58% Day Change: 1.00 | |
| Week Change: 2.75% Year-to-date Change: -15.8% | |
| PZZA Links: Profile News Message Board | |
| Charts:- Daily , Weekly | |
| Add PZZA to Watchlist: View: Get Complete PZZA Trend Analysis ➞ | |
 | ADT ADT Inc. |
| Sector: Services & Goods | |
| SubSector: Security & Protection Services | |
| MarketCap: 2892.03 Millions | |
| Recent Price: 6.36 Smart Investing & Trading Score: 42 | |
| Day Percent Change: 1.27% Day Change: 0.08 | |
| Week Change: 2.75% Year-to-date Change: -6.7% | |
| ADT Links: Profile News Message Board | |
| Charts:- Daily , Weekly | |
| Add ADT to Watchlist: View: Get Complete ADT Trend Analysis ➞ | |
 | VVI Viad Corp |
| Sector: Services & Goods | |
| SubSector: Business Services | |
| MarketCap: 270.682 Millions | |
| Recent Price: 35.67 Smart Investing & Trading Score: 63 | |
| Day Percent Change: 1.16% Day Change: 0.41 | |
| Week Change: 2.74% Year-to-date Change: -1.5% | |
| VVI Links: Profile News Message Board | |
| Charts:- Daily , Weekly | |
| Add VVI to Watchlist: View: Get Complete VVI Trend Analysis ➞ | |
 | GDEN Golden Entertainment, Inc. |
| Sector: Services & Goods | |
| SubSector: Resorts & Casinos | |
| MarketCap: 130.794 Millions | |
| Recent Price: 34.90 Smart Investing & Trading Score: 59 | |
| Day Percent Change: 0.66% Day Change: 0.23 | |
| Week Change: 2.74% Year-to-date Change: -12.6% | |
| GDEN Links: Profile News Message Board | |
| Charts:- Daily , Weekly | |
| Add GDEN to Watchlist: View: Get Complete GDEN Trend Analysis ➞ | |
 | ACEL Accel Entertainment, Inc. |
| Sector: Services & Goods | |
| SubSector: Gaming Activities | |
| MarketCap: 486.589 Millions | |
| Recent Price: 11.68 Smart Investing & Trading Score: 60 | |
| Day Percent Change: 1.04% Day Change: 0.12 | |
| Week Change: 2.73% Year-to-date Change: 13.7% | |
| ACEL Links: Profile News Message Board | |
| Charts:- Daily , Weekly | |
| Add ACEL to Watchlist: View: Get Complete ACEL Trend Analysis ➞ | |
 | HSIC Henry Schein, Inc. |
| Sector: Services & Goods | |
| SubSector: Medical Equipment Wholesale | |
| MarketCap: 6760.9 Millions | |
| Recent Price: 72.79 Smart Investing & Trading Score: 67 | |
| Day Percent Change: 1.04% Day Change: 0.75 | |
| Week Change: 2.72% Year-to-date Change: -3.9% | |
| HSIC Links: Profile News Message Board | |
| Charts:- Daily , Weekly | |
| Add HSIC to Watchlist: View: Get Complete HSIC Trend Analysis ➞ | |
 | ARW Arrow Electronics, Inc. |
| Sector: Services & Goods | |
| SubSector: Electronics Wholesale | |
| MarketCap: 4155.03 Millions | |
| Recent Price: 125.02 Smart Investing & Trading Score: 80 | |
| Day Percent Change: 1.41% Day Change: 1.74 | |
| Week Change: 2.72% Year-to-date Change: 2.3% | |
| ARW Links: Profile News Message Board | |
| Charts:- Daily , Weekly | |
| Add ARW to Watchlist: View: Get Complete ARW Trend Analysis ➞ | |
 | RBLX Roblox Corporation |
| Sector: Services & Goods | |
| SubSector: Electronic Gaming & Multimedia | |
| MarketCap: 25420 Millions | |
| Recent Price: 36.30 Smart Investing & Trading Score: 42 | |
| Day Percent Change: 3.83% Day Change: 1.34 | |
| Week Change: 2.72% Year-to-date Change: -21.3% | |
| RBLX Links: Profile News Message Board | |
| Charts:- Daily , Weekly | |
| Add RBLX to Watchlist: View: Get Complete RBLX Trend Analysis ➞ | |
 | IHS IHS Holding Limited |
| Sector: Services & Goods | |
| SubSector: Telecom Services | |
| MarketCap: 3310 Millions | |
| Recent Price: 3.41 Smart Investing & Trading Score: 54 | |
| Day Percent Change: 1.79% Day Change: 0.06 | |
| Week Change: 2.71% Year-to-date Change: -25.9% | |
| IHS Links: Profile News Message Board | |
| Charts:- Daily , Weekly | |
| Add IHS to Watchlist: View: Get Complete IHS Trend Analysis ➞ | |
 | BATRK The Liberty Braves Group |
| Sector: Services & Goods | |
| SubSector: Broadcasting - TV | |
| MarketCap: 638.363 Millions | |
| Recent Price: 38.28 Smart Investing & Trading Score: 42 | |
| Day Percent Change: 1.82% Day Change: 0.68 | |
| Week Change: 2.7% Year-to-date Change: -3.3% | |
| BATRK Links: Profile News Message Board | |
| Charts:- Daily , Weekly | |
| Add BATRK to Watchlist: View: Get Complete BATRK Trend Analysis ➞ | |
 | BAH Booz Allen Hamilton Holding Corporation |
| Sector: Services & Goods | |
| SubSector: Management Services | |
| MarketCap: 9037.35 Millions | |
| Recent Price: 145.96 Smart Investing & Trading Score: 73 | |
| Day Percent Change: 2.06% Day Change: 2.95 | |
| Week Change: 2.69% Year-to-date Change: 14.1% | |
| BAH Links: Profile News Message Board | |
| Charts:- Daily , Weekly | |
| Add BAH to Watchlist: View: Get Complete BAH Trend Analysis ➞ | |
 | AN AutoNation, Inc. |
| Sector: Services & Goods | |
| SubSector: Auto Dealerships | |
| MarketCap: 2732.61 Millions | |
| Recent Price: 158.27 Smart Investing & Trading Score: 75 | |
| Day Percent Change: 2.39% Day Change: 3.70 | |
| Week Change: 2.68% Year-to-date Change: 5.4% | |
| AN Links: Profile News Message Board | |
| Charts:- Daily , Weekly | |
| Add AN to Watchlist: View: Get Complete AN Trend Analysis ➞ | |
 | BCO The Brink s Company |
| Sector: Services & Goods | |
| SubSector: Security & Protection Services | |
| MarketCap: 2544.73 Millions | |
| Recent Price: 89.37 Smart Investing & Trading Score: 88 | |
| Day Percent Change: 1.41% Day Change: 1.24 | |
| Week Change: 2.68% Year-to-date Change: 1.6% | |
| BCO Links: Profile News Message Board | |
| Charts:- Daily , Weekly | |
| Add BCO to Watchlist: View: Get Complete BCO Trend Analysis ➞ | |
 | CPRT Copart, Inc. |
| Sector: Services & Goods | |
| SubSector: Auto Dealerships | |
| MarketCap: 15462.1 Millions | |
| Recent Price: 54.29 Smart Investing & Trading Score: 58 | |
| Day Percent Change: 1.86% Day Change: 0.99 | |
| Week Change: 2.67% Year-to-date Change: 10.8% | |
| CPRT Links: Profile News Message Board | |
| Charts:- Daily , Weekly | |
| Add CPRT to Watchlist: View: Get Complete CPRT Trend Analysis ➞ | |
 | EEFT Euronet Worldwide, Inc. |
| Sector: Services & Goods | |
| SubSector: Business Services | |
| MarketCap: 4809.62 Millions | |
| Recent Price: 105.78 Smart Investing & Trading Score: 75 | |
| Day Percent Change: 1.82% Day Change: 1.89 | |
| Week Change: 2.66% Year-to-date Change: 4.2% | |
| EEFT Links: Profile News Message Board | |
| Charts:- Daily , Weekly | |
| Add EEFT to Watchlist: View: Get Complete EEFT Trend Analysis ➞ | |
 | REZI Resideo Technologies, Inc. |
| Sector: Services & Goods | |
| SubSector: Security & Protection Services | |
| MarketCap: 712.603 Millions | |
| Recent Price: 19.78 Smart Investing & Trading Score: 43 | |
| Day Percent Change: 2.59% Day Change: 0.50 | |
| Week Change: 2.65% Year-to-date Change: 5.1% | |
| REZI Links: Profile News Message Board | |
| Charts:- Daily , Weekly | |
| Add REZI to Watchlist: View: Get Complete REZI Trend Analysis ➞ | |
 | M Macy s, Inc. |
| Sector: Services & Goods | |
| SubSector: Department Stores | |
| MarketCap: 2391.72 Millions | |
| Recent Price: 19.02 Smart Investing & Trading Score: 76 | |
| Day Percent Change: 1.44% Day Change: 0.27 | |
| Week Change: 2.64% Year-to-date Change: -5.5% | |
| M Links: Profile News Message Board | |
| Charts:- Daily , Weekly | |
| Add M to Watchlist: View: Get Complete M Trend Analysis ➞ | |
 | PLTK Playtika Holding Corp. |
| Sector: Services & Goods | |
| SubSector: Electronic Gaming & Multimedia | |
| MarketCap: 4260 Millions | |
| Recent Price: 7.06 Smart Investing & Trading Score: 62 | |
| Day Percent Change: 1.44% Day Change: 0.10 | |
| Week Change: 2.62% Year-to-date Change: -18.1% | |
| PLTK Links: Profile News Message Board | |
| Charts:- Daily , Weekly | |
| Add PLTK to Watchlist: View: Get Complete PLTK Trend Analysis ➞ | |
 | MCS The Marcus Corporation |
| Sector: Services & Goods | |
| SubSector: Entertainment - Diversified | |
| MarketCap: 441.437 Millions | |
| Recent Price: 13.55 Smart Investing & Trading Score: 62 | |
| Day Percent Change: 1.65% Day Change: 0.22 | |
| Week Change: 2.57% Year-to-date Change: -7.1% | |
| MCS Links: Profile News Message Board | |
| Charts:- Daily , Weekly | |
| Add MCS to Watchlist: View: Get Complete MCS Trend Analysis ➞ | |
 | QS QuantumScape Corporation |
| Sector: Services & Goods | |
| SubSector: Auto Parts | |
| MarketCap: 13137 Millions | |
| Recent Price: 5.59 Smart Investing & Trading Score: 47 | |
| Day Percent Change: 3.71% Day Change: 0.20 | |
| Week Change: 2.57% Year-to-date Change: -19.6% | |
| QS Links: Profile News Message Board | |
| Charts:- Daily , Weekly | |
| Add QS to Watchlist: View: Get Complete QS Trend Analysis ➞ | |
 | WISH ContextLogic Inc. |
| Sector: Services & Goods | |
| SubSector: Internet Retail | |
| MarketCap: 165 Millions | |
| Recent Price: 5.99 Smart Investing & Trading Score: 95 | |
| Day Percent Change: 2.22% Day Change: 0.13 | |
| Week Change: 2.57% Year-to-date Change: 0.8% | |
| WISH Links: Profile News Message Board | |
| Charts:- Daily , Weekly | |
| Add WISH to Watchlist: View: Get Complete WISH Trend Analysis ➞ | |
 | VSEC VSE Corporation |
| Sector: Services & Goods | |
| SubSector: Technical Services | |
| MarketCap: 183.61 Millions | |
| Recent Price: 77.61 Smart Investing & Trading Score: 68 | |
| Day Percent Change: 1.55% Day Change: 1.18 | |
| Week Change: 2.56% Year-to-date Change: 20.1% | |
| VSEC Links: Profile News Message Board | |
| Charts:- Daily , Weekly | |
| Add VSEC to Watchlist: View: Get Complete VSEC Trend Analysis ➞ | |
 | CAVA CAVA Group, Inc. |
| Sector: Services & Goods | |
| SubSector: Restaurants | |
| MarketCap: 4510 Millions | |
| Recent Price: 61.19 Smart Investing & Trading Score: 53 | |
| Day Percent Change: 2.65% Day Change: 1.58 | |
| Week Change: 2.55% Year-to-date Change: 40.7% | |
| CAVA Links: Profile News Message Board | |
| Charts:- Daily , Weekly | |
| Add CAVA to Watchlist: View: Get Complete CAVA Trend Analysis ➞ | |
 | NWSA News Corporation |
| Sector: Services & Goods | |
| SubSector: Broadcasting - TV | |
| MarketCap: 5857.53 Millions | |
| Recent Price: 24.63 Smart Investing & Trading Score: 45 | |
| Day Percent Change: 0.82% Day Change: 0.20 | |
| Week Change: 2.54% Year-to-date Change: 0.3% | |
| NWSA Links: Profile News Message Board | |
| Charts:- Daily , Weekly | |
| Add NWSA to Watchlist: View: Get Complete NWSA Trend Analysis ➞ | |
| For tabular summary view of above stock list: Summary View ➞ 0 - 25 , 25 - 50 , 50 - 75 , 75 - 100 , 100 - 125 , 125 - 150 , 150 - 175 , 175 - 200 , 200 - 225 , 225 - 250 , 250 - 275 , 275 - 300 , 300 - 325 , 325 - 350 , 350 - 375 , 375 - 400 , 400 - 425 , 425 - 450 , 450 - 475 | ||
| Click To Change The Sort Order: By Market Cap or Company Size Performance: Year-to-date, Week and Day | |
| Select Chart Type: | ||
|
Best Stocks Today 12Stocks.com |
© 2024 12Stocks.com Terms & Conditions Privacy Contact Us
All Information Provided Only For Education And Not To Be Used For Investing or Trading. See Terms & Conditions


One More Thing ... Get Best Stocks Delivered Daily!
Never Ever Miss A Move With Our Top Ten Stocks Lists
Find Best Stocks In Any Market - Bull or Bear Market
Take A Peek At Our Top Ten Stocks Lists: Daily, Weekly, Year-to-Date & Top Trends
Find Best Stocks In Any Market - Bull or Bear Market
Take A Peek At Our Top Ten Stocks Lists: Daily, Weekly, Year-to-Date & Top Trends
Consumer Services Stocks With Best Up Trends [0-bearish to 100-bullish]: Hibbett Sports[100], Gannett Co[100], MYT Netherlands[100], Dillard s[100], Napco Security[100], Lands [100], MINISO [100], Brinker [100], Cheesecake Factory[100], Boot Barn[100], Yatsen Holding[100]
Best Consumer Services Stocks Year-to-Date:
U Power[2801.79%], Vroom [1850.94%], Yatsen Holding[437.18%], Fluent [289.55%], Codere Online[134.25%], Research[101.58%], Sweetgreen [96.9%], RealReal [71.14%], Bright Scholar[64.8%], Spotify Technology[61.41%], PaySign [58.93%] Best Consumer Services Stocks This Week:
Hibbett Sports[21.1%], Jumia Technologies[17.51%], Allbirds [15.68%], Noodles & [15.13%], DoubleDown Interactive[15.06%], Pinduoduo [12.84%], MYT Netherlands[12.01%], Zumiez [11.6%], China Online[11.28%], Ameresco [11.12%], iHeartMedia [11.05%] Best Consumer Services Stocks Daily:
Hibbett Sports[18.84%], SES AI[12.17%], Golden Heaven[11.75%], Spotify Technology[11.41%], Jumia Technologies[11.30%], Sweetgreen [9.50%], Designer Brands[9.49%], Ameresco [9.43%], China Online[8.76%], iHeartMedia [8.48%], DoubleDown Interactive[7.90%]