
 Login Sign Up


| |||||
 |  | ||||

| 12Stocks.com Market Intelligence |
Best Consumer Services Stocks
| In a hurry? Services & Goods Stocks: Performance Trends Table, Stock Charts
Sort Consumer Services: Daily, Weekly, Year-to-Date, Market Cap & Trends. Filter Services & Goods stocks list by size: All Large Mid-Range Small |
| 12Stocks.com Consumer Services Stocks Performances & Trends Daily | |||||||||
|
|  The overall Smart Investing & Trading Score is 58 (0-bearish to 100-bullish) which puts Consumer Services sector in short term neutral trend. The Smart Investing & Trading Score from previous trading session is 23 and an improvement of trend continues.
| ||||||||
Here are the Smart Investing & Trading Scores of the most requested Consumer Services stocks at 12Stocks.com (click stock name for detailed review):
|


| Consider signing up for our daily 12Stocks.com "Best Stocks Newsletter". You will never ever miss a big stock move again! |
| 12Stocks.com: Investing in Consumer Services sector with Stocks | |
|
The following table helps investors and traders sort through current performance and trends (as measured by Smart Investing & Trading Score) of various
stocks in the Consumer Services sector. Quick View: Move mouse or cursor over stock symbol (ticker) to view short-term Technical chart and over stock name to view long term chart. Click on  to add stock symbol to your watchlist and to add stock symbol to your watchlist and  to view watchlist. Click on any ticker or stock name for detailed market intelligence report for that stock. to view watchlist. Click on any ticker or stock name for detailed market intelligence report for that stock. |
12Stocks.com Performance of Stocks in Consumer Services Sector
| Ticker | Stock Name | Watchlist | Category | Recent Price | Smart Investing & Trading Score | Change % | Weekly Change% |
| MCK | McKesson |   | Pharmacy | 535.42 | 78 | 0.64% | 2.02% |
| CMG | Chipotle Mexican | | Restaurants | 2926.76 | 76 | 0.40% | 2.01% |
| BATRK | Liberty Braves | | Broadcasting | 38.03 | 42 | -0.68% | 2.01% |
| LAUR | Laureate Education | | Education | 14.32 | 48 | 0.49% | 1.99% |
| ONON | On Holding | | Footwear & Accessories | 32.21 | 71 | -1.07% | 1.99% |
| SPOT | Spotify Technology | | Broadcasting | 281.23 | 51 | -7.28% | 1.96% |
| PLTK | Playtika Holding | | Electronic Gaming & Multimedia | 7.01 | 69 | -0.64% | 1.96% |
| ODP | Office Depot | | Retail | 51.25 | 77 | -2.03% | 1.93% |
| FWONA | Formula One | | Broadcasting | 61.69 | 93 | -1.06% | 1.92% |
| MBC | MasterBrand | | Furnishings, Fixtures & Appliances | 16.95 | 58 | -2.42% | 1.92% |
| TW | Tradeweb Markets | | Services | 102.96 | 73 | 1.11% | 1.91% |
| ATGE | Adtalem Global | | Education | 47.21 | 34 | 0.36% | 1.90% |
| FLNT | Fluent | | Marketing | 2.69 | 68 | 3.07% | 1.89% |
| SHCO | Soho House | | Lodging | 5.40 | 27 | 1.31% | 1.89% |
| MLCO | Melco Resorts | | Casinos | 6.27 | 10 | 1.13% | 1.87% |
| GHC | Graham | | Education | 717.44 | 43 | -0.20% | 1.86% |
| MATW | Matthews | | Services | 26.92 | 49 | -1.32% | 1.85% |
| REYN | Reynolds Consumer | | Packaging | 28.71 | 100 | 0.28% | 1.84% |
| RHI | Robert Half | | Staffing | 71.50 | 42 | -0.04% | 1.81% |
| EXPO | Exponent | | Services | 80.60 | 67 | 0.30% | 1.81% |
| CRAI | CRA | | Services | 148.29 | 83 | -0.51% | 1.81% |
| JWN | Nordstrom | | Apparel | 19.26 | 83 | -2.33% | 1.80% |
| MGA | Magna | | Auto Parts | 49.21 | 32 | -1.13% | 1.80% |
| PLYA | Playa Hotels | | Casinos | 9.16 | 68 | -0.43% | 1.78% |
| CAVA | CAVA | | Restaurants | 60.73 | 68 | -0.76% | 1.77% |
| For chart view version of above stock list: Chart View ➞ 0 - 25 , 25 - 50 , 50 - 75 , 75 - 100 , 100 - 125 , 125 - 150 , 150 - 175 , 175 - 200 , 200 - 225 , 225 - 250 , 250 - 275 , 275 - 300 , 300 - 325 , 325 - 350 , 350 - 375 , 375 - 400 , 400 - 425 , 425 - 450 , 450 - 475 | ||
 | Click To Change The Sort Order: By Market Cap or Company Size Performance: Year-to-date, Week and Day |  |
|
Get the most comprehensive stock market coverage daily at 12Stocks.com ➞ Best Stocks Today ➞ Best Stocks Weekly ➞ Best Stocks Year-to-Date ➞ Best Stocks Trends ➞  Best Stocks Today 12Stocks.com Best Nasdaq Stocks ➞ Best S&P 500 Stocks ➞ Best Tech Stocks ➞ Best Biotech Stocks ➞ |
| Detailed Overview of Consumer Services Stocks |
| Consumer Services Technical Overview, Leaders & Laggards, Top Consumer Services ETF Funds & Detailed Consumer Services Stocks List, Charts, Trends & More |
| Consumer Services Sector: Technical Analysis, Trends & YTD Performance | |
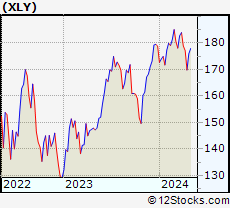
| Consumer Services sector is composed of stocks
from retail, entertainment, media/publishing, consumer goods
and services subsectors. Consumer Services sector, as represented by XLY, an exchange-traded fund [ETF] that holds basket of Consumer Services stocks (e.g, Walmart, Alibaba) is down by -2.58% and is currently underperforming the overall market by -8.24% year-to-date. Below is a quick view of Technical charts and trends: |
|
 XLY Weekly Chart |
|
| Long Term Trend: Good | |
| Medium Term Trend: Not Good | |
 XLY Daily Chart |
|
| Short Term Trend: Very Good | |
| Overall Trend Score: 58 | |
| YTD Performance: -2.58% | |
| **Trend Scores & Views Are Only For Educational Purposes And Not For Investing | |
| 12Stocks.com: Top Performing Consumer Services Sector Stocks | ||||||||||||||||||||||||||||||||||||||||||||||||
 The top performing Consumer Services sector stocks year to date are
Now, more recently, over last week, the top performing Consumer Services sector stocks on the move are


|
||||||||||||||||||||||||||||||||||||||||||||||||
| 12Stocks.com: Investing in Consumer Services Sector using Exchange Traded Funds | |
|
The following table shows list of key exchange traded funds (ETF) that
help investors track Consumer Services Index. For detailed view, check out our ETF Funds section of our website. Quick View: Move mouse or cursor over ETF symbol (ticker) to view short-term Technical chart and over ETF name to view long term chart. Click on ticker or stock name for detailed view. Click on to add stock symbol to your watchlist and to view watchlist. |
12Stocks.com List of ETFs that track Consumer Services Index
| Ticker | ETF Name | Watchlist | Recent Price | Smart Investing & Trading Score | Change % | Week % | Year-to-date % |
| XLY | Consumer Discret Sel | | 174.19 | 58 | 0.96 | 2.61 | -2.58% |
| RTH | Retail | | 199.79 | 44 | -0.35 | 0.58 | 6.14% |
| IYC | Consumer Services | | 77.83 | 43 | 0.31 | 2.05 | 2.72% |
| XRT | Retail | | 72.52 | 65 | -0.71 | 1.9 | 0.28% |
| IYK | Consumer Goods | | 67.20 | 75 | 0.99 | 2.11 | 5.16% |
| UCC | Consumer Services | | 33.37 | 73 | 2.12 | 5.68 | -7.07% |
| RETL | Retail Bull 3X | | 8.59 | 48 | -1.60 | 5.79 | -5.81% |
| RXI | Globl Consumer Discretionary | | 160.29 | 43 | 0.63 | 2 | 0.77% |
| SCC | Short Consumer Services | | 16.12 | 35 | -1.86 | -4.92 | 5.2% |
| UGE | Consumer Goods | | 17.24 | 90 | 1.23 | 3.68 | 9.52% |
| 12Stocks.com: Charts, Trends, Fundamental Data and Performances of Consumer Services Stocks | |
|
We now take in-depth look at all Consumer Services stocks including charts, multi-period performances and overall trends (as measured by Smart Investing & Trading Score). One can sort Consumer Services stocks (click link to choose) by Daily, Weekly and by Year-to-Date performances. Also, one can sort by size of the company or by market capitalization. |
| Select Your Default Chart Type: | |||||
| |||||
| Click on stock symbol or name for detailed view. Click on to add stock symbol to your watchlist and to view watchlist. Quick View: Move mouse or cursor over "Daily" to quickly view daily Technical stock chart and over "Weekly" to view weekly Technical stock chart. | |||||

 | MCK McKesson Corporation |
| Sector: Services & Goods | |
| SubSector: Drugs Wholesale | |
| MarketCap: 24096.7 Millions | |
| Recent Price: 535.42 Smart Investing & Trading Score: 78 | |
| Day Percent Change: 0.64% Day Change: 3.42 | |
| Week Change: 2.02% Year-to-date Change: 15.7% | |
| MCK Links: Profile News Message Board | |
| Charts:- Daily , Weekly | |
| Add MCK to Watchlist: View: Get Complete MCK Trend Analysis ➞ | |
 | CMG Chipotle Mexican Grill, Inc. |
| Sector: Services & Goods | |
| SubSector: Restaurants | |
| MarketCap: 16849.9 Millions | |
| Recent Price: 2926.76 Smart Investing & Trading Score: 76 | |
| Day Percent Change: 0.40% Day Change: 11.76 | |
| Week Change: 2.01% Year-to-date Change: 28.0% | |
| CMG Links: Profile News Message Board | |
| Charts:- Daily , Weekly | |
| Add CMG to Watchlist: View: Get Complete CMG Trend Analysis ➞ | |
 | BATRK The Liberty Braves Group |
| Sector: Services & Goods | |
| SubSector: Broadcasting - TV | |
| MarketCap: 638.363 Millions | |
| Recent Price: 38.03 Smart Investing & Trading Score: 42 | |
| Day Percent Change: -0.68% Day Change: -0.26 | |
| Week Change: 2.01% Year-to-date Change: -3.9% | |
| BATRK Links: Profile News Message Board | |
| Charts:- Daily , Weekly | |
| Add BATRK to Watchlist: View: Get Complete BATRK Trend Analysis ➞ | |
 | LAUR Laureate Education, Inc. |
| Sector: Services & Goods | |
| SubSector: Education & Training Services | |
| MarketCap: 2258.56 Millions | |
| Recent Price: 14.32 Smart Investing & Trading Score: 48 | |
| Day Percent Change: 0.49% Day Change: 0.07 | |
| Week Change: 1.99% Year-to-date Change: 4.5% | |
| LAUR Links: Profile News Message Board | |
| Charts:- Daily , Weekly | |
| Add LAUR to Watchlist: View: Get Complete LAUR Trend Analysis ➞ | |
 | ONON On Holding AG |
| Sector: Services & Goods | |
| SubSector: Footwear & Accessories | |
| MarketCap: 10600 Millions | |
| Recent Price: 32.21 Smart Investing & Trading Score: 71 | |
| Day Percent Change: -1.07% Day Change: -0.35 | |
| Week Change: 1.99% Year-to-date Change: 18.1% | |
| ONON Links: Profile News Message Board | |
| Charts:- Daily , Weekly | |
| Add ONON to Watchlist: View: Get Complete ONON Trend Analysis ➞ | |
 | SPOT Spotify Technology S.A. |
| Sector: Services & Goods | |
| SubSector: Broadcasting - Radio | |
| MarketCap: 24379.5 Millions | |
| Recent Price: 281.23 Smart Investing & Trading Score: 51 | |
| Day Percent Change: -7.28% Day Change: -22.08 | |
| Week Change: 1.96% Year-to-date Change: 49.7% | |
| SPOT Links: Profile News Message Board | |
| Charts:- Daily , Weekly | |
| Add SPOT to Watchlist: View: Get Complete SPOT Trend Analysis ➞ | |
 | PLTK Playtika Holding Corp. |
| Sector: Services & Goods | |
| SubSector: Electronic Gaming & Multimedia | |
| MarketCap: 4260 Millions | |
| Recent Price: 7.01 Smart Investing & Trading Score: 69 | |
| Day Percent Change: -0.64% Day Change: -0.04 | |
| Week Change: 1.96% Year-to-date Change: -18.7% | |
| PLTK Links: Profile News Message Board | |
| Charts:- Daily , Weekly | |
| Add PLTK to Watchlist: View: Get Complete PLTK Trend Analysis ➞ | |
 | ODP Office Depot, Inc. |
| Sector: Services & Goods | |
| SubSector: Specialty Retail, Other | |
| MarketCap: 1024.44 Millions | |
| Recent Price: 51.25 Smart Investing & Trading Score: 77 | |
| Day Percent Change: -2.03% Day Change: -1.06 | |
| Week Change: 1.93% Year-to-date Change: -9.0% | |
| ODP Links: Profile News Message Board | |
| Charts:- Daily , Weekly | |
| Add ODP to Watchlist: View: Get Complete ODP Trend Analysis ➞ | |
 | FWONA Formula One Group |
| Sector: Services & Goods | |
| SubSector: Broadcasting - TV | |
| MarketCap: 17485.6 Millions | |
| Recent Price: 61.69 Smart Investing & Trading Score: 93 | |
| Day Percent Change: -1.06% Day Change: -0.66 | |
| Week Change: 1.92% Year-to-date Change: 6.4% | |
| FWONA Links: Profile News Message Board | |
| Charts:- Daily , Weekly | |
| Add FWONA to Watchlist: View: Get Complete FWONA Trend Analysis ➞ | |
 | MBC MasterBrand, Inc. |
| Sector: Services & Goods | |
| SubSector: Furnishings, Fixtures & Appliances | |
| MarketCap: 1480 Millions | |
| Recent Price: 16.95 Smart Investing & Trading Score: 58 | |
| Day Percent Change: -2.42% Day Change: -0.42 | |
| Week Change: 1.92% Year-to-date Change: 13.6% | |
| MBC Links: Profile News Message Board | |
| Charts:- Daily , Weekly | |
| Add MBC to Watchlist: View: Get Complete MBC Trend Analysis ➞ | |
 | TW Tradeweb Markets Inc. |
| Sector: Services & Goods | |
| SubSector: Management Services | |
| MarketCap: 9913.35 Millions | |
| Recent Price: 102.96 Smart Investing & Trading Score: 73 | |
| Day Percent Change: 1.11% Day Change: 1.13 | |
| Week Change: 1.91% Year-to-date Change: 13.3% | |
| TW Links: Profile News Message Board | |
| Charts:- Daily , Weekly | |
| Add TW to Watchlist: View: Get Complete TW Trend Analysis ➞ | |
 | ATGE Adtalem Global Education Inc. |
| Sector: Services & Goods | |
| SubSector: Education & Training Services | |
| MarketCap: 1273.86 Millions | |
| Recent Price: 47.21 Smart Investing & Trading Score: 34 | |
| Day Percent Change: 0.36% Day Change: 0.17 | |
| Week Change: 1.9% Year-to-date Change: -19.9% | |
| ATGE Links: Profile News Message Board | |
| Charts:- Daily , Weekly | |
| Add ATGE to Watchlist: View: Get Complete ATGE Trend Analysis ➞ | |
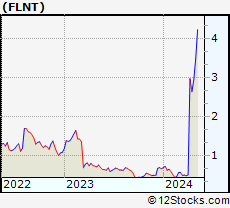 | FLNT Fluent, Inc. |
| Sector: Services & Goods | |
| SubSector: Marketing Services | |
| MarketCap: 110.015 Millions | |
| Recent Price: 2.69 Smart Investing & Trading Score: 68 | |
| Day Percent Change: 3.07% Day Change: 0.08 | |
| Week Change: 1.89% Year-to-date Change: 301.5% | |
| FLNT Links: Profile News Message Board | |
| Charts:- Daily , Weekly | |
| Add FLNT to Watchlist: View: Get Complete FLNT Trend Analysis ➞ | |
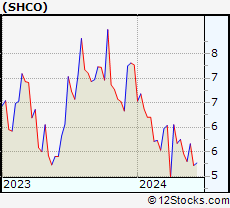 | SHCO Soho House & Co Inc. |
| Sector: Services & Goods | |
| SubSector: Lodging | |
| MarketCap: 1140 Millions | |
| Recent Price: 5.40 Smart Investing & Trading Score: 27 | |
| Day Percent Change: 1.31% Day Change: 0.07 | |
| Week Change: 1.89% Year-to-date Change: -25.7% | |
| SHCO Links: Profile News Message Board | |
| Charts:- Daily , Weekly | |
| Add SHCO to Watchlist: View: Get Complete SHCO Trend Analysis ➞ | |
 | MLCO Melco Resorts & Entertainment Limited |
| Sector: Services & Goods | |
| SubSector: Resorts & Casinos | |
| MarketCap: 7031.14 Millions | |
| Recent Price: 6.27 Smart Investing & Trading Score: 10 | |
| Day Percent Change: 1.13% Day Change: 0.07 | |
| Week Change: 1.87% Year-to-date Change: -29.3% | |
| MLCO Links: Profile News Message Board | |
| Charts:- Daily , Weekly | |
| Add MLCO to Watchlist: View: Get Complete MLCO Trend Analysis ➞ | |
 | GHC Graham Holdings Company |
| Sector: Services & Goods | |
| SubSector: Education & Training Services | |
| MarketCap: 1871.06 Millions | |
| Recent Price: 717.44 Smart Investing & Trading Score: 43 | |
| Day Percent Change: -0.20% Day Change: -1.46 | |
| Week Change: 1.86% Year-to-date Change: 3.0% | |
| GHC Links: Profile News Message Board | |
| Charts:- Daily , Weekly | |
| Add GHC to Watchlist: View: Get Complete GHC Trend Analysis ➞ | |
 | MATW Matthews International Corporation |
| Sector: Services & Goods | |
| SubSector: Personal Services | |
| MarketCap: 803.325 Millions | |
| Recent Price: 26.92 Smart Investing & Trading Score: 49 | |
| Day Percent Change: -1.32% Day Change: -0.36 | |
| Week Change: 1.85% Year-to-date Change: -26.6% | |
| MATW Links: Profile News Message Board | |
| Charts:- Daily , Weekly | |
| Add MATW to Watchlist: View: Get Complete MATW Trend Analysis ➞ | |
 | REYN Reynolds Consumer Products Inc. |
| Sector: Services & Goods | |
| SubSector: Packaging & Containers | |
| MarketCap: 62927 Millions | |
| Recent Price: 28.71 Smart Investing & Trading Score: 100 | |
| Day Percent Change: 0.28% Day Change: 0.08 | |
| Week Change: 1.84% Year-to-date Change: 7.0% | |
| REYN Links: Profile News Message Board | |
| Charts:- Daily , Weekly | |
| Add REYN to Watchlist: View: Get Complete REYN Trend Analysis ➞ | |
 | RHI Robert Half International Inc. |
| Sector: Services & Goods | |
| SubSector: Staffing & Outsourcing Services | |
| MarketCap: 4302 Millions | |
| Recent Price: 71.50 Smart Investing & Trading Score: 42 | |
| Day Percent Change: -0.04% Day Change: -0.03 | |
| Week Change: 1.81% Year-to-date Change: -18.7% | |
| RHI Links: Profile News Message Board | |
| Charts:- Daily , Weekly | |
| Add RHI to Watchlist: View: Get Complete RHI Trend Analysis ➞ | |
 | EXPO Exponent, Inc. |
| Sector: Services & Goods | |
| SubSector: Management Services | |
| MarketCap: 3605.95 Millions | |
| Recent Price: 80.60 Smart Investing & Trading Score: 67 | |
| Day Percent Change: 0.30% Day Change: 0.24 | |
| Week Change: 1.81% Year-to-date Change: -8.5% | |
| EXPO Links: Profile News Message Board | |
| Charts:- Daily , Weekly | |
| Add EXPO to Watchlist: View: Get Complete EXPO Trend Analysis ➞ | |
 | CRAI CRA International, Inc. |
| Sector: Services & Goods | |
| SubSector: Management Services | |
| MarketCap: 209.645 Millions | |
| Recent Price: 148.29 Smart Investing & Trading Score: 83 | |
| Day Percent Change: -0.51% Day Change: -0.76 | |
| Week Change: 1.81% Year-to-date Change: 50.0% | |
| CRAI Links: Profile News Message Board | |
| Charts:- Daily , Weekly | |
| Add CRAI to Watchlist: View: Get Complete CRAI Trend Analysis ➞ | |
 | JWN Nordstrom, Inc. |
| Sector: Services & Goods | |
| SubSector: Apparel Stores | |
| MarketCap: 3351.68 Millions | |
| Recent Price: 19.26 Smart Investing & Trading Score: 83 | |
| Day Percent Change: -2.33% Day Change: -0.46 | |
| Week Change: 1.8% Year-to-date Change: 4.4% | |
| JWN Links: Profile News Message Board | |
| Charts:- Daily , Weekly | |
| Add JWN to Watchlist: View: Get Complete JWN Trend Analysis ➞ | |
 | MGA Magna International Inc. |
| Sector: Services & Goods | |
| SubSector: Auto Parts Wholesale | |
| MarketCap: 8967.3 Millions | |
| Recent Price: 49.21 Smart Investing & Trading Score: 32 | |
| Day Percent Change: -1.13% Day Change: -0.56 | |
| Week Change: 1.8% Year-to-date Change: -16.7% | |
| MGA Links: Profile News Message Board | |
| Charts:- Daily , Weekly | |
| Add MGA to Watchlist: View: Get Complete MGA Trend Analysis ➞ | |
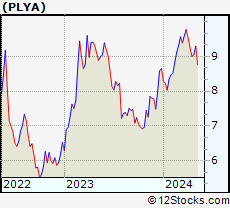 | PLYA Playa Hotels & Resorts N.V. |
| Sector: Services & Goods | |
| SubSector: Resorts & Casinos | |
| MarketCap: 360.194 Millions | |
| Recent Price: 9.16 Smart Investing & Trading Score: 68 | |
| Day Percent Change: -0.43% Day Change: -0.04 | |
| Week Change: 1.78% Year-to-date Change: 5.9% | |
| PLYA Links: Profile News Message Board | |
| Charts:- Daily , Weekly | |
| Add PLYA to Watchlist: View: Get Complete PLYA Trend Analysis ➞ | |
 | CAVA CAVA Group, Inc. |
| Sector: Services & Goods | |
| SubSector: Restaurants | |
| MarketCap: 4510 Millions | |
| Recent Price: 60.73 Smart Investing & Trading Score: 68 | |
| Day Percent Change: -0.76% Day Change: -0.46 | |
| Week Change: 1.77% Year-to-date Change: 39.7% | |
| CAVA Links: Profile News Message Board | |
| Charts:- Daily , Weekly | |
| Add CAVA to Watchlist: View: Get Complete CAVA Trend Analysis ➞ | |
| For tabular summary view of above stock list: Summary View ➞ 0 - 25 , 25 - 50 , 50 - 75 , 75 - 100 , 100 - 125 , 125 - 150 , 150 - 175 , 175 - 200 , 200 - 225 , 225 - 250 , 250 - 275 , 275 - 300 , 300 - 325 , 325 - 350 , 350 - 375 , 375 - 400 , 400 - 425 , 425 - 450 , 450 - 475 | ||
| Click To Change The Sort Order: By Market Cap or Company Size Performance: Year-to-date, Week and Day | |
| Select Chart Type: | ||
|
Best Stocks Today 12Stocks.com |
© 2024 12Stocks.com Terms & Conditions Privacy Contact Us
All Information Provided Only For Education And Not To Be Used For Investing or Trading. See Terms & Conditions


One More Thing ... Get Best Stocks Delivered Daily!
Never Ever Miss A Move With Our Top Ten Stocks Lists
Find Best Stocks In Any Market - Bull or Bear Market
Take A Peek At Our Top Ten Stocks Lists: Daily, Weekly, Year-to-Date & Top Trends
Find Best Stocks In Any Market - Bull or Bear Market
Take A Peek At Our Top Ten Stocks Lists: Daily, Weekly, Year-to-Date & Top Trends
Consumer Services Stocks With Best Up Trends [0-bearish to 100-bullish]: Yatsen Holding[100], 1[100], Alibaba [100], MINISO [100], Omnicom [100], Avnet [100], Napco Security[100], ASGN [100], IMAX [100], Yum! Brands[100], Dillard s[100]
Best Consumer Services Stocks Year-to-Date:
U Power[3013.84%], Vroom [1807.84%], Yatsen Holding[479.55%], Fluent [301.49%], Codere Online[134.25%], Research[107.01%], Sweetgreen [92.21%], RealReal [71.64%], PaySign [60.71%], DXP Enterprises[54.04%], Bright Scholar[52%] Best Consumer Services Stocks This Week:
Chicken Soup[282.5%], Hibbett Sports[21.61%], Golden Heaven[20.85%], Yatsen Holding[17.29%], Baozun [14.66%], Jumia Technologies[14.21%], Zumiez [13.38%], Ameresco [13.24%], 1[12.87%], Pinduoduo [12.39%], K12 [11.85%] Best Consumer Services Stocks Daily:
Chicken Soup[264.29%], Golden Heaven[11.81%], K12 [8.64%], Yatsen Holding[7.89%], GameStop [7.58%], Dada Nexus[7.53%], iClick Interactive[7.35%], U Power[7.31%], 1[7.23%], Watsco [6.54%], Allego N.V[6.31%]