
 Login Sign Up


| |||||
 |  | ||||

| 12Stocks.com Market Intelligence |
Best Consumer Services Stocks
| In a hurry? Services & Goods Stocks: Performance Trends Table, Stock Charts
Sort Consumer Services: Daily, Weekly, Year-to-Date, Market Cap & Trends. Filter Services & Goods stocks list by size: All Large Mid-Range Small |
| 12Stocks.com Consumer Services Stocks Performances & Trends Daily | |||||||||
|
|  The overall Smart Investing & Trading Score is 58 (0-bearish to 100-bullish) which puts Consumer Services sector in short term neutral trend. The Smart Investing & Trading Score from previous trading session is 23 and hence an improvement of trend.
| ||||||||
Here are the Smart Investing & Trading Scores of the most requested Consumer Services stocks at 12Stocks.com (click stock name for detailed review):
|


| Consider signing up for our daily 12Stocks.com "Best Stocks Newsletter". You will never ever miss a big stock move again! |
| 12Stocks.com: Investing in Consumer Services sector with Stocks | |
|
The following table helps investors and traders sort through current performance and trends (as measured by Smart Investing & Trading Score) of various
stocks in the Consumer Services sector. Quick View: Move mouse or cursor over stock symbol (ticker) to view short-term Technical chart and over stock name to view long term chart. Click on  to add stock symbol to your watchlist and to add stock symbol to your watchlist and  to view watchlist. Click on any ticker or stock name for detailed market intelligence report for that stock. to view watchlist. Click on any ticker or stock name for detailed market intelligence report for that stock. |
12Stocks.com Performance of Stocks in Consumer Services Sector
| Ticker | Stock Name | Watchlist | Category | Recent Price | Smart Investing & Trading Score | Change % | Weekly Change% |
| PAYX | Paychex |   | Staffing | 121.62 | 73 | 0.32% | 1.76% |
| MG | Mistras | | Security | 9.24 | 63 | 1.32% | 1.76% |
| HRB | H&R Block | | Services | 47.65 | 90 | 0.78% | 1.73% |
| OMC | Omnicom | | Advertising | 94.22 | 95 | 0.48% | 1.73% |
| FND | Floor & Decor | | Retail | 109.97 | 51 | 1.35% | 1.73% |
| EBAY | eBay | | Retail | 51.25 | 68 | 0.61% | 1.71% |
| LOCO | El Pollo | | Restaurants | 8.46 | 32 | 2.42% | 1.68% |
| INSW | Seaways | | Services | 53.91 | 70 | 0.58% | 1.66% |
| LQDT | Liquidity Services | | Retail | 17.33 | 45 | -0.52% | 1.64% |
| SFIX | Stitch Fix | | Retail | 2.17 | 32 | 2.36% | 1.64% |
| VSCO | Victorias Secret | | Apparel Retail | 17.57 | 42 | 3.29% | 1.62% |
| DPZ | Domino s | | Restaurants | 481.16 | 61 | 2.10% | 1.61% |
| BJ | BJ s | | Retail | 74.92 | 68 | 1.22% | 1.60% |
| CMG | Chipotle Mexican | | Restaurants | 2915.00 | 68 | 1.07% | 1.60% |
| CARS | Cars.com | | Automobile | 16.70 | 49 | 0.85% | 1.58% |
| SES | SES AI | | Auto Parts | 1.29 | 17 | 12.17% | 1.57% |
| MAR | Marriott | | Lodging | 239.69 | 45 | 0.96% | 1.56% |
| AIT | Applied Industrial | | Equipment | 186.31 | 58 | 1.48% | 1.56% |
| REYN | Reynolds Consumer | | Packaging | 28.63 | 100 | 1.35% | 1.56% |
| CCRN | Cross Country | | Staffing | 17.77 | 67 | 4.41% | 1.54% |
| WEX | WEX | | Services | 234.02 | 68 | 1.47% | 1.54% |
| IGT | Game | | Gaming | 20.51 | 49 | 0.39% | 1.53% |
| BJRI | BJ s | | Restaurants | 32.59 | 37 | 2.58% | 1.53% |
| ATGE | Adtalem Global | | Education | 47.04 | 49 | 0.43% | 1.53% |
| LAUR | Laureate Education | | Education | 14.25 | 63 | 0.42% | 1.50% |
| For chart view version of above stock list: Chart View ➞ 0 - 25 , 25 - 50 , 50 - 75 , 75 - 100 , 100 - 125 , 125 - 150 , 150 - 175 , 175 - 200 , 200 - 225 , 225 - 250 , 250 - 275 , 275 - 300 , 300 - 325 , 325 - 350 , 350 - 375 , 375 - 400 , 400 - 425 , 425 - 450 , 450 - 475 | ||
 | Click To Change The Sort Order: By Market Cap or Company Size Performance: Year-to-date, Week and Day |  |
|
Get the most comprehensive stock market coverage daily at 12Stocks.com ➞ Best Stocks Today ➞ Best Stocks Weekly ➞ Best Stocks Year-to-Date ➞ Best Stocks Trends ➞  Best Stocks Today 12Stocks.com Best Nasdaq Stocks ➞ Best S&P 500 Stocks ➞ Best Tech Stocks ➞ Best Biotech Stocks ➞ |
| Detailed Overview of Consumer Services Stocks |
| Consumer Services Technical Overview, Leaders & Laggards, Top Consumer Services ETF Funds & Detailed Consumer Services Stocks List, Charts, Trends & More |
| Consumer Services Sector: Technical Analysis, Trends & YTD Performance | |
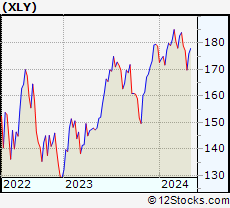
| Consumer Services sector is composed of stocks
from retail, entertainment, media/publishing, consumer goods
and services subsectors. Consumer Services sector, as represented by XLY, an exchange-traded fund [ETF] that holds basket of Consumer Services stocks (e.g, Walmart, Alibaba) is down by -3.51% and is currently underperforming the overall market by -9.15% year-to-date. Below is a quick view of Technical charts and trends: |
|
 XLY Weekly Chart |
|
| Long Term Trend: Good | |
| Medium Term Trend: Not Good | |
 XLY Daily Chart |
|
| Short Term Trend: Very Good | |
| Overall Trend Score: 58 | |
| YTD Performance: -3.51% | |
| **Trend Scores & Views Are Only For Educational Purposes And Not For Investing | |
| 12Stocks.com: Top Performing Consumer Services Sector Stocks | ||||||||||||||||||||||||||||||||||||||||||||||||
 The top performing Consumer Services sector stocks year to date are
Now, more recently, over last week, the top performing Consumer Services sector stocks on the move are


|
||||||||||||||||||||||||||||||||||||||||||||||||
| 12Stocks.com: Investing in Consumer Services Sector using Exchange Traded Funds | |
|
The following table shows list of key exchange traded funds (ETF) that
help investors track Consumer Services Index. For detailed view, check out our ETF Funds section of our website. Quick View: Move mouse or cursor over ETF symbol (ticker) to view short-term Technical chart and over ETF name to view long term chart. Click on ticker or stock name for detailed view. Click on to add stock symbol to your watchlist and to view watchlist. |
12Stocks.com List of ETFs that track Consumer Services Index
| Ticker | ETF Name | Watchlist | Recent Price | Smart Investing & Trading Score | Change % | Week % | Year-to-date % |
| XLY | Consumer Discret Sel | | 172.54 | 58 | 1.19 | 1.64 | -3.51% |
| RTH | Retail | | 200.49 | 58 | 0.15 | 0.94 | 6.51% |
| IYC | Consumer Services | | 77.59 | 51 | 1.27 | 1.73 | 2.4% |
| XRT | Retail | | 73.04 | 70 | 2.20 | 2.63 | 1% |
| IYK | Consumer Goods | | 66.54 | 100 | 0.18 | 1.11 | 4.13% |
| UCC | Consumer Services | | 32.68 | 45 | 1.64 | 3.49 | -8.99% |
| RETL | Retail Bull 3X | | 8.73 | 70 | 5.95 | 7.51 | -4.28% |
| RXI | Globl Consumer Discretionary | | 159.29 | 58 | 1.23 | 1.36 | 0.14% |
| SCC | Short Consumer Services | | 16.43 | 42 | -2.23 | -3.12 | 7.19% |
| UGE | Consumer Goods | | 17.03 | 80 | 0.29 | 2.42 | 8.19% |
| 12Stocks.com: Charts, Trends, Fundamental Data and Performances of Consumer Services Stocks | |
|
We now take in-depth look at all Consumer Services stocks including charts, multi-period performances and overall trends (as measured by Smart Investing & Trading Score). One can sort Consumer Services stocks (click link to choose) by Daily, Weekly and by Year-to-Date performances. Also, one can sort by size of the company or by market capitalization. |
| Select Your Default Chart Type: | |||||
| |||||
| Click on stock symbol or name for detailed view. Click on to add stock symbol to your watchlist and to view watchlist. Quick View: Move mouse or cursor over "Daily" to quickly view daily Technical stock chart and over "Weekly" to view weekly Technical stock chart. | |||||

 | PAYX Paychex, Inc. |
| Sector: Services & Goods | |
| SubSector: Staffing & Outsourcing Services | |
| MarketCap: 20928.8 Millions | |
| Recent Price: 121.62 Smart Investing & Trading Score: 73 | |
| Day Percent Change: 0.32% Day Change: 0.39 | |
| Week Change: 1.76% Year-to-date Change: 2.1% | |
| PAYX Links: Profile News Message Board | |
| Charts:- Daily , Weekly | |
| Add PAYX to Watchlist: View: Get Complete PAYX Trend Analysis ➞ | |
 | MG Mistras Group, Inc. |
| Sector: Services & Goods | |
| SubSector: Security & Protection Services | |
| MarketCap: 136.903 Millions | |
| Recent Price: 9.24 Smart Investing & Trading Score: 63 | |
| Day Percent Change: 1.32% Day Change: 0.12 | |
| Week Change: 1.76% Year-to-date Change: 26.2% | |
| MG Links: Profile News Message Board | |
| Charts:- Daily , Weekly | |
| Add MG to Watchlist: View: Get Complete MG Trend Analysis ➞ | |
 | HRB H&R Block, Inc. |
| Sector: Services & Goods | |
| SubSector: Personal Services | |
| MarketCap: 3052.45 Millions | |
| Recent Price: 47.65 Smart Investing & Trading Score: 90 | |
| Day Percent Change: 0.78% Day Change: 0.37 | |
| Week Change: 1.73% Year-to-date Change: -1.5% | |
| HRB Links: Profile News Message Board | |
| Charts:- Daily , Weekly | |
| Add HRB to Watchlist: View: Get Complete HRB Trend Analysis ➞ | |
 | OMC Omnicom Group Inc. |
| Sector: Services & Goods | |
| SubSector: Advertising Agencies | |
| MarketCap: 11813.5 Millions | |
| Recent Price: 94.22 Smart Investing & Trading Score: 95 | |
| Day Percent Change: 0.48% Day Change: 0.45 | |
| Week Change: 1.73% Year-to-date Change: 8.9% | |
| OMC Links: Profile News Message Board | |
| Charts:- Daily , Weekly | |
| Add OMC to Watchlist: View: Get Complete OMC Trend Analysis ➞ | |
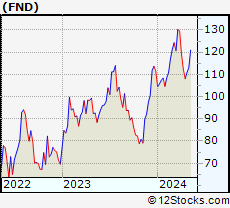 | FND Floor & Decor Holdings, Inc. |
| Sector: Services & Goods | |
| SubSector: Home Improvement Stores | |
| MarketCap: 3327.52 Millions | |
| Recent Price: 109.97 Smart Investing & Trading Score: 51 | |
| Day Percent Change: 1.35% Day Change: 1.46 | |
| Week Change: 1.73% Year-to-date Change: -1.4% | |
| FND Links: Profile News Message Board | |
| Charts:- Daily , Weekly | |
| Add FND to Watchlist: View: Get Complete FND Trend Analysis ➞ | |
 | EBAY eBay Inc. |
| Sector: Services & Goods | |
| SubSector: Specialty Retail, Other | |
| MarketCap: 23152.3 Millions | |
| Recent Price: 51.25 Smart Investing & Trading Score: 68 | |
| Day Percent Change: 0.61% Day Change: 0.31 | |
| Week Change: 1.71% Year-to-date Change: 17.5% | |
| EBAY Links: Profile News Message Board | |
| Charts:- Daily , Weekly | |
| Add EBAY to Watchlist: View: Get Complete EBAY Trend Analysis ➞ | |
 | LOCO El Pollo Loco Holdings, Inc. |
| Sector: Services & Goods | |
| SubSector: Restaurants | |
| MarketCap: 296.97 Millions | |
| Recent Price: 8.46 Smart Investing & Trading Score: 32 | |
| Day Percent Change: 2.42% Day Change: 0.20 | |
| Week Change: 1.68% Year-to-date Change: -4.1% | |
| LOCO Links: Profile News Message Board | |
| Charts:- Daily , Weekly | |
| Add LOCO to Watchlist: View: Get Complete LOCO Trend Analysis ➞ | |
 | INSW International Seaways, Inc. |
| Sector: Services & Goods | |
| SubSector: Business Services | |
| MarketCap: 521.582 Millions | |
| Recent Price: 53.91 Smart Investing & Trading Score: 70 | |
| Day Percent Change: 0.58% Day Change: 0.31 | |
| Week Change: 1.66% Year-to-date Change: 18.5% | |
| INSW Links: Profile News Message Board | |
| Charts:- Daily , Weekly | |
| Add INSW to Watchlist: View: Get Complete INSW Trend Analysis ➞ | |
 | LQDT Liquidity Services, Inc. |
| Sector: Services & Goods | |
| SubSector: Catalog & Mail Order Houses | |
| MarketCap: 144.492 Millions | |
| Recent Price: 17.33 Smart Investing & Trading Score: 45 | |
| Day Percent Change: -0.52% Day Change: -0.09 | |
| Week Change: 1.64% Year-to-date Change: 0.7% | |
| LQDT Links: Profile News Message Board | |
| Charts:- Daily , Weekly | |
| Add LQDT to Watchlist: View: Get Complete LQDT Trend Analysis ➞ | |
 | SFIX Stitch Fix, Inc. |
| Sector: Services & Goods | |
| SubSector: Specialty Retail, Other | |
| MarketCap: 1693.64 Millions | |
| Recent Price: 2.17 Smart Investing & Trading Score: 32 | |
| Day Percent Change: 2.36% Day Change: 0.05 | |
| Week Change: 1.64% Year-to-date Change: -39.2% | |
| SFIX Links: Profile News Message Board | |
| Charts:- Daily , Weekly | |
| Add SFIX to Watchlist: View: Get Complete SFIX Trend Analysis ➞ | |
 | VSCO Victorias Secret & Co. |
| Sector: Services & Goods | |
| SubSector: Apparel Retail | |
| MarketCap: 1340 Millions | |
| Recent Price: 17.57 Smart Investing & Trading Score: 42 | |
| Day Percent Change: 3.29% Day Change: 0.56 | |
| Week Change: 1.62% Year-to-date Change: -34.0% | |
| VSCO Links: Profile News Message Board | |
| Charts:- Daily , Weekly | |
| Add VSCO to Watchlist: View: Get Complete VSCO Trend Analysis ➞ | |
 | DPZ Domino s Pizza, Inc. |
| Sector: Services & Goods | |
| SubSector: Restaurants | |
| MarketCap: 12166 Millions | |
| Recent Price: 481.16 Smart Investing & Trading Score: 61 | |
| Day Percent Change: 2.10% Day Change: 9.88 | |
| Week Change: 1.61% Year-to-date Change: 16.7% | |
| DPZ Links: Profile News Message Board | |
| Charts:- Daily , Weekly | |
| Add DPZ to Watchlist: View: Get Complete DPZ Trend Analysis ➞ | |
 | BJ BJ s Wholesale Club Holdings, Inc. |
| Sector: Services & Goods | |
| SubSector: Discount, Variety Stores | |
| MarketCap: 3346.02 Millions | |
| Recent Price: 74.92 Smart Investing & Trading Score: 68 | |
| Day Percent Change: 1.22% Day Change: 0.90 | |
| Week Change: 1.6% Year-to-date Change: 12.4% | |
| BJ Links: Profile News Message Board | |
| Charts:- Daily , Weekly | |
| Add BJ to Watchlist: View: Get Complete BJ Trend Analysis ➞ | |
 | CMG Chipotle Mexican Grill, Inc. |
| Sector: Services & Goods | |
| SubSector: Restaurants | |
| MarketCap: 16849.9 Millions | |
| Recent Price: 2915.00 Smart Investing & Trading Score: 68 | |
| Day Percent Change: 1.07% Day Change: 30.75 | |
| Week Change: 1.6% Year-to-date Change: 27.5% | |
| CMG Links: Profile News Message Board | |
| Charts:- Daily , Weekly | |
| Add CMG to Watchlist: View: Get Complete CMG Trend Analysis ➞ | |
 | CARS Cars.com Inc. |
| Sector: Services & Goods | |
| SubSector: Auto Dealerships | |
| MarketCap: 290.321 Millions | |
| Recent Price: 16.70 Smart Investing & Trading Score: 49 | |
| Day Percent Change: 0.85% Day Change: 0.14 | |
| Week Change: 1.58% Year-to-date Change: -12.0% | |
| CARS Links: Profile News Message Board | |
| Charts:- Daily , Weekly | |
| Add CARS to Watchlist: View: Get Complete CARS Trend Analysis ➞ | |
 | SES SES AI Corporation |
| Sector: Services & Goods | |
| SubSector: Auto Parts | |
| MarketCap: 893 Millions | |
| Recent Price: 1.29 Smart Investing & Trading Score: 17 | |
| Day Percent Change: 12.17% Day Change: 0.14 | |
| Week Change: 1.57% Year-to-date Change: -27.9% | |
| SES Links: Profile News Message Board | |
| Charts:- Daily , Weekly | |
| Add SES to Watchlist: View: Get Complete SES Trend Analysis ➞ | |
 | MAR Marriott International, Inc. |
| Sector: Services & Goods | |
| SubSector: Lodging | |
| MarketCap: 25831.6 Millions | |
| Recent Price: 239.69 Smart Investing & Trading Score: 45 | |
| Day Percent Change: 0.96% Day Change: 2.28 | |
| Week Change: 1.56% Year-to-date Change: 6.3% | |
| MAR Links: Profile News Message Board | |
| Charts:- Daily , Weekly | |
| Add MAR to Watchlist: View: Get Complete MAR Trend Analysis ➞ | |
 | AIT Applied Industrial Technologies, Inc. |
| Sector: Services & Goods | |
| SubSector: Industrial Equipment Wholesale | |
| MarketCap: 1531.58 Millions | |
| Recent Price: 186.31 Smart Investing & Trading Score: 58 | |
| Day Percent Change: 1.48% Day Change: 2.71 | |
| Week Change: 1.56% Year-to-date Change: 7.9% | |
| AIT Links: Profile News Message Board | |
| Charts:- Daily , Weekly | |
| Add AIT to Watchlist: View: Get Complete AIT Trend Analysis ➞ | |
 | REYN Reynolds Consumer Products Inc. |
| Sector: Services & Goods | |
| SubSector: Packaging & Containers | |
| MarketCap: 62927 Millions | |
| Recent Price: 28.63 Smart Investing & Trading Score: 100 | |
| Day Percent Change: 1.35% Day Change: 0.38 | |
| Week Change: 1.56% Year-to-date Change: 6.7% | |
| REYN Links: Profile News Message Board | |
| Charts:- Daily , Weekly | |
| Add REYN to Watchlist: View: Get Complete REYN Trend Analysis ➞ | |
 | CCRN Cross Country Healthcare, Inc. |
| Sector: Services & Goods | |
| SubSector: Staffing & Outsourcing Services | |
| MarketCap: 348.328 Millions | |
| Recent Price: 17.77 Smart Investing & Trading Score: 67 | |
| Day Percent Change: 4.41% Day Change: 0.75 | |
| Week Change: 1.54% Year-to-date Change: -21.5% | |
| CCRN Links: Profile News Message Board | |
| Charts:- Daily , Weekly | |
| Add CCRN to Watchlist: View: Get Complete CCRN Trend Analysis ➞ | |
 | WEX WEX Inc. |
| Sector: Services & Goods | |
| SubSector: Business Services | |
| MarketCap: 4312.22 Millions | |
| Recent Price: 234.02 Smart Investing & Trading Score: 68 | |
| Day Percent Change: 1.47% Day Change: 3.38 | |
| Week Change: 1.54% Year-to-date Change: 20.3% | |
| WEX Links: Profile News Message Board | |
| Charts:- Daily , Weekly | |
| Add WEX to Watchlist: View: Get Complete WEX Trend Analysis ➞ | |
 | IGT International Game Technology PLC |
| Sector: Services & Goods | |
| SubSector: Gaming Activities | |
| MarketCap: 1030.89 Millions | |
| Recent Price: 20.51 Smart Investing & Trading Score: 49 | |
| Day Percent Change: 0.39% Day Change: 0.08 | |
| Week Change: 1.53% Year-to-date Change: -25.2% | |
| IGT Links: Profile News Message Board | |
| Charts:- Daily , Weekly | |
| Add IGT to Watchlist: View: Get Complete IGT Trend Analysis ➞ | |
 | BJRI BJ s Restaurants, Inc. |
| Sector: Services & Goods | |
| SubSector: Restaurants | |
| MarketCap: 183.67 Millions | |
| Recent Price: 32.59 Smart Investing & Trading Score: 37 | |
| Day Percent Change: 2.58% Day Change: 0.82 | |
| Week Change: 1.53% Year-to-date Change: -9.5% | |
| BJRI Links: Profile News Message Board | |
| Charts:- Daily , Weekly | |
| Add BJRI to Watchlist: View: Get Complete BJRI Trend Analysis ➞ | |
 | ATGE Adtalem Global Education Inc. |
| Sector: Services & Goods | |
| SubSector: Education & Training Services | |
| MarketCap: 1273.86 Millions | |
| Recent Price: 47.04 Smart Investing & Trading Score: 49 | |
| Day Percent Change: 0.43% Day Change: 0.20 | |
| Week Change: 1.53% Year-to-date Change: -20.2% | |
| ATGE Links: Profile News Message Board | |
| Charts:- Daily , Weekly | |
| Add ATGE to Watchlist: View: Get Complete ATGE Trend Analysis ➞ | |
 | LAUR Laureate Education, Inc. |
| Sector: Services & Goods | |
| SubSector: Education & Training Services | |
| MarketCap: 2258.56 Millions | |
| Recent Price: 14.25 Smart Investing & Trading Score: 63 | |
| Day Percent Change: 0.42% Day Change: 0.06 | |
| Week Change: 1.5% Year-to-date Change: 3.9% | |
| LAUR Links: Profile News Message Board | |
| Charts:- Daily , Weekly | |
| Add LAUR to Watchlist: View: Get Complete LAUR Trend Analysis ➞ | |
| For tabular summary view of above stock list: Summary View ➞ 0 - 25 , 25 - 50 , 50 - 75 , 75 - 100 , 100 - 125 , 125 - 150 , 150 - 175 , 175 - 200 , 200 - 225 , 225 - 250 , 250 - 275 , 275 - 300 , 300 - 325 , 325 - 350 , 350 - 375 , 375 - 400 , 400 - 425 , 425 - 450 , 450 - 475 | ||
| Click To Change The Sort Order: By Market Cap or Company Size Performance: Year-to-date, Week and Day | |
| Select Chart Type: | ||
|
Best Stocks Today 12Stocks.com |
© 2024 12Stocks.com Terms & Conditions Privacy Contact Us
All Information Provided Only For Education And Not To Be Used For Investing or Trading. See Terms & Conditions


One More Thing ... Get Best Stocks Delivered Daily!
Never Ever Miss A Move With Our Top Ten Stocks Lists
Find Best Stocks In Any Market - Bull or Bear Market
Take A Peek At Our Top Ten Stocks Lists: Daily, Weekly, Year-to-Date & Top Trends
Find Best Stocks In Any Market - Bull or Bear Market
Take A Peek At Our Top Ten Stocks Lists: Daily, Weekly, Year-to-Date & Top Trends
Consumer Services Stocks With Best Up Trends [0-bearish to 100-bullish]: Hibbett Sports[100], Gannett Co[100], MYT Netherlands[100], Dillard s[100], Napco Security[100], Lands [100], MINISO [100], Brinker [100], Boot Barn[100], Cheesecake Factory[100], Deluxe [100]
Best Consumer Services Stocks Year-to-Date:
U Power[2801.79%], Vroom [1827.73%], Yatsen Holding[437.18%], Fluent [289.55%], Codere Online[134.25%], Research[101.58%], Sweetgreen [96.9%], RealReal [71.64%], Bright Scholar[64.8%], Spotify Technology[61.41%], PaySign [59.64%] Best Consumer Services Stocks This Week:
Hibbett Sports[21.1%], Noodles & [17.65%], Jumia Technologies[17.51%], Allbirds [15.68%], DoubleDown Interactive[15.06%], Pinduoduo [12.8%], MYT Netherlands[12.01%], China Online[11.9%], iHeartMedia [11.58%], Zumiez [11.4%], Ameresco [11.12%] Best Consumer Services Stocks Daily:
Hibbett Sports[18.84%], SES AI[12.17%], Golden Heaven[11.75%], Spotify Technology[11.41%], Jumia Technologies[11.30%], Sweetgreen [9.50%], Designer Brands[9.49%], Ameresco [9.43%], China Online[9.37%], iHeartMedia [9.00%], Noodles & [8.95%]