
 Login Sign Up


| |||||
 |  | ||||

| 12Stocks.com Market Intelligence |
Best Consumer Services Stocks
| In a hurry? Services & Goods Stocks: Performance Trends Table, Stock Charts
Sort Consumer Services: Daily, Weekly, Year-to-Date, Market Cap & Trends. Filter Services & Goods stocks list by size: All Large Mid-Range Small |
| 12Stocks.com Consumer Services Stocks Performances & Trends Daily | |||||||||
|
|  The overall Smart Investing & Trading Score is 100 (0-bearish to 100-bullish) which puts Consumer Services sector in short term bullish trend. The Smart Investing & Trading Score from previous trading session is 50 and an improvement of trend continues.
| ||||||||
Here are the Smart Investing & Trading Scores of the most requested Consumer Services stocks at 12Stocks.com (click stock name for detailed review):
|


| Consider signing up for our daily 12Stocks.com "Best Stocks Newsletter". You will never ever miss a big stock move again! |
| 12Stocks.com: Investing in Consumer Services sector with Stocks | |
|
The following table helps investors and traders sort through current performance and trends (as measured by Smart Investing & Trading Score) of various
stocks in the Consumer Services sector. Quick View: Move mouse or cursor over stock symbol (ticker) to view short-term Technical chart and over stock name to view long term chart. Click on  to add stock symbol to your watchlist and to add stock symbol to your watchlist and  to view watchlist. Click on any ticker or stock name for detailed market intelligence report for that stock. to view watchlist. Click on any ticker or stock name for detailed market intelligence report for that stock. |
12Stocks.com Performance of Stocks in Consumer Services Sector
| Ticker | Stock Name | Watchlist | Category | Recent Price | Smart Investing & Trading Score | Change % | YTD Change% |
| DPZ | Dominos Pizza |   | Restaurants | 449.95 | 0 | -0.46% | 4.28% |
| JOBS | 51job | | Staffing | 9.75 | 0 | -0.51% | 0.00% |
| MLR | Miller Industries | | Auto Parts | 39.51 | 0 | -0.60% | -39.44% |
| CVEO | Civeo Corp | | Lodging | 22.63 | 0 | -0.88% | 1.06% |
| IP | Paper | | Packaging | 45.57 | 0 | -0.91% | -12.73% |
| TXRH | Texas Roadhouse | | Restaurants | 165.14 | 0 | -0.93% | -8.18% |
| YUMC | Yum China | | Restaurants | 43.56 | 0 | -0.93% | -5.53% |
| RUTH | Ruth s | | Restaurants | 0.97 | 0 | -1.02% | 0.00% |
| PLNT | Planet Fitness | | Leisure | 100.56 | 0 | -1.19% | 0.97% |
| TTS | Tile Shop | | Retail | 1.63 | 0 | -1.21% | 0.00% |
| SAH | Sonic Automotive | | Auto & Truck Dealerships | 78.84 | 0 | -1.26% | 27.78% |
| SPLS | Staples | | Retail | 395.29 | 0 | -1.42% | 0.00% |
| KEQU | Kewaunee Scientific | | Furnishings, Fixtures & Appliances | 42.39 | 0 | -1.60% | -32.36% |
| SLGN | Silgan | | Packaging | 43.27 | 0 | -1.61% | -14.59% |
| FDC | First Data | | Services | 36.79 | 0 | -1.66% | 0.00% |
| MCW | Mister Car | | Auto & Truck Dealerships | 5.32 | 0 | -1.66% | -26.82% |
| ABNB | Airbnb | | Travel Services | 120.37 | 0 | -1.78% | -8.45% |
| LANV | Lanvin | | Luxury Goods | 2.04 | 0 | -1.92% | 2.51% |
| CDRO | Codere Online | | Gambling | 7.60 | 0 | -1.94% | 20.25% |
| GPK | Graphic Packaging | | Packaging | 20.21 | 0 | -2.46% | -23.83% |
| SRT | StarTek | | Services | 2.72 | 0 | -2.51% | 0.00% |
| CHH | Choice Hotels | | Lodging | 109.78 | 0 | -2.69% | -22.17% |
| MYTE | MYT Netherlands | | Luxury Goods | 7.61 | 0 | -3.55% | 1.74% |
| OSB | Norbord | | Wholesale | 37.02 | 0 | -3.67% | 0.00% |
| BFAM | Bright Horizons | | Services | 109.13 | 0 | -3.71% | -1.28% |
| For chart view version of above stock list: Chart View ➞ 0 - 25 , 25 - 50 , 50 - 75 , 75 - 100 , 100 - 125 , 125 - 150 , 150 - 175 , 175 - 200 , 200 - 225 , 225 - 250 , 250 - 275 , 275 - 300 , 300 - 325 , 325 - 350 , 350 - 375 , 375 - 400 , 400 - 425 , 425 - 450 , 450 - 475 , 475 - 500 , 500 - 525 , 525 - 550 , 550 - 575 , 575 - 600 , 600 - 625 | ||
 | Click To Change The Sort Order: By Market Cap or Company Size Performance: Year-to-date, Week and Day |  |
|
Get the most comprehensive stock market coverage daily at 12Stocks.com ➞ Best Stocks Today ➞ Best Stocks Weekly ➞ Best Stocks Year-to-Date ➞ Best Stocks Trends ➞  Best Stocks Today 12Stocks.com Best Nasdaq Stocks ➞ Best S&P 500 Stocks ➞ Best Tech Stocks ➞ Best Biotech Stocks ➞ |
| Detailed Overview of Consumer Services Stocks |
| Consumer Services Technical Overview, Leaders & Laggards, Top Consumer Services ETF Funds & Detailed Consumer Services Stocks List, Charts, Trends & More |
| Consumer Services Sector: Technical Analysis, Trends & YTD Performance | |
| Consumer Services sector is composed of stocks
from retail, entertainment, media/publishing, consumer goods
and services subsectors. Consumer Services sector, as represented by XLY, an exchange-traded fund [ETF] that holds basket of Consumer Services stocks (e.g, Walmart, Alibaba) is up by 9.2482% and is currently underperforming the overall market by -4.1526% year-to-date. Below is a quick view of Technical charts and trends: |
|
 XLY Weekly Chart |
|
| Long Term Trend: Very Good | |
| Medium Term Trend: Good | |
 XLY Daily Chart |
|
| Short Term Trend: Very Good | |
| Overall Trend Score: 100 | |
| YTD Performance: 9.2482% | |
| **Trend Scores & Views Are Only For Educational Purposes And Not For Investing | |
| 12Stocks.com: Top Performing Consumer Services Sector Stocks | ||||||||||||||||||||||||||||||||||||||||||||||||
 The top performing Consumer Services sector stocks year to date are
Now, more recently, over last week, the top performing Consumer Services sector stocks on the move are


|
||||||||||||||||||||||||||||||||||||||||||||||||
| 12Stocks.com: Investing in Consumer Services Sector using Exchange Traded Funds | |
|
The following table shows list of key exchange traded funds (ETF) that
help investors track Consumer Services Index. For detailed view, check out our ETF Funds section of our website. Quick View: Move mouse or cursor over ETF symbol (ticker) to view short-term Technical chart and over ETF name to view long term chart. Click on ticker or stock name for detailed view. Click on to add stock symbol to your watchlist and to view watchlist. |
12Stocks.com List of ETFs that track Consumer Services Index
| Ticker | ETF Name | Watchlist | Recent Price | Smart Investing & Trading Score | Change % | Week % | Year-to-date % |
| PMR | Retail | | 40.96 | 70 | -0.0244081 | 2.86288 | 0% |
| 12Stocks.com: Charts, Trends, Fundamental Data and Performances of Consumer Services Stocks | |
|
We now take in-depth look at all Consumer Services stocks including charts, multi-period performances and overall trends (as measured by Smart Investing & Trading Score). One can sort Consumer Services stocks (click link to choose) by Daily, Weekly and by Year-to-Date performances. Also, one can sort by size of the company or by market capitalization. |
| Select Your Default Chart Type: | |||||
| |||||
| Click on stock symbol or name for detailed view. Click on to add stock symbol to your watchlist and to view watchlist. Quick View: Move mouse or cursor over "Daily" to quickly view daily Technical stock chart and over "Weekly" to view weekly Technical stock chart. | |||||

 | DPZ Dominos Pizza Inc |
| Sector: Services & Goods | |
| SubSector: Restaurants | |
| MarketCap: 15748 Millions | |
| Recent Price: 449.95 Smart Investing & Trading Score: 0 | |
| Day Percent Change: -0.46455% Day Change: -1.61 | |
| Week Change: -2.99248% Year-to-date Change: 4.3% | |
| DPZ Links: Profile News Message Board | |
| Charts:- Daily , Weekly | |
| Add DPZ to Watchlist: View: Get Complete DPZ Trend Analysis ➞ | |
 | JOBS 51job, Inc. |
| Sector: Services & Goods | |
| SubSector: Staffing & Outsourcing Services | |
| MarketCap: 4232.18 Millions | |
| Recent Price: 9.75 Smart Investing & Trading Score: 0 | |
| Day Percent Change: -0.510204% Day Change: -9999 | |
| Week Change: -84.0007% Year-to-date Change: 0.0% | |
| JOBS Links: Profile News Message Board | |
| Charts:- Daily , Weekly | |
| Add JOBS to Watchlist: View: Get Complete JOBS Trend Analysis ➞ | |
 | MLR Miller Industries Inc |
| Sector: Services & Goods | |
| SubSector: Auto Parts | |
| MarketCap: 478.72 Millions | |
| Recent Price: 39.51 Smart Investing & Trading Score: 0 | |
| Day Percent Change: -0.603774% Day Change: -0.36 | |
| Week Change: -5.43322% Year-to-date Change: -39.4% | |
| MLR Links: Profile News Message Board | |
| Charts:- Daily , Weekly | |
| Add MLR to Watchlist: View: Get Complete MLR Trend Analysis ➞ | |
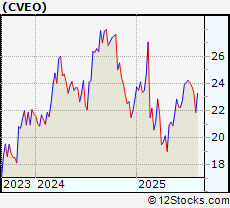 | CVEO Civeo Corp |
| Sector: Services & Goods | |
| SubSector: Lodging | |
| MarketCap: 293.71 Millions | |
| Recent Price: 22.63 Smart Investing & Trading Score: 0 | |
| Day Percent Change: -0.87604% Day Change: 0.32 | |
| Week Change: -3.2906% Year-to-date Change: 1.1% | |
| CVEO Links: Profile News Message Board | |
| Charts:- Daily , Weekly | |
| Add CVEO to Watchlist: View: Get Complete CVEO Trend Analysis ➞ | |
 | IP International Paper Co |
| Sector: Services & Goods | |
| SubSector: Packaging & Containers | |
| MarketCap: 25707.4 Millions | |
| Recent Price: 45.57 Smart Investing & Trading Score: 0 | |
| Day Percent Change: -0.913242% Day Change: -0.37 | |
| Week Change: -6.40789% Year-to-date Change: -12.7% | |
| IP Links: Profile News Message Board | |
| Charts:- Daily , Weekly | |
| Add IP to Watchlist: View: Get Complete IP Trend Analysis ➞ | |
 | TXRH Texas Roadhouse Inc |
| Sector: Services & Goods | |
| SubSector: Restaurants | |
| MarketCap: 11220.2 Millions | |
| Recent Price: 165.14 Smart Investing & Trading Score: 0 | |
| Day Percent Change: -0.92987% Day Change: -0.72 | |
| Week Change: -2.19722% Year-to-date Change: -8.2% | |
| TXRH Links: Profile News Message Board | |
| Charts:- Daily , Weekly | |
| Add TXRH to Watchlist: View: Get Complete TXRH Trend Analysis ➞ | |
 | YUMC Yum China Holdings Inc |
| Sector: Services & Goods | |
| SubSector: Restaurants | |
| MarketCap: 16566.5 Millions | |
| Recent Price: 43.56 Smart Investing & Trading Score: 0 | |
| Day Percent Change: -0.932454% Day Change: 0.48 | |
| Week Change: -3.04919% Year-to-date Change: -5.5% | |
| YUMC Links: Profile News Message Board | |
| Charts:- Daily , Weekly | |
| Add YUMC to Watchlist: View: Get Complete YUMC Trend Analysis ➞ | |
 | RUTH Ruth s Hospitality Group, Inc. |
| Sector: Services & Goods | |
| SubSector: Restaurants | |
| MarketCap: 138.97 Millions | |
| Recent Price: 0.97 Smart Investing & Trading Score: 0 | |
| Day Percent Change: -1.02041% Day Change: -9999 | |
| Week Change: -95.4863% Year-to-date Change: 0.0% | |
| RUTH Links: Profile News Message Board | |
| Charts:- Daily , Weekly | |
| Add RUTH to Watchlist: View: Get Complete RUTH Trend Analysis ➞ | |
 | PLNT Planet Fitness Inc |
| Sector: Services & Goods | |
| SubSector: Leisure | |
| MarketCap: 8803.24 Millions | |
| Recent Price: 100.56 Smart Investing & Trading Score: 0 | |
| Day Percent Change: -1.18896% Day Change: -0.87 | |
| Week Change: -3.77954% Year-to-date Change: 1.0% | |
| PLNT Links: Profile News Message Board | |
| Charts:- Daily , Weekly | |
| Add PLNT to Watchlist: View: Get Complete PLNT Trend Analysis ➞ | |
 | TTS Tile Shop Holdings, Inc. |
| Sector: Services & Goods | |
| SubSector: Home Improvement Stores | |
| MarketCap: 938.74 Millions | |
| Recent Price: 1.63 Smart Investing & Trading Score: 0 | |
| Day Percent Change: -1.21212% Day Change: -9999 | |
| Week Change: -89.1261% Year-to-date Change: 0.0% | |
| TTS Links: Profile News Message Board | |
| Charts:- Daily , Weekly | |
| Add TTS to Watchlist: View: Get Complete TTS Trend Analysis ➞ | |
 | SAH Sonic Automotive, Inc |
| Sector: Services & Goods | |
| SubSector: Auto & Truck Dealerships | |
| MarketCap: 2838.9 Millions | |
| Recent Price: 78.84 Smart Investing & Trading Score: 0 | |
| Day Percent Change: -1.26487% Day Change: 0.11 | |
| Week Change: -5.16059% Year-to-date Change: 27.8% | |
| SAH Links: Profile News Message Board | |
| Charts:- Daily , Weekly | |
| Add SAH to Watchlist: View: Get Complete SAH Trend Analysis ➞ | |
 | SPLS Staples, Inc. |
| Sector: Services & Goods | |
| SubSector: Specialty Retail, Other | |
| MarketCap: 5724.56 Millions | |
| Recent Price: 395.29 Smart Investing & Trading Score: 0 | |
| Day Percent Change: -1.42148% Day Change: -9999 | |
| Week Change: -6.6325% Year-to-date Change: 0.0% | |
| SPLS Links: Profile News Message Board | |
| Charts:- Daily , Weekly | |
| Add SPLS to Watchlist: View: Get Complete SPLS Trend Analysis ➞ | |
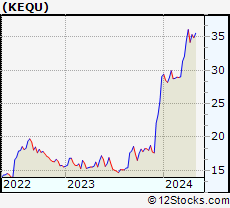 | KEQU Kewaunee Scientific Corporation |
| Sector: Services & Goods | |
| SubSector: Furnishings, Fixtures & Appliances | |
| MarketCap: 158.34 Millions | |
| Recent Price: 42.39 Smart Investing & Trading Score: 0 | |
| Day Percent Change: -1.60167% Day Change: -0.56 | |
| Week Change: -24.3036% Year-to-date Change: -32.4% | |
| KEQU Links: Profile News Message Board | |
| Charts:- Daily , Weekly | |
| Add KEQU to Watchlist: View: Get Complete KEQU Trend Analysis ➞ | |
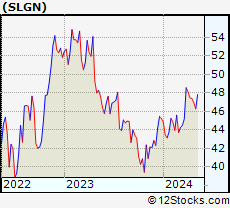 | SLGN Silgan Holdings Inc |
| Sector: Services & Goods | |
| SubSector: Packaging & Containers | |
| MarketCap: 4832.88 Millions | |
| Recent Price: 43.27 Smart Investing & Trading Score: 0 | |
| Day Percent Change: -1.61437% Day Change: -0.58 | |
| Week Change: -4.20633% Year-to-date Change: -14.6% | |
| SLGN Links: Profile News Message Board | |
| Charts:- Daily , Weekly | |
| Add SLGN to Watchlist: View: Get Complete SLGN Trend Analysis ➞ | |
 | FDC First Data Corporation |
| Sector: Services & Goods | |
| SubSector: Business Services | |
| MarketCap: 14383.3 Millions | |
| Recent Price: 36.79 Smart Investing & Trading Score: 0 | |
| Day Percent Change: -1.65731% Day Change: -9999 | |
| Week Change: -48.0294% Year-to-date Change: 0.0% | |
| FDC Links: Profile News Message Board | |
| Charts:- Daily , Weekly | |
| Add FDC to Watchlist: View: Get Complete FDC Trend Analysis ➞ | |
 | MCW Mister Car Wash Inc |
| Sector: Services & Goods | |
| SubSector: Auto & Truck Dealerships | |
| MarketCap: 1852.38 Millions | |
| Recent Price: 5.32 Smart Investing & Trading Score: 0 | |
| Day Percent Change: -1.66359% Day Change: -0.01 | |
| Week Change: -6.00707% Year-to-date Change: -26.8% | |
| MCW Links: Profile News Message Board | |
| Charts:- Daily , Weekly | |
| Add MCW to Watchlist: View: Get Complete MCW Trend Analysis ➞ | |
 | ABNB Airbnb Inc |
| Sector: Services & Goods | |
| SubSector: Travel Services | |
| MarketCap: 76940 Millions | |
| Recent Price: 120.37 Smart Investing & Trading Score: 0 | |
| Day Percent Change: -1.77887% Day Change: -2.31 | |
| Week Change: -2.77845% Year-to-date Change: -8.4% | |
| ABNB Links: Profile News Message Board | |
| Charts:- Daily , Weekly | |
| Add ABNB to Watchlist: View: Get Complete ABNB Trend Analysis ➞ | |
 | LANV Lanvin Group Holdings Limited |
| Sector: Services & Goods | |
| SubSector: Luxury Goods | |
| MarketCap: 295.4 Millions | |
| Recent Price: 2.04 Smart Investing & Trading Score: 0 | |
| Day Percent Change: -1.92308% Day Change: -0.11 | |
| Week Change: -13.0064% Year-to-date Change: 2.5% | |
| LANV Links: Profile News Message Board | |
| Charts:- Daily , Weekly | |
| Add LANV to Watchlist: View: Get Complete LANV Trend Analysis ➞ | |
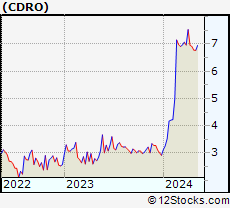 | CDRO Codere Online Luxembourg S.A |
| Sector: Services & Goods | |
| SubSector: Gambling | |
| MarketCap: 376.08 Millions | |
| Recent Price: 7.60 Smart Investing & Trading Score: 0 | |
| Day Percent Change: -1.93548% Day Change: 0.25 | |
| Week Change: -7.76699% Year-to-date Change: 20.3% | |
| CDRO Links: Profile News Message Board | |
| Charts:- Daily , Weekly | |
| Add CDRO to Watchlist: View: Get Complete CDRO Trend Analysis ➞ | |
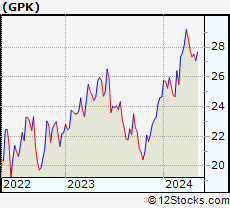 | GPK Graphic Packaging Holding Co |
| Sector: Services & Goods | |
| SubSector: Packaging & Containers | |
| MarketCap: 6378.24 Millions | |
| Recent Price: 20.21 Smart Investing & Trading Score: 0 | |
| Day Percent Change: -2.46139% Day Change: -0.42 | |
| Week Change: -6.13098% Year-to-date Change: -23.8% | |
| GPK Links: Profile News Message Board | |
| Charts:- Daily , Weekly | |
| Add GPK to Watchlist: View: Get Complete GPK Trend Analysis ➞ | |
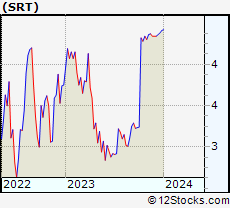 | SRT StarTek, Inc. |
| Sector: Services & Goods | |
| SubSector: Business Services | |
| MarketCap: 168.282 Millions | |
| Recent Price: 2.72 Smart Investing & Trading Score: 0 | |
| Day Percent Change: -2.50896% Day Change: -9999 | |
| Week Change: -37.7574% Year-to-date Change: 0.0% | |
| SRT Links: Profile News Message Board | |
| Charts:- Daily , Weekly | |
| Add SRT to Watchlist: View: Get Complete SRT Trend Analysis ➞ | |
 | CHH Choice Hotels International, Inc |
| Sector: Services & Goods | |
| SubSector: Lodging | |
| MarketCap: 5405.53 Millions | |
| Recent Price: 109.78 Smart Investing & Trading Score: 0 | |
| Day Percent Change: -2.68593% Day Change: -2.61 | |
| Week Change: -6.03441% Year-to-date Change: -22.2% | |
| CHH Links: Profile News Message Board | |
| Charts:- Daily , Weekly | |
| Add CHH to Watchlist: View: Get Complete CHH Trend Analysis ➞ | |
 | MYTE MYT Netherlands Parent B.V. |
| Sector: Services & Goods | |
| SubSector: Luxury Goods | |
| MarketCap: 330 Millions | |
| Recent Price: 7.61 Smart Investing & Trading Score: 0 | |
| Day Percent Change: -3.5488% Day Change: -9999 | |
| Week Change: -5.58313% Year-to-date Change: 1.7% | |
| MYTE Links: Profile News Message Board | |
| Charts:- Daily , Weekly | |
| Add MYTE to Watchlist: View: Get Complete MYTE Trend Analysis ➞ | |
 | OSB Norbord Inc. |
| Sector: Services & Goods | |
| SubSector: Building Materials Wholesale | |
| MarketCap: 847.243 Millions | |
| Recent Price: 37.02 Smart Investing & Trading Score: 0 | |
| Day Percent Change: -3.66901% Day Change: -9999 | |
| Week Change: -92.3035% Year-to-date Change: 0.0% | |
| OSB Links: Profile News Message Board | |
| Charts:- Daily , Weekly | |
| Add OSB to Watchlist: View: Get Complete OSB Trend Analysis ➞ | |
 | BFAM Bright Horizons Family Solutions, Inc |
| Sector: Services & Goods | |
| SubSector: Personal Services | |
| MarketCap: 6643.77 Millions | |
| Recent Price: 109.13 Smart Investing & Trading Score: 0 | |
| Day Percent Change: -3.70599% Day Change: -3.15 | |
| Week Change: -6.58278% Year-to-date Change: -1.3% | |
| BFAM Links: Profile News Message Board | |
| Charts:- Daily , Weekly | |
| Add BFAM to Watchlist: View: Get Complete BFAM Trend Analysis ➞ | |
| For tabular summary view of above stock list: Summary View ➞ 0 - 25 , 25 - 50 , 50 - 75 , 75 - 100 , 100 - 125 , 125 - 150 , 150 - 175 , 175 - 200 , 200 - 225 , 225 - 250 , 250 - 275 , 275 - 300 , 300 - 325 , 325 - 350 , 350 - 375 , 375 - 400 , 400 - 425 , 425 - 450 , 450 - 475 , 475 - 500 , 500 - 525 , 525 - 550 , 550 - 575 , 575 - 600 , 600 - 625 | ||
| Click To Change The Sort Order: By Market Cap or Company Size Performance: Year-to-date, Week and Day | |
| Select Chart Type: | ||
|
Best Stocks Today 12Stocks.com |
© 2025 12Stocks.com Terms & Conditions Privacy Contact Us
All Information Provided Only For Education And Not To Be Used For Investing or Trading. See Terms & Conditions


One More Thing ... Get Best Stocks Delivered Daily!
Never Ever Miss A Move With Our Top Ten Stocks Lists
Find Best Stocks In Any Market - Bull or Bear Market
Take A Peek At Our Top Ten Stocks Lists: Daily, Weekly, Year-to-Date & Top Trends
Find Best Stocks In Any Market - Bull or Bear Market
Take A Peek At Our Top Ten Stocks Lists: Daily, Weekly, Year-to-Date & Top Trends
Consumer Services Stocks With Best Up Trends [0-bearish to 100-bullish]: Whole Foods[100], Net 1[100], LiveWire [100], Denny's Corp[100], Ermenegildo Zegna[100], Revolve [100], Therealreal [100], Carters [100], Resources Connection[100], Sally Beauty[100], Advance Auto[100]
Best Consumer Services Stocks Year-to-Date:
WW [1871.33%], Nova Lifestyle[690.41%], ThredUp [665.957%], Lucid [554.785%], Vroom [455.146%], China Yuchai[297.742%], Luxottica [210.802%], Cooper-Standard [190.99%], Masterbeef [156.098%], Jumia Technologies[151.026%], Niu Technologies[136.782%] Best Consumer Services Stocks This Week:
Party City[37593.9%], Companhia Brasileira[18587.4%], Conn s[16420.1%], Rite Aid[10214.6%], Arctic Cat[2387.5%], Chico s[2120.53%], Multi-Color [2063.68%], Reis [1734.59%], Quotient Technology[954.386%], Express [946.725%], Volt Information[705.085%] Best Consumer Services Stocks Daily:
Container Store[22.6852%], SUPERVALU [20.4138%], Irobot Corp[15.4971%], World Wrestling[14.734%], Global Sources[13.1016%], Masterbeef [12.2995%], Whole Foods[11.8363%], iClick Interactive[10%], Net 1[9.46197%], LiveWire [9.09091%], Peloton Interactive[8.17942%]