
 Login Sign Up


| |||||
 |  | ||||

| 12Stocks.com Market Intelligence |
Best Consumer Services Stocks
| In a hurry? Services & Goods Stocks: Performance Trends Table, Stock Charts
Sort Consumer Services: Daily, Weekly, Year-to-Date, Market Cap & Trends. Filter Services & Goods stocks list by size: All Large Mid-Range Small |
| 12Stocks.com Consumer Services Stocks Performances & Trends Daily | |||||||||
|
|  The overall Smart Investing & Trading Score is 90 (0-bearish to 100-bullish) which puts Consumer Services sector in short term bullish trend. The Smart Investing & Trading Score from previous trading session is 50 and hence an improvement of trend.
| ||||||||
Here are the Smart Investing & Trading Scores of the most requested Consumer Services stocks at 12Stocks.com (click stock name for detailed review):
|


| Consider signing up for our daily 12Stocks.com "Best Stocks Newsletter". You will never ever miss a big stock move again! |
| 12Stocks.com: Investing in Consumer Services sector with Stocks | |
|
The following table helps investors and traders sort through current performance and trends (as measured by Smart Investing & Trading Score) of various
stocks in the Consumer Services sector. Quick View: Move mouse or cursor over stock symbol (ticker) to view short-term Technical chart and over stock name to view long term chart. Click on  to add stock symbol to your watchlist and to add stock symbol to your watchlist and  to view watchlist. Click on any ticker or stock name for detailed market intelligence report for that stock. to view watchlist. Click on any ticker or stock name for detailed market intelligence report for that stock. |
12Stocks.com Performance of Stocks in Consumer Services Sector
| Ticker | Stock Name | Watchlist | Category | Recent Price | Smart Investing & Trading Score | Change % | Weekly Change% |
| WMK | Weis Markets |   | Grocery | 72.56 | 40 | 2.37% | 4.64% |
| BABA | Alibaba | | Retail | 122.42 | 90 | 3.13% | 4.60% |
| GCO | Genesco | | Apparel | 25.61 | 80 | 5.09% | 4.49% |
| WYNN | Wynn Resorts | | Casinos | 112.49 | 100 | -24.93% | 4.43% |
| ROST | Ross Stores | | Apparel | 148.00 | 100 | 1.68% | 4.38% |
| STRA | Strategic Education | | Education | 78.11 | 40 | 29.85% | 4.37% |
| WMT | Walmart | | Retail | 103.62 | 70 | 0.27% | 4.34% |
| CRMT | America s | | Automobile | 45.66 | 60 | 5.93% | 4.34% |
| AEO | American Eagle | | Apparel | 12.54 | 50 | 4.23% | 4.33% |
| LVWR | LiveWire | | Auto Manufacturers | 3.51 | 28 | -0.30% | 4.15% |
| HSIC | Henry Schein | | Medical | 67.50 | 40 | 1.35% | 4.12% |
| GES | Guess | | Apparel | 13.48 | 30 | 2.82% | 4.09% |
| VSEC | VSE | | Services | 164.91 | 100 | 69.41% | 4.06% |
| DG | Dollar General | | Retail | 115.19 | 50 | 0.24% | 3.91% |
| HVT | Haverty Furniture | | Retail | 22.21 | 90 | 6.43% | 3.88% |
| PRAA | PRA | | Services | 16.16 | 80 | 5.58% | 3.86% |
| ABM | ABM Industries | | Services | 48.76 | 70 | 1.75% | 3.81% |
| NATH | Nathan s | | Restaurants | 102.13 | 70 | 4.71% | 3.78% |
| TGT | Target | | Retail | 106.26 | 60 | 1.06% | 3.74% |
| AMZN | Amazon.com | | Retail | 221.47 | 10 | 0.48% | 3.61% |
| TJX | TJX | | Department | 133.39 | 100 | 0.41% | 3.59% |
| AAP | Advance Auto | | Auto Parts | 59.11 | 60 | -3.88% | 3.54% |
| SBUX | Starbucks | | Restaurants | 93.37 | 80 | 1.70% | 3.51% |
| BOOT | Boot Barn | | Apparel | 172.90 | 70 | 3.00% | 3.50% |
| PDD | Pinduoduo | | Retail | 116.43 | 80 | -4.89% | 3.38% |
| For chart view version of above stock list: Chart View ➞ 0 - 25 , 25 - 50 , 50 - 75 , 75 - 100 , 100 - 125 , 125 - 150 , 150 - 175 , 175 - 200 , 200 - 225 , 225 - 250 , 250 - 275 , 275 - 300 , 300 - 325 , 325 - 350 , 350 - 375 | ||
 | Click To Change The Sort Order: By Market Cap or Company Size Performance: Year-to-date, Week and Day |  |
|
Get the most comprehensive stock market coverage daily at 12Stocks.com ➞ Best Stocks Today ➞ Best Stocks Weekly ➞ Best Stocks Year-to-Date ➞ Best Stocks Trends ➞  Best Stocks Today 12Stocks.com Best Nasdaq Stocks ➞ Best S&P 500 Stocks ➞ Best Tech Stocks ➞ Best Biotech Stocks ➞ |
| Detailed Overview of Consumer Services Stocks |
| Consumer Services Technical Overview, Leaders & Laggards, Top Consumer Services ETF Funds & Detailed Consumer Services Stocks List, Charts, Trends & More |
| Consumer Services Sector: Technical Analysis, Trends & YTD Performance | |
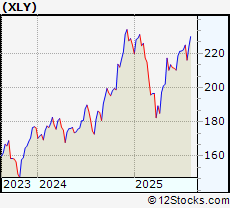
| Consumer Services sector is composed of stocks
from retail, entertainment, media/publishing, consumer goods
and services subsectors. Consumer Services sector, as represented by XLY, an exchange-traded fund [ETF] that holds basket of Consumer Services stocks (e.g, Walmart, Alibaba) is up by 1.56% and is currently underperforming the overall market by -8.24% year-to-date. Below is a quick view of Technical charts and trends: |
|
 XLY Weekly Chart |
|
| Long Term Trend: Very Good | |
| Medium Term Trend: Very Good | |
 XLY Daily Chart |
|
| Short Term Trend: Very Good | |
| Overall Trend Score: 90 | |
| YTD Performance: 1.56% | |
| **Trend Scores & Views Are Only For Educational Purposes And Not For Investing | |
| 12Stocks.com: Top Performing Consumer Services Sector Stocks | ||||||||||||||||||||||||||||||||||||||||||||||||
 The top performing Consumer Services sector stocks year to date are
Now, more recently, over last week, the top performing Consumer Services sector stocks on the move are


|
||||||||||||||||||||||||||||||||||||||||||||||||
| 12Stocks.com: Investing in Consumer Services Sector using Exchange Traded Funds | |
|
The following table shows list of key exchange traded funds (ETF) that
help investors track Consumer Services Index. For detailed view, check out our ETF Funds section of our website. Quick View: Move mouse or cursor over ETF symbol (ticker) to view short-term Technical chart and over ETF name to view long term chart. Click on ticker or stock name for detailed view. Click on to add stock symbol to your watchlist and to view watchlist. |
12Stocks.com List of ETFs that track Consumer Services Index
| Ticker | ETF Name | Watchlist | Recent Price | Smart Investing & Trading Score | Change % | Week % | Year-to-date % |
| XLY | Consumer Discret Sel | | 226.74 | 90 | 2.01 | 3.58 | 1.56% |
| RTH | Retail | | 245.88 | 90 | 0.63 | 2.04 | 9.67% |
| IYC | Consumer Services | | 101.87 | 90 | 1.68 | 2.71 | 6.29% |
| XRT | Retail | | 83.23 | 90 | 2.54 | 4.59 | 5.13% |
| IYK | Consumer Goods | | 70.15 | 40 | 0.37 | 1.9 | 8.01% |
| UCC | Consumer Services | | 48.63 | 90 | 2.96 | 7 | -5.38% |
| RETL | Retail Bull 3X | | 9.28 | 90 | 26.94 | 13.31 | -5.36% |
| SCC | Short Consumer Services | | 16.35 | 0 | -19.86 | -6.67 | -9.94% |
| UGE | Consumer Goods | | 19.12 | 50 | 1.05 | 5.18 | 6.94% |
| 12Stocks.com: Charts, Trends, Fundamental Data and Performances of Consumer Services Stocks | |
|
We now take in-depth look at all Consumer Services stocks including charts, multi-period performances and overall trends (as measured by Smart Investing & Trading Score). One can sort Consumer Services stocks (click link to choose) by Daily, Weekly and by Year-to-Date performances. Also, one can sort by size of the company or by market capitalization. |
| Select Your Default Chart Type: | |||||
| |||||
| Click on stock symbol or name for detailed view. Click on to add stock symbol to your watchlist and to view watchlist. Quick View: Move mouse or cursor over "Daily" to quickly view daily Technical stock chart and over "Weekly" to view weekly Technical stock chart. | |||||

 | WMK Weis Markets, Inc. |
| Sector: Services & Goods | |
| SubSector: Grocery Stores | |
| MarketCap: 1148.75 Millions | |
| Recent Price: 72.56 Smart Investing & Trading Score: 40 | |
| Day Percent Change: 2.37% Day Change: 1.53 | |
| Week Change: 4.64% Year-to-date Change: 8.6% | |
| WMK Links: Profile News Message Board | |
| Charts:- Daily , Weekly | |
| Add WMK to Watchlist: View: Get Complete WMK Trend Analysis ➞ | |
 | BABA Alibaba Group Holding Limited |
| Sector: Services & Goods | |
| SubSector: Specialty Retail, Other | |
| MarketCap: 522666 Millions | |
| Recent Price: 122.42 Smart Investing & Trading Score: 90 | |
| Day Percent Change: 3.13% Day Change: 2.59 | |
| Week Change: 4.6% Year-to-date Change: 45.5% | |
| BABA Links: Profile News Message Board | |
| Charts:- Daily , Weekly | |
| Add BABA to Watchlist: View: Get Complete BABA Trend Analysis ➞ | |
 | GCO Genesco Inc. |
| Sector: Services & Goods | |
| SubSector: Apparel Stores | |
| MarketCap: 187.508 Millions | |
| Recent Price: 25.61 Smart Investing & Trading Score: 80 | |
| Day Percent Change: 5.09% Day Change: 1.51 | |
| Week Change: 4.49% Year-to-date Change: -40.1% | |
| GCO Links: Profile News Message Board | |
| Charts:- Daily , Weekly | |
| Add GCO to Watchlist: View: Get Complete GCO Trend Analysis ➞ | |
 | WYNN Wynn Resorts, Limited |
| Sector: Services & Goods | |
| SubSector: Resorts & Casinos | |
| MarketCap: 6643.34 Millions | |
| Recent Price: 112.49 Smart Investing & Trading Score: 100 | |
| Day Percent Change: -24.93% Day Change: -25.7 | |
| Week Change: 4.43% Year-to-date Change: 31.3% | |
| WYNN Links: Profile News Message Board | |
| Charts:- Daily , Weekly | |
| Add WYNN to Watchlist: View: Get Complete WYNN Trend Analysis ➞ | |
 | ROST Ross Stores, Inc. |
| Sector: Services & Goods | |
| SubSector: Apparel Stores | |
| MarketCap: 24938.8 Millions | |
| Recent Price: 148.00 Smart Investing & Trading Score: 100 | |
| Day Percent Change: 1.68% Day Change: 2.56 | |
| Week Change: 4.38% Year-to-date Change: -1.6% | |
| ROST Links: Profile News Message Board | |
| Charts:- Daily , Weekly | |
| Add ROST to Watchlist: View: Get Complete ROST Trend Analysis ➞ | |
 | STRA Strategic Education, Inc. |
| Sector: Services & Goods | |
| SubSector: Education & Training Services | |
| MarketCap: 2621.56 Millions | |
| Recent Price: 78.11 Smart Investing & Trading Score: 40 | |
| Day Percent Change: 29.85% Day Change: 22.39 | |
| Week Change: 4.37% Year-to-date Change: -15.2% | |
| STRA Links: Profile News Message Board | |
| Charts:- Daily , Weekly | |
| Add STRA to Watchlist: View: Get Complete STRA Trend Analysis ➞ | |
 | WMT Walmart Inc. |
| Sector: Services & Goods | |
| SubSector: Discount, Variety Stores | |
| MarketCap: 355610 Millions | |
| Recent Price: 103.62 Smart Investing & Trading Score: 70 | |
| Day Percent Change: 0.27% Day Change: 0.2 | |
| Week Change: 4.34% Year-to-date Change: 15.3% | |
| WMT Links: Profile News Message Board | |
| Charts:- Daily , Weekly | |
| Add WMT to Watchlist: View: Get Complete WMT Trend Analysis ➞ | |
 | CRMT America s Car-Mart, Inc. |
| Sector: Services & Goods | |
| SubSector: Auto Dealerships | |
| MarketCap: 329.921 Millions | |
| Recent Price: 45.66 Smart Investing & Trading Score: 60 | |
| Day Percent Change: 5.93% Day Change: 3.5 | |
| Week Change: 4.34% Year-to-date Change: -10.9% | |
| CRMT Links: Profile News Message Board | |
| Charts:- Daily , Weekly | |
| Add CRMT to Watchlist: View: Get Complete CRMT Trend Analysis ➞ | |
 | AEO American Eagle Outfitters, Inc. |
| Sector: Services & Goods | |
| SubSector: Apparel Stores | |
| MarketCap: 1577.08 Millions | |
| Recent Price: 12.54 Smart Investing & Trading Score: 50 | |
| Day Percent Change: 4.23% Day Change: 0.9 | |
| Week Change: 4.33% Year-to-date Change: -22.3% | |
| AEO Links: Profile News Message Board | |
| Charts:- Daily , Weekly | |
| Add AEO to Watchlist: View: Get Complete AEO Trend Analysis ➞ | |
 | LVWR LiveWire Group, Inc. |
| Sector: Services & Goods | |
| SubSector: Auto Manufacturers | |
| MarketCap: 2400 Millions | |
| Recent Price: 3.51 Smart Investing & Trading Score: 28 | |
| Day Percent Change: -0.3% Day Change: -0.02 | |
| Week Change: 4.15% Year-to-date Change: -27.0% | |
| LVWR Links: Profile News Message Board | |
| Charts:- Daily , Weekly | |
| Add LVWR to Watchlist: View: Get Complete LVWR Trend Analysis ➞ | |
 | HSIC Henry Schein, Inc. |
| Sector: Services & Goods | |
| SubSector: Medical Equipment Wholesale | |
| MarketCap: 6760.9 Millions | |
| Recent Price: 67.50 Smart Investing & Trading Score: 40 | |
| Day Percent Change: 1.35% Day Change: 0.94 | |
| Week Change: 4.12% Year-to-date Change: -2.5% | |
| HSIC Links: Profile News Message Board | |
| Charts:- Daily , Weekly | |
| Add HSIC to Watchlist: View: Get Complete HSIC Trend Analysis ➞ | |
 | GES Guess , Inc. |
| Sector: Services & Goods | |
| SubSector: Apparel Stores | |
| MarketCap: 591.908 Millions | |
| Recent Price: 13.48 Smart Investing & Trading Score: 30 | |
| Day Percent Change: 2.82% Day Change: 0.59 | |
| Week Change: 4.09% Year-to-date Change: 1.5% | |
| GES Links: Profile News Message Board | |
| Charts:- Daily , Weekly | |
| Add GES to Watchlist: View: Get Complete GES Trend Analysis ➞ | |
 | VSEC VSE Corporation |
| Sector: Services & Goods | |
| SubSector: Technical Services | |
| MarketCap: 183.61 Millions | |
| Recent Price: 164.91 Smart Investing & Trading Score: 100 | |
| Day Percent Change: 69.41% Day Change: 37.26 | |
| Week Change: 4.06% Year-to-date Change: 73.9% | |
| VSEC Links: Profile News Message Board | |
| Charts:- Daily , Weekly | |
| Add VSEC to Watchlist: View: Get Complete VSEC Trend Analysis ➞ | |
 | DG Dollar General Corporation |
| Sector: Services & Goods | |
| SubSector: Discount, Variety Stores | |
| MarketCap: 39611.9 Millions | |
| Recent Price: 115.19 Smart Investing & Trading Score: 50 | |
| Day Percent Change: 0.24% Day Change: 0.3 | |
| Week Change: 3.91% Year-to-date Change: 54.9% | |
| DG Links: Profile News Message Board | |
| Charts:- Daily , Weekly | |
| Add DG to Watchlist: View: Get Complete DG Trend Analysis ➞ | |
 | HVT Haverty Furniture Companies, Inc. |
| Sector: Services & Goods | |
| SubSector: Home Furnishing Stores | |
| MarketCap: 253.125 Millions | |
| Recent Price: 22.21 Smart Investing & Trading Score: 90 | |
| Day Percent Change: 6.43% Day Change: 1.7 | |
| Week Change: 3.88% Year-to-date Change: 2.8% | |
| HVT Links: Profile News Message Board | |
| Charts:- Daily , Weekly | |
| Add HVT to Watchlist: View: Get Complete HVT Trend Analysis ➞ | |
 | PRAA PRA Group, Inc. |
| Sector: Services & Goods | |
| SubSector: Business Services | |
| MarketCap: 1290.32 Millions | |
| Recent Price: 16.16 Smart Investing & Trading Score: 80 | |
| Day Percent Change: 5.58% Day Change: 1.21 | |
| Week Change: 3.86% Year-to-date Change: -22.6% | |
| PRAA Links: Profile News Message Board | |
| Charts:- Daily , Weekly | |
| Add PRAA to Watchlist: View: Get Complete PRAA Trend Analysis ➞ | |
 | ABM ABM Industries Incorporated |
| Sector: Services & Goods | |
| SubSector: Business Services | |
| MarketCap: 1706.72 Millions | |
| Recent Price: 48.76 Smart Investing & Trading Score: 70 | |
| Day Percent Change: 1.75% Day Change: 0.95 | |
| Week Change: 3.81% Year-to-date Change: -3.2% | |
| ABM Links: Profile News Message Board | |
| Charts:- Daily , Weekly | |
| Add ABM to Watchlist: View: Get Complete ABM Trend Analysis ➞ | |
 | NATH Nathan s Famous, Inc. |
| Sector: Services & Goods | |
| SubSector: Restaurants | |
| MarketCap: 211.77 Millions | |
| Recent Price: 102.13 Smart Investing & Trading Score: 70 | |
| Day Percent Change: 4.71% Day Change: 3.53 | |
| Week Change: 3.78% Year-to-date Change: 31.2% | |
| NATH Links: Profile News Message Board | |
| Charts:- Daily , Weekly | |
| Add NATH to Watchlist: View: Get Complete NATH Trend Analysis ➞ | |
 | TGT Target Corporation |
| Sector: Services & Goods | |
| SubSector: Discount, Variety Stores | |
| MarketCap: 55980.6 Millions | |
| Recent Price: 106.26 Smart Investing & Trading Score: 60 | |
| Day Percent Change: 1.06% Day Change: 1.66 | |
| Week Change: 3.74% Year-to-date Change: -19.8% | |
| TGT Links: Profile News Message Board | |
| Charts:- Daily , Weekly | |
| Add TGT to Watchlist: View: Get Complete TGT Trend Analysis ➞ | |
 | AMZN Amazon.com, Inc. |
| Sector: Services & Goods | |
| SubSector: Catalog & Mail Order Houses | |
| MarketCap: 998070 Millions | |
| Recent Price: 221.47 Smart Investing & Trading Score: 10 | |
| Day Percent Change: 0.48% Day Change: 0.85 | |
| Week Change: 3.61% Year-to-date Change: 1.0% | |
| AMZN Links: Profile News Message Board | |
| Charts:- Daily , Weekly | |
| Add AMZN to Watchlist: View: Get Complete AMZN Trend Analysis ➞ | |
 | TJX The TJX Companies, Inc. |
| Sector: Services & Goods | |
| SubSector: Department Stores | |
| MarketCap: 50656.2 Millions | |
| Recent Price: 133.39 Smart Investing & Trading Score: 100 | |
| Day Percent Change: 0.41% Day Change: 0.49 | |
| Week Change: 3.59% Year-to-date Change: 11.1% | |
| TJX Links: Profile News Message Board | |
| Charts:- Daily , Weekly | |
| Add TJX to Watchlist: View: Get Complete TJX Trend Analysis ➞ | |
 | AAP Advance Auto Parts, Inc. |
| Sector: Services & Goods | |
| SubSector: Auto Parts Stores | |
| MarketCap: 5977.7 Millions | |
| Recent Price: 59.11 Smart Investing & Trading Score: 60 | |
| Day Percent Change: -3.88% Day Change: -1.98 | |
| Week Change: 3.54% Year-to-date Change: 27.2% | |
| AAP Links: Profile News Message Board | |
| Charts:- Daily , Weekly | |
| Add AAP to Watchlist: View: Get Complete AAP Trend Analysis ➞ | |
 | SBUX Starbucks Corporation |
| Sector: Services & Goods | |
| SubSector: Specialty Eateries | |
| MarketCap: 74909.7 Millions | |
| Recent Price: 93.37 Smart Investing & Trading Score: 80 | |
| Day Percent Change: 1.7% Day Change: 1.57 | |
| Week Change: 3.51% Year-to-date Change: 3.6% | |
| SBUX Links: Profile News Message Board | |
| Charts:- Daily , Weekly | |
| Add SBUX to Watchlist: View: Get Complete SBUX Trend Analysis ➞ | |
 | BOOT Boot Barn Holdings, Inc. |
| Sector: Services & Goods | |
| SubSector: Apparel Stores | |
| MarketCap: 360.608 Millions | |
| Recent Price: 172.90 Smart Investing & Trading Score: 70 | |
| Day Percent Change: 3% Day Change: 4.15 | |
| Week Change: 3.5% Year-to-date Change: 13.9% | |
| BOOT Links: Profile News Message Board | |
| Charts:- Daily , Weekly | |
| Add BOOT to Watchlist: View: Get Complete BOOT Trend Analysis ➞ | |
 | PDD Pinduoduo Inc. |
| Sector: Services & Goods | |
| SubSector: Specialty Retail, Other | |
| MarketCap: 41696.2 Millions | |
| Recent Price: 116.43 Smart Investing & Trading Score: 80 | |
| Day Percent Change: -4.89% Day Change: -7.19 | |
| Week Change: 3.38% Year-to-date Change: 20.0% | |
| PDD Links: Profile News Message Board | |
| Charts:- Daily , Weekly | |
| Add PDD to Watchlist: View: Get Complete PDD Trend Analysis ➞ | |
| For tabular summary view of above stock list: Summary View ➞ 0 - 25 , 25 - 50 , 50 - 75 , 75 - 100 , 100 - 125 , 125 - 150 , 150 - 175 , 175 - 200 , 200 - 225 , 225 - 250 , 250 - 275 , 275 - 300 , 300 - 325 , 325 - 350 , 350 - 375 | ||
| Click To Change The Sort Order: By Market Cap or Company Size Performance: Year-to-date, Week and Day | |
| Select Chart Type: | ||
|
Best Stocks Today 12Stocks.com |
© 2025 12Stocks.com Terms & Conditions Privacy Contact Us
All Information Provided Only For Education And Not To Be Used For Investing or Trading. See Terms & Conditions


One More Thing ... Get Best Stocks Delivered Daily!
Never Ever Miss A Move With Our Top Ten Stocks Lists
Find Best Stocks In Any Market - Bull or Bear Market
Take A Peek At Our Top Ten Stocks Lists: Daily, Weekly, Year-to-Date & Top Trends
Find Best Stocks In Any Market - Bull or Bear Market
Take A Peek At Our Top Ten Stocks Lists: Daily, Weekly, Year-to-Date & Top Trends
Consumer Services Stocks With Best Up Trends [0-bearish to 100-bullish]: VSE [100], eBay [100], Kratos Defense[100], Graham [100], CompX [100], Fastenal [100], Jacobs Engineering[100], Willdan [100], Gray Television[100], Williams-Sonoma [100], Rush Enterprises[100]
Best Consumer Services Stocks Year-to-Date:
ThredUp [640.29%], Vivid Seats[278.19%], Willdan [211.45%], Kratos Defense[162.09%], Roblox [123.87%], National Vision[120.92%], Altisource Portfolio[99.84%], Noodles & [90.05%], Gray Television[89.96%], QuantumScape [80.15%], PaySign [80.13%] Best Consumer Services Stocks This Week:
Vivid Seats[1616.67%], Holley [66.18%], Money[64.55%], Myriad Genetics[55.81%], Grocery Outlet[42.09%], RealReal [33.98%], CompX [30.87%], Willdan [30.08%], comScore [29.36%], Arhaus [27.48%], Gray Television[26.37%] Best Consumer Services Stocks Daily:
CareDx [185.69%], Wingstop [150.46%], National CineMedia[112.46%], VSE [69.41%], Burlington Stores[66.03%], Myriad Genetics[64.88%], Costco Wholesale[58.1%], Daily Journal[57.5%], Texas Roadhouse[55.27%], Royal Caribbean[53.63%], CRA [53.26%]