
 Login Sign Up


| |||||
 |  | ||||

| 12Stocks.com Market Intelligence |
Best Consumer Services Stocks
| In a hurry? Services & Goods Stocks: Performance Trends Table, Stock Charts
Sort Consumer Services: Daily, Weekly, Year-to-Date, Market Cap & Trends. Filter Services & Goods stocks list by size: All Large Mid-Range Small |
| 12Stocks.com Consumer Services Stocks Performances & Trends Daily | |||||||||
|
|  The overall Smart Investing & Trading Score is 90 (0-bearish to 100-bullish) which puts Consumer Services sector in short term bullish trend. The Smart Investing & Trading Score from previous trading session is 50 and hence an improvement of trend.
| ||||||||
Here are the Smart Investing & Trading Scores of the most requested Consumer Services stocks at 12Stocks.com (click stock name for detailed review):
|


| Consider signing up for our daily 12Stocks.com "Best Stocks Newsletter". You will never ever miss a big stock move again! |
| 12Stocks.com: Investing in Consumer Services sector with Stocks | |
|
The following table helps investors and traders sort through current performance and trends (as measured by Smart Investing & Trading Score) of various
stocks in the Consumer Services sector. Quick View: Move mouse or cursor over stock symbol (ticker) to view short-term Technical chart and over stock name to view long term chart. Click on  to add stock symbol to your watchlist and to add stock symbol to your watchlist and  to view watchlist. Click on any ticker or stock name for detailed market intelligence report for that stock. to view watchlist. Click on any ticker or stock name for detailed market intelligence report for that stock. |
12Stocks.com Performance of Stocks in Consumer Services Sector
| Ticker | Stock Name | Watchlist | Category | Recent Price | Smart Investing & Trading Score | Change % | YTD Change% |
| WTW | Weight Watchers |   | Services | 330.00 | 80 | 0.00% | 5.96% |
| PDD | Pinduoduo | | Retail | 116.43 | 80 | -4.89% | 20.04% |
| SVV | Savers Value | | Specialty Retail | 11.27 | 73 | 3.22% | 9.95% |
| COST | Costco Wholesale | | Retail | 991.25 | 70 | 58.10% | 8.59% |
| CRAI | CRA | | Services | 190.35 | 70 | 53.26% | 2.48% |
| LPX | Louisiana-Pacific | | Wholesale | 95.60 | 70 | 52.20% | -7.14% |
| OSW | OneSpaWorld | | Casinos | 22.04 | 70 | 27.65% | 11.01% |
| LQDT | Liquidity Services | | Retail | 24.99 | 70 | 22.37% | -22.61% |
| ADT | ADT | | Security | 8.51 | 70 | 18.70% | 24.06% |
| EVGO | EVgo | | Specialty Retail | 3.76 | 70 | 11.52% | -7.16% |
| SFIX | Stitch Fix | | Retail | 4.84 | 70 | 8.51% | 12.30% |
| CCL | Carnival | | Casinos | 29.64 | 70 | 8.14% | 18.94% |
| SSP | E.W. Scripps | | Broadcasting | 3.16 | 70 | 6.93% | 42.99% |
| ABG | Asbury Automotive | | Automobile | 234.10 | 70 | 4.90% | -3.67% |
| TSQ | Townsquare Media | | Broadcasting | 7.02 | 70 | 4.89% | -17.05% |
| NATH | Nathan s | | Restaurants | 102.13 | 70 | 4.71% | 31.18% |
| DBI | Designer Brands | | Apparel | 3.02 | 70 | 4.60% | -42.72% |
| ARW | Arrow Electronics | | Retail | 123.40 | 70 | 4.45% | 9.09% |
| SAH | Sonic Automotive | | Automobile | 78.50 | 70 | 4.40% | 25.22% |
| CSV | Carriage Services | | Services | 48.29 | 70 | 3.86% | 22.16% |
| WCC | WESCO | | Equipment | 211.27 | 70 | 3.10% | 17.39% |
| BOOT | Boot Barn | | Apparel | 172.90 | 70 | 3.00% | 13.88% |
| TITN | Titan Machinery | | Equipment | 19.53 | 70 | 2.82% | 38.22% |
| IAS | Integral Ad | | Advertising | 8.89 | 70 | 2.73% | -14.85% |
| ATGE | Adtalem Global | | Education | 126.99 | 70 | 2.70% | 39.78% |
| For chart view version of above stock list: Chart View ➞ 0 - 25 , 25 - 50 , 50 - 75 , 75 - 100 , 100 - 125 , 125 - 150 , 150 - 175 , 175 - 200 , 200 - 225 , 225 - 250 , 250 - 275 , 275 - 300 , 300 - 325 , 325 - 350 , 350 - 375 | ||
 | Click To Change The Sort Order: By Market Cap or Company Size Performance: Year-to-date, Week and Day |  |
|
Get the most comprehensive stock market coverage daily at 12Stocks.com ➞ Best Stocks Today ➞ Best Stocks Weekly ➞ Best Stocks Year-to-Date ➞ Best Stocks Trends ➞  Best Stocks Today 12Stocks.com Best Nasdaq Stocks ➞ Best S&P 500 Stocks ➞ Best Tech Stocks ➞ Best Biotech Stocks ➞ |
| Detailed Overview of Consumer Services Stocks |
| Consumer Services Technical Overview, Leaders & Laggards, Top Consumer Services ETF Funds & Detailed Consumer Services Stocks List, Charts, Trends & More |
| Consumer Services Sector: Technical Analysis, Trends & YTD Performance | |
| Consumer Services sector is composed of stocks
from retail, entertainment, media/publishing, consumer goods
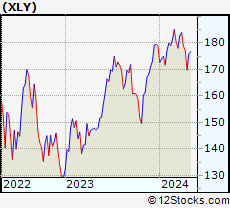
and services subsectors. Consumer Services sector, as represented by XLY, an exchange-traded fund [ETF] that holds basket of Consumer Services stocks (e.g, Walmart, Alibaba) is up by 1.56% and is currently underperforming the overall market by -8.24% year-to-date. Below is a quick view of Technical charts and trends: |
|
 XLY Weekly Chart |
|
| Long Term Trend: Very Good | |
| Medium Term Trend: Very Good | |
 XLY Daily Chart |
|
| Short Term Trend: Very Good | |
| Overall Trend Score: 90 | |
| YTD Performance: 1.56% | |
| **Trend Scores & Views Are Only For Educational Purposes And Not For Investing | |
| 12Stocks.com: Top Performing Consumer Services Sector Stocks | ||||||||||||||||||||||||||||||||||||||||||||||||
 The top performing Consumer Services sector stocks year to date are
Now, more recently, over last week, the top performing Consumer Services sector stocks on the move are


|
||||||||||||||||||||||||||||||||||||||||||||||||
| 12Stocks.com: Investing in Consumer Services Sector using Exchange Traded Funds | |
|
The following table shows list of key exchange traded funds (ETF) that
help investors track Consumer Services Index. For detailed view, check out our ETF Funds section of our website. Quick View: Move mouse or cursor over ETF symbol (ticker) to view short-term Technical chart and over ETF name to view long term chart. Click on ticker or stock name for detailed view. Click on to add stock symbol to your watchlist and to view watchlist. |
12Stocks.com List of ETFs that track Consumer Services Index
| Ticker | ETF Name | Watchlist | Recent Price | Smart Investing & Trading Score | Change % | Week % | Year-to-date % |
| XLY | Consumer Discret Sel | | 226.74 | 90 | 2.01 | 3.58 | 1.56% |
| RTH | Retail | | 245.88 | 90 | 0.63 | 2.04 | 9.67% |
| IYC | Consumer Services | | 101.87 | 90 | 1.68 | 2.71 | 6.29% |
| XRT | Retail | | 83.23 | 90 | 2.54 | 4.59 | 5.13% |
| IYK | Consumer Goods | | 70.15 | 40 | 0.37 | 1.9 | 8.01% |
| UCC | Consumer Services | | 48.63 | 90 | 2.96 | 7 | -5.38% |
| RETL | Retail Bull 3X | | 9.28 | 90 | 26.94 | 13.31 | -5.36% |
| SCC | Short Consumer Services | | 16.35 | 0 | -19.86 | -6.67 | -9.94% |
| UGE | Consumer Goods | | 19.12 | 50 | 1.05 | 5.18 | 6.94% |
| 12Stocks.com: Charts, Trends, Fundamental Data and Performances of Consumer Services Stocks | |
|
We now take in-depth look at all Consumer Services stocks including charts, multi-period performances and overall trends (as measured by Smart Investing & Trading Score). One can sort Consumer Services stocks (click link to choose) by Daily, Weekly and by Year-to-Date performances. Also, one can sort by size of the company or by market capitalization. |
| Select Your Default Chart Type: | |||||
| |||||
| Click on stock symbol or name for detailed view. Click on to add stock symbol to your watchlist and to view watchlist. Quick View: Move mouse or cursor over "Daily" to quickly view daily Technical stock chart and over "Weekly" to view weekly Technical stock chart. | |||||

 | WTW Weight Watchers International, Inc. |
| Sector: Services & Goods | |
| SubSector: Personal Services | |
| MarketCap: 1078.08 Millions | |
| Recent Price: 330.00 Smart Investing & Trading Score: 80 | |
| Day Percent Change: 0% Day Change: 0 | |
| Week Change: 1.69% Year-to-date Change: 6.0% | |
| WTW Links: Profile News Message Board | |
| Charts:- Daily , Weekly | |
| Add WTW to Watchlist: View: Get Complete WTW Trend Analysis ➞ | |
 | PDD Pinduoduo Inc. |
| Sector: Services & Goods | |
| SubSector: Specialty Retail, Other | |
| MarketCap: 41696.2 Millions | |
| Recent Price: 116.43 Smart Investing & Trading Score: 80 | |
| Day Percent Change: -4.89% Day Change: -7.19 | |
| Week Change: 3.38% Year-to-date Change: 20.0% | |
| PDD Links: Profile News Message Board | |
| Charts:- Daily , Weekly | |
| Add PDD to Watchlist: View: Get Complete PDD Trend Analysis ➞ | |
 | SVV Savers Value Village, Inc. |
| Sector: Services & Goods | |
| SubSector: Specialty Retail | |
| MarketCap: 3800 Millions | |
| Recent Price: 11.27 Smart Investing & Trading Score: 73 | |
| Day Percent Change: 3.22% Day Change: 0.31 | |
| Week Change: -0.7% Year-to-date Change: 10.0% | |
| SVV Links: Profile News Message Board | |
| Charts:- Daily , Weekly | |
| Add SVV to Watchlist: View: Get Complete SVV Trend Analysis ➞ | |
 | COST Costco Wholesale Corporation |
| Sector: Services & Goods | |
| SubSector: Discount, Variety Stores | |
| MarketCap: 136355 Millions | |
| Recent Price: 991.25 Smart Investing & Trading Score: 70 | |
| Day Percent Change: 58.1% Day Change: 323.09 | |
| Week Change: 5.05% Year-to-date Change: 8.6% | |
| COST Links: Profile News Message Board | |
| Charts:- Daily , Weekly | |
| Add COST to Watchlist: View: Get Complete COST Trend Analysis ➞ | |
 | CRAI CRA International, Inc. |
| Sector: Services & Goods | |
| SubSector: Management Services | |
| MarketCap: 209.645 Millions | |
| Recent Price: 190.35 Smart Investing & Trading Score: 70 | |
| Day Percent Change: 53.26% Day Change: 56.81 | |
| Week Change: 2.58% Year-to-date Change: 2.5% | |
| CRAI Links: Profile News Message Board | |
| Charts:- Daily , Weekly | |
| Add CRAI to Watchlist: View: Get Complete CRAI Trend Analysis ➞ | |
 | LPX Louisiana-Pacific Corporation |
| Sector: Services & Goods | |
| SubSector: Building Materials Wholesale | |
| MarketCap: 1943.43 Millions | |
| Recent Price: 95.60 Smart Investing & Trading Score: 70 | |
| Day Percent Change: 52.2% Day Change: 33.33 | |
| Week Change: 0.67% Year-to-date Change: -7.1% | |
| LPX Links: Profile News Message Board | |
| Charts:- Daily , Weekly | |
| Add LPX to Watchlist: View: Get Complete LPX Trend Analysis ➞ | |
 | OSW OneSpaWorld Holdings Limited |
| Sector: Services & Goods | |
| SubSector: Resorts & Casinos | |
| MarketCap: 228.394 Millions | |
| Recent Price: 22.04 Smart Investing & Trading Score: 70 | |
| Day Percent Change: 27.65% Day Change: 3.34 | |
| Week Change: -1.78% Year-to-date Change: 11.0% | |
| OSW Links: Profile News Message Board | |
| Charts:- Daily , Weekly | |
| Add OSW to Watchlist: View: Get Complete OSW Trend Analysis ➞ | |
 | LQDT Liquidity Services, Inc. |
| Sector: Services & Goods | |
| SubSector: Catalog & Mail Order Houses | |
| MarketCap: 144.492 Millions | |
| Recent Price: 24.99 Smart Investing & Trading Score: 70 | |
| Day Percent Change: 22.37% Day Change: 4.1 | |
| Week Change: 2.38% Year-to-date Change: -22.6% | |
| LQDT Links: Profile News Message Board | |
| Charts:- Daily , Weekly | |
| Add LQDT to Watchlist: View: Get Complete LQDT Trend Analysis ➞ | |
 | ADT ADT Inc. |
| Sector: Services & Goods | |
| SubSector: Security & Protection Services | |
| MarketCap: 2892.03 Millions | |
| Recent Price: 8.51 Smart Investing & Trading Score: 70 | |
| Day Percent Change: 18.7% Day Change: 1.18 | |
| Week Change: 1.31% Year-to-date Change: 24.1% | |
| ADT Links: Profile News Message Board | |
| Charts:- Daily , Weekly | |
| Add ADT to Watchlist: View: Get Complete ADT Trend Analysis ➞ | |
 | EVGO EVgo, Inc. |
| Sector: Services & Goods | |
| SubSector: Specialty Retail | |
| MarketCap: 1140 Millions | |
| Recent Price: 3.76 Smart Investing & Trading Score: 70 | |
| Day Percent Change: 11.52% Day Change: 0.44 | |
| Week Change: 2.73% Year-to-date Change: -7.2% | |
| EVGO Links: Profile News Message Board | |
| Charts:- Daily , Weekly | |
| Add EVGO to Watchlist: View: Get Complete EVGO Trend Analysis ➞ | |
 | SFIX Stitch Fix, Inc. |
| Sector: Services & Goods | |
| SubSector: Specialty Retail, Other | |
| MarketCap: 1693.64 Millions | |
| Recent Price: 4.84 Smart Investing & Trading Score: 70 | |
| Day Percent Change: 8.51% Day Change: 0.31 | |
| Week Change: 4.76% Year-to-date Change: 12.3% | |
| SFIX Links: Profile News Message Board | |
| Charts:- Daily , Weekly | |
| Add SFIX to Watchlist: View: Get Complete SFIX Trend Analysis ➞ | |
 | CCL Carnival Corporation & Plc |
| Sector: Services & Goods | |
| SubSector: Resorts & Casinos | |
| MarketCap: 11725.4 Millions | |
| Recent Price: 29.64 Smart Investing & Trading Score: 70 | |
| Day Percent Change: 8.14% Day Change: 1.25 | |
| Week Change: 1.23% Year-to-date Change: 18.9% | |
| CCL Links: Profile News Message Board | |
| Charts:- Daily , Weekly | |
| Add CCL to Watchlist: View: Get Complete CCL Trend Analysis ➞ | |
 | SSP The E.W. Scripps Company |
| Sector: Services & Goods | |
| SubSector: Broadcasting - TV | |
| MarketCap: 766.163 Millions | |
| Recent Price: 3.16 Smart Investing & Trading Score: 70 | |
| Day Percent Change: 6.93% Day Change: 0.14 | |
| Week Change: 5.33% Year-to-date Change: 43.0% | |
| SSP Links: Profile News Message Board | |
| Charts:- Daily , Weekly | |
| Add SSP to Watchlist: View: Get Complete SSP Trend Analysis ➞ | |
 | ABG Asbury Automotive Group, Inc. |
| Sector: Services & Goods | |
| SubSector: Auto Dealerships | |
| MarketCap: 1203.21 Millions | |
| Recent Price: 234.10 Smart Investing & Trading Score: 70 | |
| Day Percent Change: 4.9% Day Change: 11.28 | |
| Week Change: 2.16% Year-to-date Change: -3.7% | |
| ABG Links: Profile News Message Board | |
| Charts:- Daily , Weekly | |
| Add ABG to Watchlist: View: Get Complete ABG Trend Analysis ➞ | |
 | TSQ Townsquare Media, Inc. |
| Sector: Services & Goods | |
| SubSector: Broadcasting - Radio | |
| MarketCap: 101.795 Millions | |
| Recent Price: 7.02 Smart Investing & Trading Score: 70 | |
| Day Percent Change: 4.89% Day Change: 0.51 | |
| Week Change: 1.45% Year-to-date Change: -17.1% | |
| TSQ Links: Profile News Message Board | |
| Charts:- Daily , Weekly | |
| Add TSQ to Watchlist: View: Get Complete TSQ Trend Analysis ➞ | |
 | NATH Nathan s Famous, Inc. |
| Sector: Services & Goods | |
| SubSector: Restaurants | |
| MarketCap: 211.77 Millions | |
| Recent Price: 102.13 Smart Investing & Trading Score: 70 | |
| Day Percent Change: 4.71% Day Change: 3.53 | |
| Week Change: 3.78% Year-to-date Change: 31.2% | |
| NATH Links: Profile News Message Board | |
| Charts:- Daily , Weekly | |
| Add NATH to Watchlist: View: Get Complete NATH Trend Analysis ➞ | |
 | DBI Designer Brands Inc. |
| Sector: Services & Goods | |
| SubSector: Apparel Stores | |
| MarketCap: 467.308 Millions | |
| Recent Price: 3.02 Smart Investing & Trading Score: 70 | |
| Day Percent Change: 4.6% Day Change: 0.36 | |
| Week Change: 5.96% Year-to-date Change: -42.7% | |
| DBI Links: Profile News Message Board | |
| Charts:- Daily , Weekly | |
| Add DBI to Watchlist: View: Get Complete DBI Trend Analysis ➞ | |
 | ARW Arrow Electronics, Inc. |
| Sector: Services & Goods | |
| SubSector: Electronics Wholesale | |
| MarketCap: 4155.03 Millions | |
| Recent Price: 123.40 Smart Investing & Trading Score: 70 | |
| Day Percent Change: 4.45% Day Change: 5.67 | |
| Week Change: 4.87% Year-to-date Change: 9.1% | |
| ARW Links: Profile News Message Board | |
| Charts:- Daily , Weekly | |
| Add ARW to Watchlist: View: Get Complete ARW Trend Analysis ➞ | |
 | SAH Sonic Automotive, Inc. |
| Sector: Services & Goods | |
| SubSector: Auto Dealerships | |
| MarketCap: 581.321 Millions | |
| Recent Price: 78.50 Smart Investing & Trading Score: 70 | |
| Day Percent Change: 4.4% Day Change: 2.64 | |
| Week Change: 8.2% Year-to-date Change: 25.2% | |
| SAH Links: Profile News Message Board | |
| Charts:- Daily , Weekly | |
| Add SAH to Watchlist: View: Get Complete SAH Trend Analysis ➞ | |
 | CSV Carriage Services, Inc. |
| Sector: Services & Goods | |
| SubSector: Personal Services | |
| MarketCap: 304.725 Millions | |
| Recent Price: 48.29 Smart Investing & Trading Score: 70 | |
| Day Percent Change: 3.86% Day Change: 1.2 | |
| Week Change: 6.11% Year-to-date Change: 22.2% | |
| CSV Links: Profile News Message Board | |
| Charts:- Daily , Weekly | |
| Add CSV to Watchlist: View: Get Complete CSV Trend Analysis ➞ | |
 | WCC WESCO International, Inc. |
| Sector: Services & Goods | |
| SubSector: Industrial Equipment Wholesale | |
| MarketCap: 824.358 Millions | |
| Recent Price: 211.27 Smart Investing & Trading Score: 70 | |
| Day Percent Change: 3.1% Day Change: 4.96 | |
| Week Change: 2.19% Year-to-date Change: 17.4% | |
| WCC Links: Profile News Message Board | |
| Charts:- Daily , Weekly | |
| Add WCC to Watchlist: View: Get Complete WCC Trend Analysis ➞ | |
 | BOOT Boot Barn Holdings, Inc. |
| Sector: Services & Goods | |
| SubSector: Apparel Stores | |
| MarketCap: 360.608 Millions | |
| Recent Price: 172.90 Smart Investing & Trading Score: 70 | |
| Day Percent Change: 3% Day Change: 4.15 | |
| Week Change: 3.5% Year-to-date Change: 13.9% | |
| BOOT Links: Profile News Message Board | |
| Charts:- Daily , Weekly | |
| Add BOOT to Watchlist: View: Get Complete BOOT Trend Analysis ➞ | |
 | TITN Titan Machinery Inc. |
| Sector: Services & Goods | |
| SubSector: Industrial Equipment Wholesale | |
| MarketCap: 208.958 Millions | |
| Recent Price: 19.53 Smart Investing & Trading Score: 70 | |
| Day Percent Change: 2.82% Day Change: 0.39 | |
| Week Change: 1.45% Year-to-date Change: 38.2% | |
| TITN Links: Profile News Message Board | |
| Charts:- Daily , Weekly | |
| Add TITN to Watchlist: View: Get Complete TITN Trend Analysis ➞ | |
 | IAS Integral Ad Science Holding Corp. |
| Sector: Services & Goods | |
| SubSector: Advertising Agencies | |
| MarketCap: 2760 Millions | |
| Recent Price: 8.89 Smart Investing & Trading Score: 70 | |
| Day Percent Change: 2.73% Day Change: 0.31 | |
| Week Change: 10.43% Year-to-date Change: -14.9% | |
| IAS Links: Profile News Message Board | |
| Charts:- Daily , Weekly | |
| Add IAS to Watchlist: View: Get Complete IAS Trend Analysis ➞ | |
 | ATGE Adtalem Global Education Inc. |
| Sector: Services & Goods | |
| SubSector: Education & Training Services | |
| MarketCap: 1273.86 Millions | |
| Recent Price: 126.99 Smart Investing & Trading Score: 70 | |
| Day Percent Change: 2.7% Day Change: 1.98 | |
| Week Change: 10.11% Year-to-date Change: 39.8% | |
| ATGE Links: Profile News Message Board | |
| Charts:- Daily , Weekly | |
| Add ATGE to Watchlist: View: Get Complete ATGE Trend Analysis ➞ | |
| For tabular summary view of above stock list: Summary View ➞ 0 - 25 , 25 - 50 , 50 - 75 , 75 - 100 , 100 - 125 , 125 - 150 , 150 - 175 , 175 - 200 , 200 - 225 , 225 - 250 , 250 - 275 , 275 - 300 , 300 - 325 , 325 - 350 , 350 - 375 | ||
| Click To Change The Sort Order: By Market Cap or Company Size Performance: Year-to-date, Week and Day | |
| Select Chart Type: | ||
|
Best Stocks Today 12Stocks.com |
© 2025 12Stocks.com Terms & Conditions Privacy Contact Us
All Information Provided Only For Education And Not To Be Used For Investing or Trading. See Terms & Conditions


One More Thing ... Get Best Stocks Delivered Daily!
Never Ever Miss A Move With Our Top Ten Stocks Lists
Find Best Stocks In Any Market - Bull or Bear Market
Take A Peek At Our Top Ten Stocks Lists: Daily, Weekly, Year-to-Date & Top Trends
Find Best Stocks In Any Market - Bull or Bear Market
Take A Peek At Our Top Ten Stocks Lists: Daily, Weekly, Year-to-Date & Top Trends
Consumer Services Stocks With Best Up Trends [0-bearish to 100-bullish]: VSE [100], eBay [100], Kratos Defense[100], Graham [100], CompX [100], Fastenal [100], Jacobs Engineering[100], Willdan [100], Gray Television[100], Williams-Sonoma [100], Rush Enterprises[100]
Best Consumer Services Stocks Year-to-Date:
ThredUp [640.29%], Vivid Seats[278.19%], Willdan [211.45%], Kratos Defense[162.09%], Roblox [123.87%], National Vision[120.92%], Altisource Portfolio[99.84%], Noodles & [90.05%], Gray Television[89.96%], QuantumScape [80.15%], PaySign [80.13%] Best Consumer Services Stocks This Week:
Vivid Seats[1616.67%], Holley [66.18%], Money[64.55%], Myriad Genetics[55.81%], Grocery Outlet[42.09%], RealReal [33.98%], CompX [30.87%], Willdan [30.08%], comScore [29.36%], Arhaus [27.48%], Gray Television[26.37%] Best Consumer Services Stocks Daily:
CareDx [185.69%], Wingstop [150.46%], National CineMedia[112.46%], VSE [69.41%], Burlington Stores[66.03%], Myriad Genetics[64.88%], Costco Wholesale[58.1%], Daily Journal[57.5%], Texas Roadhouse[55.27%], Royal Caribbean[53.63%], CRA [53.26%]