
 Login Sign Up


| |||||
 |  | ||||

| 12Stocks.com Market Intelligence |
Best SmallCap Stocks
|
| In a hurry? Small Cap Stock Lists: Performance Trends Table, Stock Charts
Sort Small Cap stocks: Daily, Weekly, Year-to-Date, Market Cap & Trends. Filter Small Cap stocks list by sector: Show all, Tech, Finance, Energy, Staples, Retail, Industrial, Materials, Utilities and HealthCare Filter Small Cap stocks list by size: All Large Medium Small and MicroCap |
| 12Stocks.com Small Cap Stocks Performances & Trends Daily | |||||||||
|
|  The overall Smart Investing & Trading Score is 14 (0-bearish to 100-bullish) which puts Small Cap index in short term bearish trend. The Smart Investing & Trading Score from previous trading session is 41 and hence a deterioration of trend.
| ||||||||
Here are the Smart Investing & Trading Scores of the most requested small cap stocks at 12Stocks.com (click stock name for detailed review):
|


| 12Stocks.com: Investing in Smallcap Index with Stocks | |
|
The following table helps investors and traders sort through current performance and trends (as measured by Smart Investing & Trading Score) of various
stocks in the Smallcap Index. Quick View: Move mouse or cursor over stock symbol (ticker) to view short-term technical chart and over stock name to view long term chart. Click on  to add stock symbol to your watchlist and to add stock symbol to your watchlist and  to view watchlist. Click on any ticker or stock name for detailed market intelligence report for that stock. to view watchlist. Click on any ticker or stock name for detailed market intelligence report for that stock. |
12Stocks.com Performance of Stocks in Smallcap Index
| Ticker | Stock Name | Watchlist | Category | Recent Price | Smart Investing & Trading Score | Change % | YTD Change% |
| ENVA | Enova |   | Financials | 61.05 | 22 | 0.86 | 10.28% |
| SAFT | Safety Insurance | | Financials | 80.25 | 62 | 0.85 | 5.61% |
| AZZ | AZZ | | Industrials | 72.24 | 38 | 0.85 | 24.36% |
| ATRI | Atrion | | Health Care | 426.88 | 95 | 0.85 | 12.70% |
| CTRE | CareTrust REIT | | Financials | 24.93 | 100 | 0.85 | 11.39% |
| SUM | Summit Materials | | Industrials | 39.23 | 17 | 0.85 | 2.00% |
| CMC | Commercial Metals | | Materials | 54.19 | 45 | 0.84 | 8.29% |
| UNF | UniFirst | | Consumer Staples | 161.47 | 32 | 0.84 | -11.72% |
| TPC | Tutor Perini | | Industrials | 16.77 | 68 | 0.84 | 84.29% |
| LINC | Loln Educational | | Services & Goods | 10.75 | 90 | 0.84 | 7.07% |
| CCS | Century Communities | | Industrials | 79.99 | 32 | 0.84 | -12.23% |
| QLYS | Qualys | | Technology | 165.29 | 25 | 0.84 | -15.79% |
| AXSM | Axsome | | Health Care | 74.89 | 64 | 0.83 | -5.91% |
| CLPT | ClearPoint Neuro | | Health Care | 5.47 | 52 | 0.83 | -19.66% |
| LYTS | LSI Industries | | Industrials | 14.72 | 48 | 0.82 | 4.55% |
| MGEE | MGE Energy | | Utilities | 78.96 | 95 | 0.82 | 9.20% |
| ACT | Enact | | Financials | 29.97 | 73 | 0.82 | 3.06% |
| PRLB | Proto Labs | | Industrials | 30.73 | 17 | 0.82 | -21.12% |
| SMPL | Simply Good | | Consumer Staples | 36.75 | 93 | 0.82 | -7.20% |
| OGS | ONE Gas | | Utilities | 65.05 | 95 | 0.82 | 2.09% |
| LIND | Lindblad Expeditions | | Consumer Staples | 7.40 | 42 | 0.82 | -34.34% |
| IGT | Game | | Services & Goods | 19.90 | 18 | 0.81 | -27.40% |
| LQDT | Liquidity Services | | Services & Goods | 17.40 | 17 | 0.81 | 1.10% |
| NWE | NorthWestern | | Utilities | 50.85 | 100 | 0.81 | -0.08% |
| SATS | EchoStar | | Technology | 16.12 | 83 | 0.81 | -2.72% |


| Too many stocks? View smallcap stocks filtered by marketcap & sector |
| Marketcap: All SmallCap Stocks (default-no microcap), Large, Mid-Range, Small |
| Smallcap Sector: Tech, Finance, Energy, Staples, Retail, Industrial, Materials, & Medical |
|
Get the most comprehensive stock market coverage daily at 12Stocks.com ➞ Best Stocks Today ➞ Best Stocks Weekly ➞ Best Stocks Year-to-Date ➞ Best Stocks Trends ➞  Best Stocks Today 12Stocks.com Best Nasdaq Stocks ➞ Best S&P 500 Stocks ➞ Best Tech Stocks ➞ Best Biotech Stocks ➞ |
| Detailed Overview of SmallCap Stocks |
| SmallCap Technical Overview, Leaders & Laggards, Top SmallCap ETF Funds & Detailed SmallCap Stocks List, Charts, Trends & More |
| Smallcap: Technical Analysis, Trends & YTD Performance | |
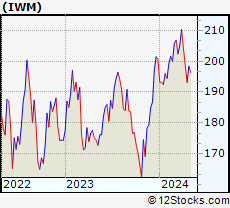
| SmallCap segment as represented by
IWM, an exchange-traded fund [ETF], holds basket of thousands of smallcap stocks from across all major sectors of the US stock market. The smallcap index (contains stocks like Riverbed & Sotheby's) is down by -2.19% and is currently underperforming the overall market by -6.73% year-to-date. Below is a quick view of technical charts and trends: | |
 IWM Weekly Chart |
|
| Long Term Trend: Not Good | |
| Medium Term Trend: Not Good | |
 IWM Daily Chart |
|
| Short Term Trend: Not Good | |
| Overall Trend Score: 14 | |
| YTD Performance: -2.19% | |
| **Trend Scores & Views Are Only For Educational Purposes And Not For Investing | |
| 12Stocks.com: Top Performing Small Cap Index Stocks | ||||||||||||||||||||||||||||||||||||||||||||||||
 The top performing Small Cap Index stocks year to date are
Now, more recently, over last week, the top performing Small Cap Index stocks on the move are


|
||||||||||||||||||||||||||||||||||||||||||||||||
| 12Stocks.com: Investing in Smallcap Index using Exchange Traded Funds | |
|
The following table shows list of key exchange traded funds (ETF) that
help investors track Smallcap index. The following list also includes leveraged ETF funds that track twice or thrice the daily returns of Smallcap indices. Short or inverse ETF funds move in the opposite direction to the index they track and are useful during market pullbacks or during bear markets. Quick View: Move mouse or cursor over ETF symbol (ticker) to view short-term technical chart and over ETF name to view long term chart. Click on ticker or stock name for detailed view. Click on to add stock symbol to your watchlist and to view watchlist. |
12Stocks.com List of ETFs that track Smallcap Index
| Ticker | ETF Name | Watchlist | Recent Price | Smart Investing & Trading Score | Change % | Week % | Year-to-date % |
| IWM | iShares Russell 2000 | | 196.31 | 14 | 0.21 | -1.05 | -2.19% |
| IJR | iShares Core S&P Small-Cap | | 104.74 | 22 | 0.34 | -0.86 | -3.24% |
| VTWO | Vanguard Russell 2000 ETF | | 79.36 | 14 | 0.25 | -1.07 | -2.15% |
| IWN | iShares Russell 2000 Value | | 149.82 | 22 | 0.52 | -0.87 | -3.55% |
| IJS | iShares S&P Small-Cap 600 Value | | 96.40 | 15 | 0.33 | -0.81 | -6.47% |
| IWO | iShares Russell 2000 Growth | | 249.58 | 7 | -0.30 | -1.39 | -1.05% |
| IJT | iShares S&P Small-Cap 600 Growth | | 124.94 | 15 | 0.27 | -0.91 | -0.16% |
| XSLV | PowerShares S&P SmallCap Low Volatil ETF | | 42.94 | 52 | 0.93 | 0.5 | -2.75% |
| SDD | ProShares UltraShort SmallCap600 | | 19.50 | 78 | -0.36 | 0.78 | 5.83% |
| SMLV | SPDR SSGA US Small Cap Low Volatil ETF | | 107.81 | 40 | 1.45 | 0.27 | -4.19% |
| SBB | ProShares Short SmallCap600 | | 16.50 | 71 | -0.30 | 0.7 | 3.58% |
| SAA | ProShares Ultra SmallCap600 | | 22.53 | 8 | -0.31 | -2.21 | -9.7% |
| 12Stocks.com: Charts, Trends, Fundamental Data and Performances of SmallCap Stocks | |
|
We now take in-depth look at all SmallCap stocks including charts, multi-period performances and overall trends (as measured by Smart Investing & Trading Score). One can sort SmallCap stocks (click link to choose) by Daily, Weekly and by Year-to-Date performances. Also, one can sort by size of the company or by market capitalization. |
| Select Your Default Chart Type: | |||||
| |||||
| Click on stock symbol or name for detailed view. Click on to add stock symbol to your watchlist and to view watchlist. Quick View: Move mouse or cursor over "Daily" to quickly view daily technical stock chart and over "Weekly" to view weekly technical stock chart. | |||||

 | ENVA Enova International, Inc. |
| Sector: Financials | |
| SubSector: Credit Services | |
| MarketCap: 345.508 Millions | |
| Recent Price: 61.05 Smart Investing & Trading Score: 22 | |
| Day Percent Change: 0.86% Day Change: 0.52 | |
| Week Change: -3.45% Year-to-date Change: 10.3% | |
| ENVA Links: Profile News Message Board | |
| Charts:- Daily , Weekly | |
| Add ENVA to Watchlist: View: Get Complete ENVA Trend Analysis ➞ | |
 | SAFT Safety Insurance Group, Inc. |
| Sector: Financials | |
| SubSector: Property & Casualty Insurance | |
| MarketCap: 1145.12 Millions | |
| Recent Price: 80.25 Smart Investing & Trading Score: 62 | |
| Day Percent Change: 0.85% Day Change: 0.68 | |
| Week Change: 1.81% Year-to-date Change: 5.6% | |
| SAFT Links: Profile News Message Board | |
| Charts:- Daily , Weekly | |
| Add SAFT to Watchlist: View: Get Complete SAFT Trend Analysis ➞ | |
 | AZZ AZZ Inc. |
| Sector: Industrials | |
| SubSector: Diversified Machinery | |
| MarketCap: 743.416 Millions | |
| Recent Price: 72.24 Smart Investing & Trading Score: 38 | |
| Day Percent Change: 0.85% Day Change: 0.61 | |
| Week Change: 1.05% Year-to-date Change: 24.4% | |
| AZZ Links: Profile News Message Board | |
| Charts:- Daily , Weekly | |
| Add AZZ to Watchlist: View: Get Complete AZZ Trend Analysis ➞ | |
 | ATRI Atrion Corporation |
| Sector: Health Care | |
| SubSector: Medical Instruments & Supplies | |
| MarketCap: 1234.6 Millions | |
| Recent Price: 426.88 Smart Investing & Trading Score: 95 | |
| Day Percent Change: 0.85% Day Change: 3.59 | |
| Week Change: 8.07% Year-to-date Change: 12.7% | |
| ATRI Links: Profile News Message Board | |
| Charts:- Daily , Weekly | |
| Add ATRI to Watchlist: View: Get Complete ATRI Trend Analysis ➞ | |
 | CTRE CareTrust REIT, Inc. |
| Sector: Financials | |
| SubSector: REIT - Healthcare Facilities | |
| MarketCap: 1507.94 Millions | |
| Recent Price: 24.93 Smart Investing & Trading Score: 100 | |
| Day Percent Change: 0.85% Day Change: 0.21 | |
| Week Change: 2.55% Year-to-date Change: 11.4% | |
| CTRE Links: Profile News Message Board | |
| Charts:- Daily , Weekly | |
| Add CTRE to Watchlist: View: Get Complete CTRE Trend Analysis ➞ | |
 | SUM Summit Materials, Inc. |
| Sector: Industrials | |
| SubSector: General Building Materials | |
| MarketCap: 1138.23 Millions | |
| Recent Price: 39.23 Smart Investing & Trading Score: 17 | |
| Day Percent Change: 0.85% Day Change: 0.33 | |
| Week Change: -1.92% Year-to-date Change: 2.0% | |
| SUM Links: Profile News Message Board | |
| Charts:- Daily , Weekly | |
| Add SUM to Watchlist: View: Get Complete SUM Trend Analysis ➞ | |
 | CMC Commercial Metals Company |
| Sector: Materials | |
| SubSector: Steel & Iron | |
| MarketCap: 1724.78 Millions | |
| Recent Price: 54.19 Smart Investing & Trading Score: 45 | |
| Day Percent Change: 0.84% Day Change: 0.45 | |
| Week Change: 1.33% Year-to-date Change: 8.3% | |
| CMC Links: Profile News Message Board | |
| Charts:- Daily , Weekly | |
| Add CMC to Watchlist: View: Get Complete CMC Trend Analysis ➞ | |
 | UNF UniFirst Corporation |
| Sector: Consumer Staples | |
| SubSector: Textile - Apparel Clothing | |
| MarketCap: 2605.65 Millions | |
| Recent Price: 161.47 Smart Investing & Trading Score: 32 | |
| Day Percent Change: 0.84% Day Change: 1.34 | |
| Week Change: -1.69% Year-to-date Change: -11.7% | |
| UNF Links: Profile News Message Board | |
| Charts:- Daily , Weekly | |
| Add UNF to Watchlist: View: Get Complete UNF Trend Analysis ➞ | |
 | TPC Tutor Perini Corporation |
| Sector: Industrials | |
| SubSector: Heavy Construction | |
| MarketCap: 382.595 Millions | |
| Recent Price: 16.77 Smart Investing & Trading Score: 68 | |
| Day Percent Change: 0.84% Day Change: 0.14 | |
| Week Change: -5.68% Year-to-date Change: 84.3% | |
| TPC Links: Profile News Message Board | |
| Charts:- Daily , Weekly | |
| Add TPC to Watchlist: View: Get Complete TPC Trend Analysis ➞ | |
 | LINC Lincoln Educational Services Corporation |
| Sector: Services & Goods | |
| SubSector: Education & Training Services | |
| MarketCap: 59.5006 Millions | |
| Recent Price: 10.75 Smart Investing & Trading Score: 90 | |
| Day Percent Change: 0.84% Day Change: 0.09 | |
| Week Change: 6.33% Year-to-date Change: 7.1% | |
| LINC Links: Profile News Message Board | |
| Charts:- Daily , Weekly | |
| Add LINC to Watchlist: View: Get Complete LINC Trend Analysis ➞ | |
 | CCS Century Communities, Inc. |
| Sector: Industrials | |
| SubSector: Residential Construction | |
| MarketCap: 459.206 Millions | |
| Recent Price: 79.99 Smart Investing & Trading Score: 32 | |
| Day Percent Change: 0.84% Day Change: 0.67 | |
| Week Change: 1.48% Year-to-date Change: -12.2% | |
| CCS Links: Profile News Message Board | |
| Charts:- Daily , Weekly | |
| Add CCS to Watchlist: View: Get Complete CCS Trend Analysis ➞ | |
 | QLYS Qualys, Inc. |
| Sector: Technology | |
| SubSector: Application Software | |
| MarketCap: 3475.02 Millions | |
| Recent Price: 165.29 Smart Investing & Trading Score: 25 | |
| Day Percent Change: 0.84% Day Change: 1.38 | |
| Week Change: -2.98% Year-to-date Change: -15.8% | |
| QLYS Links: Profile News Message Board | |
| Charts:- Daily , Weekly | |
| Add QLYS to Watchlist: View: Get Complete QLYS Trend Analysis ➞ | |
 | AXSM Axsome Therapeutics, Inc. |
| Sector: Health Care | |
| SubSector: Biotechnology | |
| MarketCap: 2284.25 Millions | |
| Recent Price: 74.89 Smart Investing & Trading Score: 64 | |
| Day Percent Change: 0.83% Day Change: 0.62 | |
| Week Change: 4.43% Year-to-date Change: -5.9% | |
| AXSM Links: Profile News Message Board | |
| Charts:- Daily , Weekly | |
| Add AXSM to Watchlist: View: Get Complete AXSM Trend Analysis ➞ | |
 | CLPT ClearPoint Neuro, Inc. |
| Sector: Health Care | |
| SubSector: Medical Appliances & Equipment | |
| MarketCap: 55.108 Millions | |
| Recent Price: 5.47 Smart Investing & Trading Score: 52 | |
| Day Percent Change: 0.83% Day Change: 0.04 | |
| Week Change: 4.09% Year-to-date Change: -19.7% | |
| CLPT Links: Profile News Message Board | |
| Charts:- Daily , Weekly | |
| Add CLPT to Watchlist: View: Get Complete CLPT Trend Analysis ➞ | |
 | LYTS LSI Industries Inc. |
| Sector: Industrials | |
| SubSector: Industrial Electrical Equipment | |
| MarketCap: 85.7879 Millions | |
| Recent Price: 14.72 Smart Investing & Trading Score: 48 | |
| Day Percent Change: 0.82% Day Change: 0.12 | |
| Week Change: -0.34% Year-to-date Change: 4.6% | |
| LYTS Links: Profile News Message Board | |
| Charts:- Daily , Weekly | |
| Add LYTS to Watchlist: View: Get Complete LYTS Trend Analysis ➞ | |
 | MGEE MGE Energy, Inc. |
| Sector: Utilities | |
| SubSector: Diversified Utilities | |
| MarketCap: 2608.3 Millions | |
| Recent Price: 78.96 Smart Investing & Trading Score: 95 | |
| Day Percent Change: 0.82% Day Change: 0.64 | |
| Week Change: 1.75% Year-to-date Change: 9.2% | |
| MGEE Links: Profile News Message Board | |
| Charts:- Daily , Weekly | |
| Add MGEE to Watchlist: View: Get Complete MGEE Trend Analysis ➞ | |
 | ACT Enact Holdings, Inc. |
| Sector: Financials | |
| SubSector: Insurance - Specialty | |
| MarketCap: 4010 Millions | |
| Recent Price: 29.97 Smart Investing & Trading Score: 73 | |
| Day Percent Change: 0.82% Day Change: 0.24 | |
| Week Change: 0.1% Year-to-date Change: 3.1% | |
| ACT Links: Profile News Message Board | |
| Charts:- Daily , Weekly | |
| Add ACT to Watchlist: View: Get Complete ACT Trend Analysis ➞ | |
 | PRLB Proto Labs, Inc. |
| Sector: Industrials | |
| SubSector: Machine Tools & Accessories | |
| MarketCap: 1944.78 Millions | |
| Recent Price: 30.73 Smart Investing & Trading Score: 17 | |
| Day Percent Change: 0.82% Day Change: 0.25 | |
| Week Change: -2.04% Year-to-date Change: -21.1% | |
| PRLB Links: Profile News Message Board | |
| Charts:- Daily , Weekly | |
| Add PRLB to Watchlist: View: Get Complete PRLB Trend Analysis ➞ | |
 | SMPL The Simply Good Foods Company |
| Sector: Consumer Staples | |
| SubSector: Food - Major Diversified | |
| MarketCap: 1501.63 Millions | |
| Recent Price: 36.75 Smart Investing & Trading Score: 93 | |
| Day Percent Change: 0.82% Day Change: 0.30 | |
| Week Change: 6.83% Year-to-date Change: -7.2% | |
| SMPL Links: Profile News Message Board | |
| Charts:- Daily , Weekly | |
| Add SMPL to Watchlist: View: Get Complete SMPL Trend Analysis ➞ | |
 | OGS ONE Gas, Inc. |
| Sector: Utilities | |
| SubSector: Gas Utilities | |
| MarketCap: 4051.17 Millions | |
| Recent Price: 65.05 Smart Investing & Trading Score: 95 | |
| Day Percent Change: 0.82% Day Change: 0.53 | |
| Week Change: 1.72% Year-to-date Change: 2.1% | |
| OGS Links: Profile News Message Board | |
| Charts:- Daily , Weekly | |
| Add OGS to Watchlist: View: Get Complete OGS Trend Analysis ➞ | |
 | LIND Lindblad Expeditions Holdings, Inc. |
| Sector: Consumer Staples | |
| SubSector: Recreational Goods, Other | |
| MarketCap: 220.259 Millions | |
| Recent Price: 7.40 Smart Investing & Trading Score: 42 | |
| Day Percent Change: 0.82% Day Change: 0.06 | |
| Week Change: 1.51% Year-to-date Change: -34.3% | |
| LIND Links: Profile News Message Board | |
| Charts:- Daily , Weekly | |
| Add LIND to Watchlist: View: Get Complete LIND Trend Analysis ➞ | |
 | IGT International Game Technology PLC |
| Sector: Services & Goods | |
| SubSector: Gaming Activities | |
| MarketCap: 1030.89 Millions | |
| Recent Price: 19.90 Smart Investing & Trading Score: 18 | |
| Day Percent Change: 0.81% Day Change: 0.16 | |
| Week Change: -1.97% Year-to-date Change: -27.4% | |
| IGT Links: Profile News Message Board | |
| Charts:- Daily , Weekly | |
| Add IGT to Watchlist: View: Get Complete IGT Trend Analysis ➞ | |
 | LQDT Liquidity Services, Inc. |
| Sector: Services & Goods | |
| SubSector: Catalog & Mail Order Houses | |
| MarketCap: 144.492 Millions | |
| Recent Price: 17.40 Smart Investing & Trading Score: 17 | |
| Day Percent Change: 0.81% Day Change: 0.14 | |
| Week Change: -0.11% Year-to-date Change: 1.1% | |
| LQDT Links: Profile News Message Board | |
| Charts:- Daily , Weekly | |
| Add LQDT to Watchlist: View: Get Complete LQDT Trend Analysis ➞ | |
 | NWE NorthWestern Corporation |
| Sector: Utilities | |
| SubSector: Diversified Utilities | |
| MarketCap: 2801.8 Millions | |
| Recent Price: 50.85 Smart Investing & Trading Score: 100 | |
| Day Percent Change: 0.81% Day Change: 0.41 | |
| Week Change: 2.62% Year-to-date Change: -0.1% | |
| NWE Links: Profile News Message Board | |
| Charts:- Daily , Weekly | |
| Add NWE to Watchlist: View: Get Complete NWE Trend Analysis ➞ | |
 | SATS EchoStar Corporation |
| Sector: Technology | |
| SubSector: Communication Equipment | |
| MarketCap: 3175.69 Millions | |
| Recent Price: 16.12 Smart Investing & Trading Score: 83 | |
| Day Percent Change: 0.81% Day Change: 0.13 | |
| Week Change: 0.75% Year-to-date Change: -2.7% | |
| SATS Links: Profile News Message Board | |
| Charts:- Daily , Weekly | |
| Add SATS to Watchlist: View: Get Complete SATS Trend Analysis ➞ | |
| Too many stocks? View smallcap stocks filtered by marketcap & sector |
| Marketcap: All SmallCap Stocks (default-no microcap), Large, Mid-Range, Small & MicroCap |
| Sector: Tech, Finance, Energy, Staples, Retail, Industrial, Materials, Utilities & Medical |
|
Best Stocks Today 12Stocks.com |
© 2024 12Stocks.com Terms & Conditions Privacy Contact Us
All Information Provided Only For Education And Not To Be Used For Investing or Trading. See Terms & Conditions


One More Thing ... Get Best Stocks Delivered Daily!
Never Ever Miss A Move With Our Top Ten Stocks Lists
Find Best Stocks In Any Market - Bull or Bear Market
Take A Peek At Our Top Ten Stocks Lists: Daily, Weekly, Year-to-Date & Top Trends
Find Best Stocks In Any Market - Bull or Bear Market
Take A Peek At Our Top Ten Stocks Lists: Daily, Weekly, Year-to-Date & Top Trends
Smallcap Stocks With Best Up Trends [0-bearish to 100-bullish]: Surmodics [100], Rocky Brands[100], TransMedics Group[100], LendingClub [100], Summit [100], A10 s[100], Carpenter [100], UFP [100], PROCEPT BioRobotics[100], Xencor [100], Trinity Industries[100]
Best Smallcap Stocks Year-to-Date:
Janux [441.55%], Viking [310.69%], Longboard [259.25%], Alpine Immune[239.26%], Avidity Biosciences[185.4%], Bakkt [182.96%], Cullinan Oncology[175.33%], Arcutis Bio[173.68%], Vera [173.32%], Super Micro[159.73%], Y-mAbs [141.79%] Best Smallcap Stocks This Week:
Deciphera [73.11%], Eyenovia [44.86%], Cue Biopharma[39.56%], Seres [30.91%], Poseida [30.52%], P3 Health[29.62%], Phibro Animal[28.44%], TransMedics Group[27.72%], Surmodics [27.36%], LendingTree [26.36%], Rocky Brands[24.92%] Best Smallcap Stocks Daily:
Surmodics [29.74%], Rocky Brands[28.41%], TransMedics Group[24.93%], Ventyx Biosciences[24.63%], Eyenovia [21.17%], LendingClub [19.68%], Summit [19.59%], Powell Industries[18.89%], MiMedx Group[18.67%], CareDx [18.30%], A10 s[17.69%]