
 Login Sign Up


| |||||
 |  | ||||

| 12Stocks.com Market Intelligence |
Best SmallCap Stocks
|
| In a hurry? Small Cap Stock Lists: Performance Trends Table, Stock Charts
Sort Small Cap stocks: Daily, Weekly, Year-to-Date, Market Cap & Trends. Filter Small Cap stocks list by sector: Show all, Tech, Finance, Energy, Staples, Retail, Industrial, Materials, Utilities and HealthCare Filter Small Cap stocks list by size: All Large Medium Small and MicroCap |
| 12Stocks.com Small Cap Stocks Performances & Trends Daily | |||||||||
|
|  The overall Smart Investing & Trading Score is 14 (0-bearish to 100-bullish) which puts Small Cap index in short term bearish trend. The Smart Investing & Trading Score from previous trading session is 41 and hence a deterioration of trend.
| ||||||||
Here are the Smart Investing & Trading Scores of the most requested small cap stocks at 12Stocks.com (click stock name for detailed review):
|


| 12Stocks.com: Investing in Smallcap Index with Stocks | |
|
The following table helps investors and traders sort through current performance and trends (as measured by Smart Investing & Trading Score) of various
stocks in the Smallcap Index. Quick View: Move mouse or cursor over stock symbol (ticker) to view short-term technical chart and over stock name to view long term chart. Click on  to add stock symbol to your watchlist and to add stock symbol to your watchlist and  to view watchlist. Click on any ticker or stock name for detailed market intelligence report for that stock. to view watchlist. Click on any ticker or stock name for detailed market intelligence report for that stock. |
12Stocks.com Performance of Stocks in Smallcap Index
| Ticker | Stock Name | Watchlist | Category | Recent Price | Smart Investing & Trading Score | Change % | YTD Change% |
| FELE | Franklin Electric |   | Industrials | 97.60 | 0 | 1.38 | 0.98% |
| CRBU | Caribou Biosciences | | Health Care | 3.68 | 20 | 1.38 | -35.55% |
| FDP | Fresh Del | | Consumer Staples | 25.92 | 100 | 1.37 | -1.26% |
| TNET | TriNet Group | | Services & Goods | 101.75 | 10 | 1.37 | -14.45% |
| RDVT | Red Violet | | Technology | 17.01 | 25 | 1.37 | -14.82% |
| IBEX | IBEX | | Technology | 13.28 | 45 | 1.37 | -30.03% |
| KBH | KB Home | | Industrials | 65.64 | 57 | 1.36 | 5.09% |
| TWI | Titan | | Industrials | 11.17 | 10 | 1.36 | -24.93% |
| SSTI | ShotSpotter | | Technology | 13.54 | 37 | 1.35 | -46.99% |
| LPSN | LivePerson | | Technology | 0.51 | 27 | 1.34 | -86.61% |
| OMCL | Omnicell | | Technology | 27.17 | 49 | 1.34 | -27.80% |
| BATRK | Liberty Braves | | Services & Goods | 37.93 | 35 | 1.34 | -4.17% |
| VIGL | Vigil Neuroscience | | Health Care | 2.65 | 20 | 1.34 | -22.89% |
| CDE | Coeur Mining | | Materials | 4.58 | 50 | 1.33 | 40.49% |
| NSP | Insperity | | Services & Goods | 104.30 | 54 | 1.33 | -11.02% |
| UEC | Uranium Energy | | Materials | 6.84 | 60 | 1.33 | 6.88% |
| EBTC | Enterprise Bancorp | | Financials | 24.62 | 49 | 1.32 | -23.68% |
| CNS | Cohen & Steers | | Financials | 69.68 | 25 | 1.31 | -7.99% |
| SEMR | Semrush | | Technology | 12.40 | 70 | 1.31 | -10.73% |
| PHR | Phreesia | | Technology | 21.01 | 42 | 1.30 | -9.24% |
| IDYA | IDEAYA Biosciences | | Health Care | 41.18 | 49 | 1.30 | 15.74% |
| CMPO | CompoSecure | | Industrials | 7.02 | 83 | 1.30 | 28.34% |
| EVER | EverQuote | | Financials | 20.43 | 90 | 1.29 | 66.91% |
| PIPR | Piper Sandler | | Financials | 198.31 | 81 | 1.29 | 13.40% |
| BKH | Black Hills | | Utilities | 55.60 | 100 | 1.28 | 3.06% |


| Too many stocks? View smallcap stocks filtered by marketcap & sector |
| Marketcap: All SmallCap Stocks (default-no microcap), Large, Mid-Range, Small |
| Smallcap Sector: Tech, Finance, Energy, Staples, Retail, Industrial, Materials, & Medical |
|
Get the most comprehensive stock market coverage daily at 12Stocks.com ➞ Best Stocks Today ➞ Best Stocks Weekly ➞ Best Stocks Year-to-Date ➞ Best Stocks Trends ➞  Best Stocks Today 12Stocks.com Best Nasdaq Stocks ➞ Best S&P 500 Stocks ➞ Best Tech Stocks ➞ Best Biotech Stocks ➞ |
| Detailed Overview of SmallCap Stocks |
| SmallCap Technical Overview, Leaders & Laggards, Top SmallCap ETF Funds & Detailed SmallCap Stocks List, Charts, Trends & More |
| Smallcap: Technical Analysis, Trends & YTD Performance | |
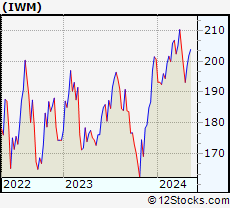
| SmallCap segment as represented by
IWM, an exchange-traded fund [ETF], holds basket of thousands of smallcap stocks from across all major sectors of the US stock market. The smallcap index (contains stocks like Riverbed & Sotheby's) is down by -2.19% and is currently underperforming the overall market by -6.73% year-to-date. Below is a quick view of technical charts and trends: | |
 IWM Weekly Chart |
|
| Long Term Trend: Not Good | |
| Medium Term Trend: Not Good | |
 IWM Daily Chart |
|
| Short Term Trend: Not Good | |
| Overall Trend Score: 14 | |
| YTD Performance: -2.19% | |
| **Trend Scores & Views Are Only For Educational Purposes And Not For Investing | |
| 12Stocks.com: Top Performing Small Cap Index Stocks | ||||||||||||||||||||||||||||||||||||||||||||||||
 The top performing Small Cap Index stocks year to date are
Now, more recently, over last week, the top performing Small Cap Index stocks on the move are


|
||||||||||||||||||||||||||||||||||||||||||||||||
| 12Stocks.com: Investing in Smallcap Index using Exchange Traded Funds | |
|
The following table shows list of key exchange traded funds (ETF) that
help investors track Smallcap index. The following list also includes leveraged ETF funds that track twice or thrice the daily returns of Smallcap indices. Short or inverse ETF funds move in the opposite direction to the index they track and are useful during market pullbacks or during bear markets. Quick View: Move mouse or cursor over ETF symbol (ticker) to view short-term technical chart and over ETF name to view long term chart. Click on ticker or stock name for detailed view. Click on to add stock symbol to your watchlist and to view watchlist. |
12Stocks.com List of ETFs that track Smallcap Index
| Ticker | ETF Name | Watchlist | Recent Price | Smart Investing & Trading Score | Change % | Week % | Year-to-date % |
| IWM | iShares Russell 2000 | | 196.31 | 14 | 0.21 | -1.05 | -2.19% |
| IJR | iShares Core S&P Small-Cap | | 104.74 | 22 | 0.34 | -0.86 | -3.24% |
| VTWO | Vanguard Russell 2000 ETF | | 79.36 | 14 | 0.25 | -1.07 | -2.15% |
| IWN | iShares Russell 2000 Value | | 149.82 | 22 | 0.52 | -0.87 | -3.55% |
| IJS | iShares S&P Small-Cap 600 Value | | 96.40 | 15 | 0.33 | -0.81 | -6.47% |
| IWO | iShares Russell 2000 Growth | | 249.58 | 7 | -0.30 | -1.39 | -1.05% |
| IJT | iShares S&P Small-Cap 600 Growth | | 124.94 | 15 | 0.27 | -0.91 | -0.16% |
| XSLV | PowerShares S&P SmallCap Low Volatil ETF | | 42.83 | 52 | 0.68 | 0.26 | -2.99% |
| SDD | ProShares UltraShort SmallCap600 | | 19.71 | 78 | 0.70 | 1.85 | 6.95% |
| SMLV | SPDR SSGA US Small Cap Low Volatil ETF | | 107.44 | 40 | 1.11 | -0.07 | -4.51% |
| SBB | ProShares Short SmallCap600 | | 16.56 | 71 | 0.05 | 1.06 | 3.94% |
| SAA | ProShares Ultra SmallCap600 | | 22.58 | 8 | -0.08 | -1.99 | -9.49% |
| 12Stocks.com: Charts, Trends, Fundamental Data and Performances of SmallCap Stocks | |
|
We now take in-depth look at all SmallCap stocks including charts, multi-period performances and overall trends (as measured by Smart Investing & Trading Score). One can sort SmallCap stocks (click link to choose) by Daily, Weekly and by Year-to-Date performances. Also, one can sort by size of the company or by market capitalization. |
| Select Your Default Chart Type: | |||||
| |||||
| Click on stock symbol or name for detailed view. Click on to add stock symbol to your watchlist and to view watchlist. Quick View: Move mouse or cursor over "Daily" to quickly view daily technical stock chart and over "Weekly" to view weekly technical stock chart. | |||||

 | FELE Franklin Electric Co., Inc. |
| Sector: Industrials | |
| SubSector: Industrial Electrical Equipment | |
| MarketCap: 2397.89 Millions | |
| Recent Price: 97.60 Smart Investing & Trading Score: 0 | |
| Day Percent Change: 1.38% Day Change: 1.33 | |
| Week Change: -5.03% Year-to-date Change: 1.0% | |
| FELE Links: Profile News Message Board | |
| Charts:- Daily , Weekly | |
| Add FELE to Watchlist: View: Get Complete FELE Trend Analysis ➞ | |
 | CRBU Caribou Biosciences, Inc. |
| Sector: Health Care | |
| SubSector: Biotechnology | |
| MarketCap: 258 Millions | |
| Recent Price: 3.68 Smart Investing & Trading Score: 20 | |
| Day Percent Change: 1.38% Day Change: 0.05 | |
| Week Change: -0.81% Year-to-date Change: -35.6% | |
| CRBU Links: Profile News Message Board | |
| Charts:- Daily , Weekly | |
| Add CRBU to Watchlist: View: Get Complete CRBU Trend Analysis ➞ | |
 | FDP Fresh Del Monte Produce Inc. |
| Sector: Consumer Staples | |
| SubSector: Farm Products | |
| MarketCap: 1862.37 Millions | |
| Recent Price: 25.92 Smart Investing & Trading Score: 100 | |
| Day Percent Change: 1.37% Day Change: 0.35 | |
| Week Change: 1.17% Year-to-date Change: -1.3% | |
| FDP Links: Profile News Message Board | |
| Charts:- Daily , Weekly | |
| Add FDP to Watchlist: View: Get Complete FDP Trend Analysis ➞ | |
 | TNET TriNet Group, Inc. |
| Sector: Services & Goods | |
| SubSector: Business Services | |
| MarketCap: 2648.72 Millions | |
| Recent Price: 101.75 Smart Investing & Trading Score: 10 | |
| Day Percent Change: 1.37% Day Change: 1.38 | |
| Week Change: -3.76% Year-to-date Change: -14.5% | |
| TNET Links: Profile News Message Board | |
| Charts:- Daily , Weekly | |
| Add TNET to Watchlist: View: Get Complete TNET Trend Analysis ➞ | |
 | RDVT Red Violet, Inc. |
| Sector: Technology | |
| SubSector: Application Software | |
| MarketCap: 215.162 Millions | |
| Recent Price: 17.01 Smart Investing & Trading Score: 25 | |
| Day Percent Change: 1.37% Day Change: 0.23 | |
| Week Change: 0.12% Year-to-date Change: -14.8% | |
| RDVT Links: Profile News Message Board | |
| Charts:- Daily , Weekly | |
| Add RDVT to Watchlist: View: Get Complete RDVT Trend Analysis ➞ | |
 | IBEX IBEX Limited |
| Sector: Technology | |
| SubSector: Software Application | |
| MarketCap: 37787 Millions | |
| Recent Price: 13.28 Smart Investing & Trading Score: 45 | |
| Day Percent Change: 1.37% Day Change: 0.18 | |
| Week Change: 0.61% Year-to-date Change: -30.0% | |
| IBEX Links: Profile News Message Board | |
| Charts:- Daily , Weekly | |
| Add IBEX to Watchlist: View: Get Complete IBEX Trend Analysis ➞ | |
 | KBH KB Home |
| Sector: Industrials | |
| SubSector: Residential Construction | |
| MarketCap: 1249.66 Millions | |
| Recent Price: 65.64 Smart Investing & Trading Score: 57 | |
| Day Percent Change: 1.36% Day Change: 0.88 | |
| Week Change: 0.06% Year-to-date Change: 5.1% | |
| KBH Links: Profile News Message Board | |
| Charts:- Daily , Weekly | |
| Add KBH to Watchlist: View: Get Complete KBH Trend Analysis ➞ | |
 | TWI Titan International, Inc. |
| Sector: Industrials | |
| SubSector: Farm & Construction Machinery | |
| MarketCap: 104.607 Millions | |
| Recent Price: 11.17 Smart Investing & Trading Score: 10 | |
| Day Percent Change: 1.36% Day Change: 0.15 | |
| Week Change: -3.29% Year-to-date Change: -24.9% | |
| TWI Links: Profile News Message Board | |
| Charts:- Daily , Weekly | |
| Add TWI to Watchlist: View: Get Complete TWI Trend Analysis ➞ | |
 | SSTI ShotSpotter, Inc. |
| Sector: Technology | |
| SubSector: Application Software | |
| MarketCap: 353.062 Millions | |
| Recent Price: 13.54 Smart Investing & Trading Score: 37 | |
| Day Percent Change: 1.35% Day Change: 0.18 | |
| Week Change: -0.95% Year-to-date Change: -47.0% | |
| SSTI Links: Profile News Message Board | |
| Charts:- Daily , Weekly | |
| Add SSTI to Watchlist: View: Get Complete SSTI Trend Analysis ➞ | |
 | LPSN LivePerson, Inc. |
| Sector: Technology | |
| SubSector: Business Software & Services | |
| MarketCap: 1070.58 Millions | |
| Recent Price: 0.51 Smart Investing & Trading Score: 27 | |
| Day Percent Change: 1.34% Day Change: 0.01 | |
| Week Change: -3.5% Year-to-date Change: -86.6% | |
| LPSN Links: Profile News Message Board | |
| Charts:- Daily , Weekly | |
| Add LPSN to Watchlist: View: Get Complete LPSN Trend Analysis ➞ | |
 | OMCL Omnicell, Inc. |
| Sector: Technology | |
| SubSector: Healthcare Information Services | |
| MarketCap: 2781.05 Millions | |
| Recent Price: 27.17 Smart Investing & Trading Score: 49 | |
| Day Percent Change: 1.34% Day Change: 0.36 | |
| Week Change: -2.48% Year-to-date Change: -27.8% | |
| OMCL Links: Profile News Message Board | |
| Charts:- Daily , Weekly | |
| Add OMCL to Watchlist: View: Get Complete OMCL Trend Analysis ➞ | |
 | BATRK The Liberty Braves Group |
| Sector: Services & Goods | |
| SubSector: Broadcasting - TV | |
| MarketCap: 638.363 Millions | |
| Recent Price: 37.93 Smart Investing & Trading Score: 35 | |
| Day Percent Change: 1.34% Day Change: 0.50 | |
| Week Change: -0.68% Year-to-date Change: -4.2% | |
| BATRK Links: Profile News Message Board | |
| Charts:- Daily , Weekly | |
| Add BATRK to Watchlist: View: Get Complete BATRK Trend Analysis ➞ | |
 | VIGL Vigil Neuroscience, Inc. |
| Sector: Health Care | |
| SubSector: Biotechnology | |
| MarketCap: 339 Millions | |
| Recent Price: 2.65 Smart Investing & Trading Score: 20 | |
| Day Percent Change: 1.34% Day Change: 0.04 | |
| Week Change: -2.4% Year-to-date Change: -22.9% | |
| VIGL Links: Profile News Message Board | |
| Charts:- Daily , Weekly | |
| Add VIGL to Watchlist: View: Get Complete VIGL Trend Analysis ➞ | |
 | CDE Coeur Mining, Inc. |
| Sector: Materials | |
| SubSector: Gold | |
| MarketCap: 853.219 Millions | |
| Recent Price: 4.58 Smart Investing & Trading Score: 50 | |
| Day Percent Change: 1.33% Day Change: 0.06 | |
| Week Change: -7.29% Year-to-date Change: 40.5% | |
| CDE Links: Profile News Message Board | |
| Charts:- Daily , Weekly | |
| Add CDE to Watchlist: View: Get Complete CDE Trend Analysis ➞ | |
 | NSP Insperity, Inc. |
| Sector: Services & Goods | |
| SubSector: Business Services | |
| MarketCap: 1385.32 Millions | |
| Recent Price: 104.30 Smart Investing & Trading Score: 54 | |
| Day Percent Change: 1.33% Day Change: 1.37 | |
| Week Change: 0.12% Year-to-date Change: -11.0% | |
| NSP Links: Profile News Message Board | |
| Charts:- Daily , Weekly | |
| Add NSP to Watchlist: View: Get Complete NSP Trend Analysis ➞ | |
 | UEC Uranium Energy Corp. |
| Sector: Materials | |
| SubSector: Industrial Metals & Minerals | |
| MarketCap: 138.91 Millions | |
| Recent Price: 6.84 Smart Investing & Trading Score: 60 | |
| Day Percent Change: 1.33% Day Change: 0.09 | |
| Week Change: -1.01% Year-to-date Change: 6.9% | |
| UEC Links: Profile News Message Board | |
| Charts:- Daily , Weekly | |
| Add UEC to Watchlist: View: Get Complete UEC Trend Analysis ➞ | |
 | EBTC Enterprise Bancorp, Inc. |
| Sector: Financials | |
| SubSector: Savings & Loans | |
| MarketCap: 304.53 Millions | |
| Recent Price: 24.62 Smart Investing & Trading Score: 49 | |
| Day Percent Change: 1.32% Day Change: 0.32 | |
| Week Change: -1.12% Year-to-date Change: -23.7% | |
| EBTC Links: Profile News Message Board | |
| Charts:- Daily , Weekly | |
| Add EBTC to Watchlist: View: Get Complete EBTC Trend Analysis ➞ | |
 | CNS Cohen & Steers, Inc. |
| Sector: Financials | |
| SubSector: Asset Management | |
| MarketCap: 2082.43 Millions | |
| Recent Price: 69.68 Smart Investing & Trading Score: 25 | |
| Day Percent Change: 1.31% Day Change: 0.90 | |
| Week Change: -0.98% Year-to-date Change: -8.0% | |
| CNS Links: Profile News Message Board | |
| Charts:- Daily , Weekly | |
| Add CNS to Watchlist: View: Get Complete CNS Trend Analysis ➞ | |
 | SEMR Semrush Holdings, Inc. |
| Sector: Technology | |
| SubSector: Software - Application | |
| MarketCap: 1330 Millions | |
| Recent Price: 12.40 Smart Investing & Trading Score: 70 | |
| Day Percent Change: 1.31% Day Change: 0.16 | |
| Week Change: 3.16% Year-to-date Change: -10.7% | |
| SEMR Links: Profile News Message Board | |
| Charts:- Daily , Weekly | |
| Add SEMR to Watchlist: View: Get Complete SEMR Trend Analysis ➞ | |
 | PHR Phreesia, Inc. |
| Sector: Technology | |
| SubSector: Healthcare Information Services | |
| MarketCap: 810.255 Millions | |
| Recent Price: 21.01 Smart Investing & Trading Score: 42 | |
| Day Percent Change: 1.30% Day Change: 0.27 | |
| Week Change: 1.94% Year-to-date Change: -9.2% | |
| PHR Links: Profile News Message Board | |
| Charts:- Daily , Weekly | |
| Add PHR to Watchlist: View: Get Complete PHR Trend Analysis ➞ | |
 | IDYA IDEAYA Biosciences, Inc. |
| Sector: Health Care | |
| SubSector: Biotechnology | |
| MarketCap: 89.1785 Millions | |
| Recent Price: 41.18 Smart Investing & Trading Score: 49 | |
| Day Percent Change: 1.30% Day Change: 0.53 | |
| Week Change: 3.1% Year-to-date Change: 15.7% | |
| IDYA Links: Profile News Message Board | |
| Charts:- Daily , Weekly | |
| Add IDYA to Watchlist: View: Get Complete IDYA Trend Analysis ➞ | |
 | CMPO CompoSecure, Inc. |
| Sector: Industrials | |
| SubSector: Metal Fabrication | |
| MarketCap: 535 Millions | |
| Recent Price: 7.02 Smart Investing & Trading Score: 83 | |
| Day Percent Change: 1.30% Day Change: 0.09 | |
| Week Change: 0.72% Year-to-date Change: 28.3% | |
| CMPO Links: Profile News Message Board | |
| Charts:- Daily , Weekly | |
| Add CMPO to Watchlist: View: Get Complete CMPO Trend Analysis ➞ | |
 | EVER EverQuote, Inc. |
| Sector: Financials | |
| SubSector: Regional - Southeast Banks | |
| MarketCap: 767.135 Millions | |
| Recent Price: 20.43 Smart Investing & Trading Score: 90 | |
| Day Percent Change: 1.29% Day Change: 0.26 | |
| Week Change: 4.5% Year-to-date Change: 66.9% | |
| EVER Links: Profile News Message Board | |
| Charts:- Daily , Weekly | |
| Add EVER to Watchlist: View: Get Complete EVER Trend Analysis ➞ | |
 | PIPR Piper Sandler Companies |
| Sector: Financials | |
| SubSector: Asset Management | |
| MarketCap: 759.603 Millions | |
| Recent Price: 198.31 Smart Investing & Trading Score: 81 | |
| Day Percent Change: 1.29% Day Change: 2.52 | |
| Week Change: 0.58% Year-to-date Change: 13.4% | |
| PIPR Links: Profile News Message Board | |
| Charts:- Daily , Weekly | |
| Add PIPR to Watchlist: View: Get Complete PIPR Trend Analysis ➞ | |
 | BKH Black Hills Corporation |
| Sector: Utilities | |
| SubSector: Electric Utilities | |
| MarketCap: 3666.94 Millions | |
| Recent Price: 55.60 Smart Investing & Trading Score: 100 | |
| Day Percent Change: 1.28% Day Change: 0.70 | |
| Week Change: 3.23% Year-to-date Change: 3.1% | |
| BKH Links: Profile News Message Board | |
| Charts:- Daily , Weekly | |
| Add BKH to Watchlist: View: Get Complete BKH Trend Analysis ➞ | |
| Too many stocks? View smallcap stocks filtered by marketcap & sector |
| Marketcap: All SmallCap Stocks (default-no microcap), Large, Mid-Range, Small & MicroCap |
| Sector: Tech, Finance, Energy, Staples, Retail, Industrial, Materials, Utilities & Medical |
|
Best Stocks Today 12Stocks.com |
© 2024 12Stocks.com Terms & Conditions Privacy Contact Us
All Information Provided Only For Education And Not To Be Used For Investing or Trading. See Terms & Conditions


One More Thing ... Get Best Stocks Delivered Daily!
Never Ever Miss A Move With Our Top Ten Stocks Lists
Find Best Stocks In Any Market - Bull or Bear Market
Take A Peek At Our Top Ten Stocks Lists: Daily, Weekly, Year-to-Date & Top Trends
Find Best Stocks In Any Market - Bull or Bear Market
Take A Peek At Our Top Ten Stocks Lists: Daily, Weekly, Year-to-Date & Top Trends
Smallcap Stocks With Best Up Trends [0-bearish to 100-bullish]: Surmodics [100], Rocky Brands[100], TransMedics Group[100], LendingClub [100], Summit [100], A10 s[100], Carpenter [100], UFP [100], PROCEPT BioRobotics[100], Xencor [100], Trinity Industries[100]
Best Smallcap Stocks Year-to-Date:
Janux [441.55%], Viking [310.69%], Longboard [259.25%], Alpine Immune[239.29%], Avidity Biosciences[185.4%], Bakkt [182.96%], Cullinan Oncology[175.33%], Arcutis Bio[173.68%], Vera [173.32%], Super Micro[159.73%], Y-mAbs [141.79%] Best Smallcap Stocks This Week:
Deciphera [73.11%], Eyenovia [45.65%], Cue Biopharma[39.56%], Seres [30.91%], Poseida [30.05%], P3 Health[29.62%], Phibro Animal[28.44%], TransMedics Group[27.72%], Surmodics [27.36%], LendingTree [26.36%], Rocky Brands[24.92%] Best Smallcap Stocks Daily:
Surmodics [29.74%], Rocky Brands[28.41%], TransMedics Group[24.93%], Ventyx Biosciences[24.63%], Eyenovia [21.84%], LendingClub [19.68%], Summit [19.59%], Powell Industries[18.89%], MiMedx Group[18.67%], CareDx [18.30%], A10 s[17.69%]