
 Login Sign Up


| |||||
 |  | ||||

| 12Stocks.com Market Intelligence |
Best SmallCap Stocks
|
| In a hurry? Small Cap Stock Lists: Performance Trends Table, Stock Charts
Sort Small Cap stocks: Daily, Weekly, Year-to-Date, Market Cap & Trends. Filter Small Cap stocks list by sector: Show all, Tech, Finance, Energy, Staples, Retail, Industrial, Materials, Utilities and HealthCare Filter Small Cap stocks list by size: All Large Medium Small and MicroCap |
| 12Stocks.com Small Cap Stocks Performances & Trends Daily | |||||||||
|
|  The overall Smart Investing & Trading Score is 39 (0-bearish to 100-bullish) which puts Small Cap index in short term bearish to neutral trend. The Smart Investing & Trading Score from previous trading session is 41 and hence a deterioration of trend.
| ||||||||
Here are the Smart Investing & Trading Scores of the most requested small cap stocks at 12Stocks.com (click stock name for detailed review):
|


| 12Stocks.com: Investing in Smallcap Index with Stocks | |
|
The following table helps investors and traders sort through current performance and trends (as measured by Smart Investing & Trading Score) of various
stocks in the Smallcap Index. Quick View: Move mouse or cursor over stock symbol (ticker) to view short-term technical chart and over stock name to view long term chart. Click on  to add stock symbol to your watchlist and to add stock symbol to your watchlist and  to view watchlist. Click on any ticker or stock name for detailed market intelligence report for that stock. to view watchlist. Click on any ticker or stock name for detailed market intelligence report for that stock. |
12Stocks.com Performance of Stocks in Smallcap Index
| Ticker | Stock Name | Watchlist | Category | Recent Price | Smart Investing & Trading Score | Change % | YTD Change% |
| RAPT | RAPT |   | Health Care | 8.20 | 34 | 6.43 | -67.02% |
| FBIZ | First Business | | Financials | 35.12 | 42 | 6.20 | -12.42% |
| CDXS | Codexis | | Health Care | 3.09 | 69 | 6.19 | 1.31% |
| PTCT | PTC | | Health Care | 34.13 | 100 | 6.16 | 23.84% |
| ADPT | Adaptive Bio | | Health Care | 2.78 | 49 | 6.11 | -43.27% |
| UUUU | Energy Fuels | | Materials | 5.56 | 49 | 6.11 | -22.67% |
| CTKB | Cytek Biosciences | | Health Care | 6.38 | 54 | 6.07 | -30.67% |
| PGEN | Precigen | | Health Care | 1.40 | 0 | 6.06 | 4.48% |
| AMLX | Amylyx | | Health Care | 1.93 | 47 | 6.06 | -86.69% |
| SIGA | SIGA | | Health Care | 9.31 | 90 | 6.04 | 66.25% |
| CDLX | Cardlytics | | Technology | 12.99 | 24 | 6.04 | 41.04% |
| IOVA | Iovance Bio | | Health Care | 12.49 | 14 | 6.03 | 53.63% |
| ARQT | Arcutis Bio | | Health Care | 8.82 | 17 | 6.01 | 173.07% |
| MRSN | Mersana | | Health Care | 3.36 | 44 | 5.99 | 44.83% |
| FDMT | 4D Molecular | | Health Care | 25.36 | 32 | 5.98 | 22.51% |
| EWTX | Edgewise | | Health Care | 19.00 | 95 | 5.94 | 67.44% |
| OCUL | Ocular Therapeutix | | Health Care | 5.02 | 32 | 5.91 | 12.56% |
| CVGW | Calavo Growers | | Consumer Staples | 28.54 | 57 | 5.90 | -2.96% |
| IRWD | Ironwood | | Health Care | 8.20 | 57 | 5.81 | -28.32% |
| HBNC | Horizon Bancorp | | Financials | 12.14 | 74 | 5.75 | -15.16% |
| ATNI | ATN | | Technology | 20.15 | 32 | 5.61 | -48.29% |
| SGMO | Sangamo | | Health Care | 0.54 | 57 | 5.61 | 0.09% |
| DJCO | Daily Journal | | Services & Goods | 354.01 | 58 | 5.61 | 3.87% |
| EVI | EVI Industries | | Services & Goods | 21.67 | 38 | 5.60 | -8.68% |
| LESL | Leslies | | Services & Goods | 4.14 | 17 | 5.47 | -40.10% |


| Too many stocks? View smallcap stocks filtered by marketcap & sector |
| Marketcap: All SmallCap Stocks (default-no microcap), Large, Mid-Range, Small |
| Smallcap Sector: Tech, Finance, Energy, Staples, Retail, Industrial, Materials, & Medical |
|
Get the most comprehensive stock market coverage daily at 12Stocks.com ➞ Best Stocks Today ➞ Best Stocks Weekly ➞ Best Stocks Year-to-Date ➞ Best Stocks Trends ➞  Best Stocks Today 12Stocks.com Best Nasdaq Stocks ➞ Best S&P 500 Stocks ➞ Best Tech Stocks ➞ Best Biotech Stocks ➞ |
| Detailed Overview of SmallCap Stocks |
| SmallCap Technical Overview, Leaders & Laggards, Top SmallCap ETF Funds & Detailed SmallCap Stocks List, Charts, Trends & More |
| Smallcap: Technical Analysis, Trends & YTD Performance | |
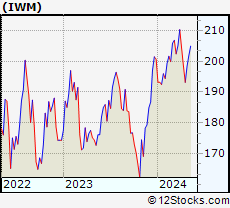
| SmallCap segment as represented by
IWM, an exchange-traded fund [ETF], holds basket of thousands of smallcap stocks from across all major sectors of the US stock market. The smallcap index (contains stocks like Riverbed & Sotheby's) is down by -2.19% and is currently underperforming the overall market by -6.73% year-to-date. Below is a quick view of technical charts and trends: | |
 IWM Weekly Chart |
|
| Long Term Trend: Not Good | |
| Medium Term Trend: Good | |
 IWM Daily Chart |
|
| Short Term Trend: Very Good | |
| Overall Trend Score: 39 | |
| YTD Performance: -2.19% | |
| **Trend Scores & Views Are Only For Educational Purposes And Not For Investing | |
| 12Stocks.com: Top Performing Small Cap Index Stocks | ||||||||||||||||||||||||||||||||||||||||||||||||
 The top performing Small Cap Index stocks year to date are
Now, more recently, over last week, the top performing Small Cap Index stocks on the move are


|
||||||||||||||||||||||||||||||||||||||||||||||||
| 12Stocks.com: Investing in Smallcap Index using Exchange Traded Funds | |
|
The following table shows list of key exchange traded funds (ETF) that
help investors track Smallcap index. The following list also includes leveraged ETF funds that track twice or thrice the daily returns of Smallcap indices. Short or inverse ETF funds move in the opposite direction to the index they track and are useful during market pullbacks or during bear markets. Quick View: Move mouse or cursor over ETF symbol (ticker) to view short-term technical chart and over ETF name to view long term chart. Click on ticker or stock name for detailed view. Click on to add stock symbol to your watchlist and to view watchlist. |
12Stocks.com List of ETFs that track Smallcap Index
| Ticker | ETF Name | Watchlist | Recent Price | Smart Investing & Trading Score | Change % | Week % | Year-to-date % |
| IWM | iShares Russell 2000 | | 196.31 | 39 | 0.21 | -1.05 | -2.19% |
| IJR | iShares Core S&P Small-Cap | | 104.75 | 22 | 0.34 | -0.85 | -3.23% |
| VTWO | Vanguard Russell 2000 ETF | | 79.37 | 14 | 0.27 | -1.06 | -2.13% |
| IWN | iShares Russell 2000 Value | | 149.91 | 22 | 0.58 | -0.81 | -3.49% |
| IJS | iShares S&P Small-Cap 600 Value | | 96.40 | 15 | 0.33 | -0.81 | -6.47% |
| IWO | iShares Russell 2000 Growth | | 249.70 | 7 | -0.25 | -1.34 | -1% |
| IJT | iShares S&P Small-Cap 600 Growth | | 124.90 | 15 | 0.24 | -0.94 | -0.19% |
| XSLV | PowerShares S&P SmallCap Low Volatil ETF | | 42.89 | 52 | 0.82 | 0.4 | -2.85% |
| SDD | ProShares UltraShort SmallCap600 | | 19.55 | 37 | -0.10 | 1.03 | 6.1% |
| SMLV | SPDR SSGA US Small Cap Low Volatil ETF | | 107.07 | 22 | 0.76 | -0.42 | -4.84% |
| SBB | ProShares Short SmallCap600 | | 16.50 | 20 | -0.30 | 0.7 | 3.58% |
| SAA | ProShares Ultra SmallCap600 | | 22.53 | 13 | -0.31 | -2.21 | -9.7% |
| 12Stocks.com: Charts, Trends, Fundamental Data and Performances of SmallCap Stocks | |
|
We now take in-depth look at all SmallCap stocks including charts, multi-period performances and overall trends (as measured by Smart Investing & Trading Score). One can sort SmallCap stocks (click link to choose) by Daily, Weekly and by Year-to-Date performances. Also, one can sort by size of the company or by market capitalization. |
| Select Your Default Chart Type: | |||||
| |||||
| Click on stock symbol or name for detailed view. Click on to add stock symbol to your watchlist and to view watchlist. Quick View: Move mouse or cursor over "Daily" to quickly view daily technical stock chart and over "Weekly" to view weekly technical stock chart. | |||||

 | RAPT RAPT Therapeutics, Inc. |
| Sector: Health Care | |
| SubSector: Biotechnology | |
| MarketCap: 368.785 Millions | |
| Recent Price: 8.20 Smart Investing & Trading Score: 34 | |
| Day Percent Change: 6.43% Day Change: 0.50 | |
| Week Change: 1.17% Year-to-date Change: -67.0% | |
| RAPT Links: Profile News Message Board | |
| Charts:- Daily , Weekly | |
| Add RAPT to Watchlist: View: Get Complete RAPT Trend Analysis ➞ | |
 | FBIZ First Business Financial Services, Inc. |
| Sector: Financials | |
| SubSector: Regional - Midwest Banks | |
| MarketCap: 144.97 Millions | |
| Recent Price: 35.12 Smart Investing & Trading Score: 42 | |
| Day Percent Change: 6.20% Day Change: 2.05 | |
| Week Change: 2.57% Year-to-date Change: -12.4% | |
| FBIZ Links: Profile News Message Board | |
| Charts:- Daily , Weekly | |
| Add FBIZ to Watchlist: View: Get Complete FBIZ Trend Analysis ➞ | |
 | CDXS Codexis, Inc. |
| Sector: Health Care | |
| SubSector: Biotechnology | |
| MarketCap: 592.185 Millions | |
| Recent Price: 3.09 Smart Investing & Trading Score: 69 | |
| Day Percent Change: 6.19% Day Change: 0.18 | |
| Week Change: 16.17% Year-to-date Change: 1.3% | |
| CDXS Links: Profile News Message Board | |
| Charts:- Daily , Weekly | |
| Add CDXS to Watchlist: View: Get Complete CDXS Trend Analysis ➞ | |
 | PTCT PTC Therapeutics, Inc. |
| Sector: Health Care | |
| SubSector: Biotechnology | |
| MarketCap: 2795.85 Millions | |
| Recent Price: 34.13 Smart Investing & Trading Score: 100 | |
| Day Percent Change: 6.16% Day Change: 1.98 | |
| Week Change: 19.46% Year-to-date Change: 23.8% | |
| PTCT Links: Profile News Message Board | |
| Charts:- Daily , Weekly | |
| Add PTCT to Watchlist: View: Get Complete PTCT Trend Analysis ➞ | |
 | ADPT Adaptive Biotechnologies Corporation |
| Sector: Health Care | |
| SubSector: Biotechnology | |
| MarketCap: 3525.75 Millions | |
| Recent Price: 2.78 Smart Investing & Trading Score: 49 | |
| Day Percent Change: 6.11% Day Change: 0.16 | |
| Week Change: 6.92% Year-to-date Change: -43.3% | |
| ADPT Links: Profile News Message Board | |
| Charts:- Daily , Weekly | |
| Add ADPT to Watchlist: View: Get Complete ADPT Trend Analysis ➞ | |
 | UUUU Energy Fuels Inc. |
| Sector: Materials | |
| SubSector: Industrial Metals & Minerals | |
| MarketCap: 107.61 Millions | |
| Recent Price: 5.56 Smart Investing & Trading Score: 49 | |
| Day Percent Change: 6.11% Day Change: 0.32 | |
| Week Change: 2.96% Year-to-date Change: -22.7% | |
| UUUU Links: Profile News Message Board | |
| Charts:- Daily , Weekly | |
| Add UUUU to Watchlist: View: Get Complete UUUU Trend Analysis ➞ | |
 | CTKB Cytek Biosciences, Inc. |
| Sector: Health Care | |
| SubSector: Medical Devices | |
| MarketCap: 1140 Millions | |
| Recent Price: 6.38 Smart Investing & Trading Score: 54 | |
| Day Percent Change: 6.07% Day Change: 0.37 | |
| Week Change: 10.68% Year-to-date Change: -30.7% | |
| CTKB Links: Profile News Message Board | |
| Charts:- Daily , Weekly | |
| Add CTKB to Watchlist: View: Get Complete CTKB Trend Analysis ➞ | |
 | PGEN Precigen, Inc. |
| Sector: Health Care | |
| SubSector: Biotechnology | |
| MarketCap: 564.785 Millions | |
| Recent Price: 1.40 Smart Investing & Trading Score: 0 | |
| Day Percent Change: 6.06% Day Change: 0.08 | |
| Week Change: -0.71% Year-to-date Change: 4.5% | |
| PGEN Links: Profile News Message Board | |
| Charts:- Daily , Weekly | |
| Add PGEN to Watchlist: View: Get Complete PGEN Trend Analysis ➞ | |
 | AMLX Amylyx Pharmaceuticals, Inc. |
| Sector: Health Care | |
| SubSector: Biotechnology | |
| MarketCap: 1500 Millions | |
| Recent Price: 1.93 Smart Investing & Trading Score: 47 | |
| Day Percent Change: 6.06% Day Change: 0.11 | |
| Week Change: 10% Year-to-date Change: -86.7% | |
| AMLX Links: Profile News Message Board | |
| Charts:- Daily , Weekly | |
| Add AMLX to Watchlist: View: Get Complete AMLX Trend Analysis ➞ | |
 | SIGA SIGA Technologies, Inc. |
| Sector: Health Care | |
| SubSector: Biotechnology | |
| MarketCap: 424.285 Millions | |
| Recent Price: 9.31 Smart Investing & Trading Score: 90 | |
| Day Percent Change: 6.04% Day Change: 0.53 | |
| Week Change: 5.92% Year-to-date Change: 66.3% | |
| SIGA Links: Profile News Message Board | |
| Charts:- Daily , Weekly | |
| Add SIGA to Watchlist: View: Get Complete SIGA Trend Analysis ➞ | |
 | CDLX Cardlytics, Inc. |
| Sector: Technology | |
| SubSector: Internet Information Providers | |
| MarketCap: 855.48 Millions | |
| Recent Price: 12.99 Smart Investing & Trading Score: 24 | |
| Day Percent Change: 6.04% Day Change: 0.74 | |
| Week Change: 5.52% Year-to-date Change: 41.0% | |
| CDLX Links: Profile News Message Board | |
| Charts:- Daily , Weekly | |
| Add CDLX to Watchlist: View: Get Complete CDLX Trend Analysis ➞ | |
 | IOVA Iovance Biotherapeutics, Inc. |
| Sector: Health Care | |
| SubSector: Biotechnology | |
| MarketCap: 3533.35 Millions | |
| Recent Price: 12.49 Smart Investing & Trading Score: 14 | |
| Day Percent Change: 6.03% Day Change: 0.71 | |
| Week Change: 7.3% Year-to-date Change: 53.6% | |
| IOVA Links: Profile News Message Board | |
| Charts:- Daily , Weekly | |
| Add IOVA to Watchlist: View: Get Complete IOVA Trend Analysis ➞ | |
 | ARQT Arcutis Biotherapeutics, Inc. |
| Sector: Health Care | |
| SubSector: Biotechnology | |
| MarketCap: 12787 Millions | |
| Recent Price: 8.82 Smart Investing & Trading Score: 17 | |
| Day Percent Change: 6.01% Day Change: 0.50 | |
| Week Change: 4.13% Year-to-date Change: 173.1% | |
| ARQT Links: Profile News Message Board | |
| Charts:- Daily , Weekly | |
| Add ARQT to Watchlist: View: Get Complete ARQT Trend Analysis ➞ | |
 | MRSN Mersana Therapeutics, Inc. |
| Sector: Health Care | |
| SubSector: Biotechnology | |
| MarketCap: 224.385 Millions | |
| Recent Price: 3.36 Smart Investing & Trading Score: 44 | |
| Day Percent Change: 5.99% Day Change: 0.19 | |
| Week Change: 14.29% Year-to-date Change: 44.8% | |
| MRSN Links: Profile News Message Board | |
| Charts:- Daily , Weekly | |
| Add MRSN to Watchlist: View: Get Complete MRSN Trend Analysis ➞ | |
 | FDMT 4D Molecular Therapeutics, Inc. |
| Sector: Health Care | |
| SubSector: Biotechnology | |
| MarketCap: 772 Millions | |
| Recent Price: 25.36 Smart Investing & Trading Score: 32 | |
| Day Percent Change: 5.98% Day Change: 1.43 | |
| Week Change: 9.19% Year-to-date Change: 22.5% | |
| FDMT Links: Profile News Message Board | |
| Charts:- Daily , Weekly | |
| Add FDMT to Watchlist: View: Get Complete FDMT Trend Analysis ➞ | |
 | EWTX Edgewise Therapeutics, Inc. |
| Sector: Health Care | |
| SubSector: Biotechnology | |
| MarketCap: 492 Millions | |
| Recent Price: 19.00 Smart Investing & Trading Score: 95 | |
| Day Percent Change: 5.94% Day Change: 1.06 | |
| Week Change: 17.5% Year-to-date Change: 67.4% | |
| EWTX Links: Profile News Message Board | |
| Charts:- Daily , Weekly | |
| Add EWTX to Watchlist: View: Get Complete EWTX Trend Analysis ➞ | |
 | OCUL Ocular Therapeutix, Inc. |
| Sector: Health Care | |
| SubSector: Biotechnology | |
| MarketCap: 249.985 Millions | |
| Recent Price: 5.02 Smart Investing & Trading Score: 32 | |
| Day Percent Change: 5.91% Day Change: 0.28 | |
| Week Change: 5.8% Year-to-date Change: 12.6% | |
| OCUL Links: Profile News Message Board | |
| Charts:- Daily , Weekly | |
| Add OCUL to Watchlist: View: Get Complete OCUL Trend Analysis ➞ | |
 | CVGW Calavo Growers, Inc. |
| Sector: Consumer Staples | |
| SubSector: Farm Products | |
| MarketCap: 935.287 Millions | |
| Recent Price: 28.54 Smart Investing & Trading Score: 57 | |
| Day Percent Change: 5.90% Day Change: 1.59 | |
| Week Change: 5.59% Year-to-date Change: -3.0% | |
| CVGW Links: Profile News Message Board | |
| Charts:- Daily , Weekly | |
| Add CVGW to Watchlist: View: Get Complete CVGW Trend Analysis ➞ | |
 | IRWD Ironwood Pharmaceuticals, Inc. |
| Sector: Health Care | |
| SubSector: Drugs - Generic | |
| MarketCap: 1616.35 Millions | |
| Recent Price: 8.20 Smart Investing & Trading Score: 57 | |
| Day Percent Change: 5.81% Day Change: 0.45 | |
| Week Change: 4.86% Year-to-date Change: -28.3% | |
| IRWD Links: Profile News Message Board | |
| Charts:- Daily , Weekly | |
| Add IRWD to Watchlist: View: Get Complete IRWD Trend Analysis ➞ | |
 | HBNC Horizon Bancorp, Inc. |
| Sector: Financials | |
| SubSector: Regional - Northeast Banks | |
| MarketCap: 405.999 Millions | |
| Recent Price: 12.14 Smart Investing & Trading Score: 74 | |
| Day Percent Change: 5.75% Day Change: 0.66 | |
| Week Change: 4.12% Year-to-date Change: -15.2% | |
| HBNC Links: Profile News Message Board | |
| Charts:- Daily , Weekly | |
| Add HBNC to Watchlist: View: Get Complete HBNC Trend Analysis ➞ | |
 | ATNI ATN International, Inc. |
| Sector: Technology | |
| SubSector: Telecom Services - Domestic | |
| MarketCap: 1014.77 Millions | |
| Recent Price: 20.15 Smart Investing & Trading Score: 32 | |
| Day Percent Change: 5.61% Day Change: 1.07 | |
| Week Change: 3.23% Year-to-date Change: -48.3% | |
| ATNI Links: Profile News Message Board | |
| Charts:- Daily , Weekly | |
| Add ATNI to Watchlist: View: Get Complete ATNI Trend Analysis ➞ | |
 | SGMO Sangamo Therapeutics, Inc. |
| Sector: Health Care | |
| SubSector: Biotechnology | |
| MarketCap: 779.285 Millions | |
| Recent Price: 0.54 Smart Investing & Trading Score: 57 | |
| Day Percent Change: 5.61% Day Change: 0.03 | |
| Week Change: 5.02% Year-to-date Change: 0.1% | |
| SGMO Links: Profile News Message Board | |
| Charts:- Daily , Weekly | |
| Add SGMO to Watchlist: View: Get Complete SGMO Trend Analysis ➞ | |
 | DJCO Daily Journal Corporation |
| Sector: Services & Goods | |
| SubSector: Publishing - Newspapers | |
| MarketCap: 306.822 Millions | |
| Recent Price: 354.01 Smart Investing & Trading Score: 58 | |
| Day Percent Change: 5.61% Day Change: 18.81 | |
| Week Change: 2.08% Year-to-date Change: 3.9% | |
| DJCO Links: Profile News Message Board | |
| Charts:- Daily , Weekly | |
| Add DJCO to Watchlist: View: Get Complete DJCO Trend Analysis ➞ | |
 | EVI EVI Industries, Inc. |
| Sector: Services & Goods | |
| SubSector: Consumer Services | |
| MarketCap: 207.448 Millions | |
| Recent Price: 21.67 Smart Investing & Trading Score: 38 | |
| Day Percent Change: 5.60% Day Change: 1.15 | |
| Week Change: 1.07% Year-to-date Change: -8.7% | |
| EVI Links: Profile News Message Board | |
| Charts:- Daily , Weekly | |
| Add EVI to Watchlist: View: Get Complete EVI Trend Analysis ➞ | |
 | LESL Leslies, Inc. |
| Sector: Services & Goods | |
| SubSector: Home Improvement Retail | |
| MarketCap: 37927 Millions | |
| Recent Price: 4.14 Smart Investing & Trading Score: 17 | |
| Day Percent Change: 5.47% Day Change: 0.21 | |
| Week Change: 3.88% Year-to-date Change: -40.1% | |
| LESL Links: Profile News Message Board | |
| Charts:- Daily , Weekly | |
| Add LESL to Watchlist: View: Get Complete LESL Trend Analysis ➞ | |
| Too many stocks? View smallcap stocks filtered by marketcap & sector |
| Marketcap: All SmallCap Stocks (default-no microcap), Large, Mid-Range, Small & MicroCap |
| Sector: Tech, Finance, Energy, Staples, Retail, Industrial, Materials, Utilities & Medical |
|
Best Stocks Today 12Stocks.com |
© 2024 12Stocks.com Terms & Conditions Privacy Contact Us
All Information Provided Only For Education And Not To Be Used For Investing or Trading. See Terms & Conditions


One More Thing ... Get Best Stocks Delivered Daily!
Never Ever Miss A Move With Our Top Ten Stocks Lists
Find Best Stocks In Any Market - Bull or Bear Market
Take A Peek At Our Top Ten Stocks Lists: Daily, Weekly, Year-to-Date & Top Trends
Find Best Stocks In Any Market - Bull or Bear Market
Take A Peek At Our Top Ten Stocks Lists: Daily, Weekly, Year-to-Date & Top Trends
Smallcap Stocks With Best Up Trends [0-bearish to 100-bullish]: Surmodics [100], Rocky Brands[100], TransMedics Group[100], LendingClub [100], A10 s[100], Carpenter [100], UFP [100], PROCEPT BioRobotics[100], Xencor [100], Trinity Industries[100], TPG RE[100]
Best Smallcap Stocks Year-to-Date:
Janux [441.55%], Viking [310.45%], Longboard [259.25%], Alpine Immune[239.26%], Avidity Biosciences[185.4%], Bakkt [182.96%], Cullinan Oncology[175.33%], Vera [173.32%], Arcutis Bio[173.07%], Super Micro[159.62%], Y-mAbs [141.35%] Best Smallcap Stocks This Week:
Deciphera [73.07%], Eyenovia [44.86%], Cue Biopharma[39.93%], Poseida [30.52%], Seres [30.3%], P3 Health[29.62%], Phibro Animal[28.75%], TransMedics Group[27.69%], Surmodics [27.24%], LendingTree [26.12%], Rocky Brands[24.58%] Best Smallcap Stocks Daily:
Surmodics [29.62%], Rocky Brands[28.06%], TransMedics Group[24.91%], Ventyx Biosciences[24.63%], Eyenovia [21.17%], LendingClub [19.68%], Summit [19.08%], Powell Industries[18.74%], MiMedx Group[18.34%], CareDx [18.04%], A10 s[17.69%]