
 Login Sign Up


| |||||
 |  | ||||

| 12Stocks.com Market Intelligence |
Best SmallCap Stocks
|
| In a hurry? Small Cap Stock Lists: Performance Trends Table, Stock Charts
Sort Small Cap stocks: Daily, Weekly, Year-to-Date, Market Cap & Trends. Filter Small Cap stocks list by sector: Show all, Tech, Finance, Energy, Staples, Retail, Industrial, Materials, Utilities and HealthCare Filter Small Cap stocks list by size: All Large Medium Small and MicroCap |
| 12Stocks.com Small Cap Stocks Performances & Trends Daily | |||||||||
|
|  The overall Smart Investing & Trading Score is 39 (0-bearish to 100-bullish) which puts Small Cap index in short term bearish to neutral trend. The Smart Investing & Trading Score from previous trading session is 41 and hence a deterioration of trend.
| ||||||||
Here are the Smart Investing & Trading Scores of the most requested small cap stocks at 12Stocks.com (click stock name for detailed review):
|


| 12Stocks.com: Investing in Smallcap Index with Stocks | |
|
The following table helps investors and traders sort through current performance and trends (as measured by Smart Investing & Trading Score) of various
stocks in the Smallcap Index. Quick View: Move mouse or cursor over stock symbol (ticker) to view short-term technical chart and over stock name to view long term chart. Click on  to add stock symbol to your watchlist and to add stock symbol to your watchlist and  to view watchlist. Click on any ticker or stock name for detailed market intelligence report for that stock. to view watchlist. Click on any ticker or stock name for detailed market intelligence report for that stock. |
12Stocks.com Performance of Stocks in Smallcap Index
| Ticker | Stock Name | Watchlist | Category | Recent Price | Smart Investing & Trading Score | Change % | YTD Change% |
| INSM | Insmed |   | Health Care | 25.57 | 49 | 3.44 | -17.49% |
| FPI | Farmland Partners | | Financials | 11.13 | 74 | 3.44 | -10.82% |
| ADTN | ADTRAN | | Technology | 4.53 | 52 | 3.42 | -38.28% |
| SOUN | SoundHound AI | | Technology | 4.39 | 19 | 3.42 | 105.14% |
| INGN | Inogen | | Health Care | 7.03 | 68 | 3.38 | 28.05% |
| ZVIA | Zevia PBC | | Consumer Staples | 0.89 | 42 | 3.38 | -55.94% |
| AURA | Aura Biosciences | | Health Care | 7.65 | 67 | 3.38 | -13.56% |
| SASR | Sandy Spring | | Financials | 21.14 | 42 | 3.37 | -22.39% |
| upst | Upstart | | Financials | 22.86 | 24 | 3.37 | -43.57% |
| CYTK | Cytokinetics | | Health Care | 63.38 | 17 | 3.36 | -24.09% |
| HLIT | Harmonic | | Technology | 11.10 | 64 | 3.35 | -14.88% |
| PFBC | Preferred Bank | | Financials | 78.22 | 100 | 3.34 | 7.07% |
| NBTB | NBT Bancorp | | Financials | 36.18 | 93 | 3.34 | -13.67% |
| TARS | Tarsus | | Health Care | 32.48 | 17 | 3.34 | 60.16% |
| GCBC | Greene County | | Financials | 30.40 | 75 | 3.33 | 7.80% |
| AOMR | Angel Oak | | Financials | 10.88 | 38 | 3.32 | 2.54% |
| TNYA | Tenaya | | Health Care | 4.69 | 59 | 3.30 | 47.48% |
| FATE | Fate | | Health Care | 4.08 | 32 | 3.29 | 9.09% |
| DDD | 3D Systems | | Technology | 3.46 | 52 | 3.28 | -45.51% |
| BY | Byline Bancorp | | Financials | 22.38 | 100 | 3.28 | -5.01% |
| BLFY | Blue Foundry | | Financials | 8.82 | 67 | 3.28 | -8.41% |
| BMRC | Bank of Marin Bancorp | | Financials | 14.83 | 27 | 3.27 | -32.65% |
| MDGL | Madrigal | | Health Care | 210.69 | 27 | 3.27 | -8.94% |
| DAWN | Day One | | Health Care | 17.66 | 100 | 3.27 | 20.22% |
| DMRC | Digimarc | | Technology | 21.83 | 27 | 3.26 | -39.56% |


| Too many stocks? View smallcap stocks filtered by marketcap & sector |
| Marketcap: All SmallCap Stocks (default-no microcap), Large, Mid-Range, Small |
| Smallcap Sector: Tech, Finance, Energy, Staples, Retail, Industrial, Materials, & Medical |
|
Get the most comprehensive stock market coverage daily at 12Stocks.com ➞ Best Stocks Today ➞ Best Stocks Weekly ➞ Best Stocks Year-to-Date ➞ Best Stocks Trends ➞  Best Stocks Today 12Stocks.com Best Nasdaq Stocks ➞ Best S&P 500 Stocks ➞ Best Tech Stocks ➞ Best Biotech Stocks ➞ |
| Detailed Overview of SmallCap Stocks |
| SmallCap Technical Overview, Leaders & Laggards, Top SmallCap ETF Funds & Detailed SmallCap Stocks List, Charts, Trends & More |
| Smallcap: Technical Analysis, Trends & YTD Performance | |
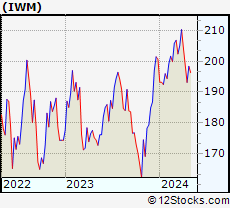
| SmallCap segment as represented by
IWM, an exchange-traded fund [ETF], holds basket of thousands of smallcap stocks from across all major sectors of the US stock market. The smallcap index (contains stocks like Riverbed & Sotheby's) is down by -2.19% and is currently underperforming the overall market by -6.73% year-to-date. Below is a quick view of technical charts and trends: | |
 IWM Weekly Chart |
|
| Long Term Trend: Not Good | |
| Medium Term Trend: Good | |
 IWM Daily Chart |
|
| Short Term Trend: Very Good | |
| Overall Trend Score: 39 | |
| YTD Performance: -2.19% | |
| **Trend Scores & Views Are Only For Educational Purposes And Not For Investing | |
| 12Stocks.com: Top Performing Small Cap Index Stocks | ||||||||||||||||||||||||||||||||||||||||||||||||
 The top performing Small Cap Index stocks year to date are
Now, more recently, over last week, the top performing Small Cap Index stocks on the move are


|
||||||||||||||||||||||||||||||||||||||||||||||||
| 12Stocks.com: Investing in Smallcap Index using Exchange Traded Funds | |
|
The following table shows list of key exchange traded funds (ETF) that
help investors track Smallcap index. The following list also includes leveraged ETF funds that track twice or thrice the daily returns of Smallcap indices. Short or inverse ETF funds move in the opposite direction to the index they track and are useful during market pullbacks or during bear markets. Quick View: Move mouse or cursor over ETF symbol (ticker) to view short-term technical chart and over ETF name to view long term chart. Click on ticker or stock name for detailed view. Click on to add stock symbol to your watchlist and to view watchlist. |
12Stocks.com List of ETFs that track Smallcap Index
| Ticker | ETF Name | Watchlist | Recent Price | Smart Investing & Trading Score | Change % | Week % | Year-to-date % |
| IWM | iShares Russell 2000 | | 196.31 | 39 | 0.21 | -1.05 | -2.19% |
| IJR | iShares Core S&P Small-Cap | | 104.75 | 22 | 0.34 | -0.85 | -3.23% |
| VTWO | Vanguard Russell 2000 ETF | | 79.37 | 14 | 0.27 | -1.06 | -2.13% |
| IWN | iShares Russell 2000 Value | | 149.91 | 22 | 0.58 | -0.81 | -3.49% |
| IJS | iShares S&P Small-Cap 600 Value | | 96.40 | 15 | 0.33 | -0.81 | -6.47% |
| IWO | iShares Russell 2000 Growth | | 249.70 | 7 | -0.25 | -1.34 | -1% |
| IJT | iShares S&P Small-Cap 600 Growth | | 124.90 | 15 | 0.24 | -0.94 | -0.19% |
| XSLV | PowerShares S&P SmallCap Low Volatil ETF | | 42.89 | 52 | 0.82 | 0.4 | -2.85% |
| SDD | ProShares UltraShort SmallCap600 | | 19.55 | 37 | -0.10 | 1.03 | 6.1% |
| SMLV | SPDR SSGA US Small Cap Low Volatil ETF | | 107.07 | 22 | 0.76 | -0.42 | -4.84% |
| SBB | ProShares Short SmallCap600 | | 16.50 | 20 | -0.30 | 0.7 | 3.58% |
| SAA | ProShares Ultra SmallCap600 | | 22.53 | 13 | -0.31 | -2.21 | -9.7% |
| 12Stocks.com: Charts, Trends, Fundamental Data and Performances of SmallCap Stocks | |
|
We now take in-depth look at all SmallCap stocks including charts, multi-period performances and overall trends (as measured by Smart Investing & Trading Score). One can sort SmallCap stocks (click link to choose) by Daily, Weekly and by Year-to-Date performances. Also, one can sort by size of the company or by market capitalization. |
| Select Your Default Chart Type: | |||||
| |||||
| Click on stock symbol or name for detailed view. Click on to add stock symbol to your watchlist and to view watchlist. Quick View: Move mouse or cursor over "Daily" to quickly view daily technical stock chart and over "Weekly" to view weekly technical stock chart. | |||||

 | INSM Insmed Incorporated |
| Sector: Health Care | |
| SubSector: Biotechnology | |
| MarketCap: 1452.45 Millions | |
| Recent Price: 25.57 Smart Investing & Trading Score: 49 | |
| Day Percent Change: 3.44% Day Change: 0.85 | |
| Week Change: 3.1% Year-to-date Change: -17.5% | |
| INSM Links: Profile News Message Board | |
| Charts:- Daily , Weekly | |
| Add INSM to Watchlist: View: Get Complete INSM Trend Analysis ➞ | |
 | FPI Farmland Partners Inc. |
| Sector: Financials | |
| SubSector: REIT - Diversified | |
| MarketCap: 182.653 Millions | |
| Recent Price: 11.13 Smart Investing & Trading Score: 74 | |
| Day Percent Change: 3.44% Day Change: 0.37 | |
| Week Change: 2.68% Year-to-date Change: -10.8% | |
| FPI Links: Profile News Message Board | |
| Charts:- Daily , Weekly | |
| Add FPI to Watchlist: View: Get Complete FPI Trend Analysis ➞ | |
 | ADTN ADTRAN, Inc. |
| Sector: Technology | |
| SubSector: Communication Equipment | |
| MarketCap: 303.539 Millions | |
| Recent Price: 4.53 Smart Investing & Trading Score: 52 | |
| Day Percent Change: 3.42% Day Change: 0.15 | |
| Week Change: 2.26% Year-to-date Change: -38.3% | |
| ADTN Links: Profile News Message Board | |
| Charts:- Daily , Weekly | |
| Add ADTN to Watchlist: View: Get Complete ADTN Trend Analysis ➞ | |
 | SOUN SoundHound AI, Inc. |
| Sector: Technology | |
| SubSector: Software - Application | |
| MarketCap: 1040 Millions | |
| Recent Price: 4.39 Smart Investing & Trading Score: 19 | |
| Day Percent Change: 3.42% Day Change: 0.14 | |
| Week Change: -0.34% Year-to-date Change: 105.1% | |
| SOUN Links: Profile News Message Board | |
| Charts:- Daily , Weekly | |
| Add SOUN to Watchlist: View: Get Complete SOUN Trend Analysis ➞ | |
 | INGN Inogen, Inc. |
| Sector: Health Care | |
| SubSector: Medical Instruments & Supplies | |
| MarketCap: 8803.6 Millions | |
| Recent Price: 7.03 Smart Investing & Trading Score: 68 | |
| Day Percent Change: 3.38% Day Change: 0.23 | |
| Week Change: 3.69% Year-to-date Change: 28.1% | |
| INGN Links: Profile News Message Board | |
| Charts:- Daily , Weekly | |
| Add INGN to Watchlist: View: Get Complete INGN Trend Analysis ➞ | |
 | ZVIA Zevia PBC |
| Sector: Consumer Staples | |
| SubSector: Beverages - Non-Alcoholic | |
| MarketCap: 303 Millions | |
| Recent Price: 0.89 Smart Investing & Trading Score: 42 | |
| Day Percent Change: 3.38% Day Change: 0.03 | |
| Week Change: 10.97% Year-to-date Change: -55.9% | |
| ZVIA Links: Profile News Message Board | |
| Charts:- Daily , Weekly | |
| Add ZVIA to Watchlist: View: Get Complete ZVIA Trend Analysis ➞ | |
 | AURA Aura Biosciences, Inc. |
| Sector: Health Care | |
| SubSector: Biotechnology | |
| MarketCap: 469 Millions | |
| Recent Price: 7.65 Smart Investing & Trading Score: 67 | |
| Day Percent Change: 3.38% Day Change: 0.25 | |
| Week Change: 5.96% Year-to-date Change: -13.6% | |
| AURA Links: Profile News Message Board | |
| Charts:- Daily , Weekly | |
| Add AURA to Watchlist: View: Get Complete AURA Trend Analysis ➞ | |
 | SASR Sandy Spring Bancorp, Inc. |
| Sector: Financials | |
| SubSector: Regional - Mid-Atlantic Banks | |
| MarketCap: 764.659 Millions | |
| Recent Price: 21.14 Smart Investing & Trading Score: 42 | |
| Day Percent Change: 3.37% Day Change: 0.69 | |
| Week Change: -1.63% Year-to-date Change: -22.4% | |
| SASR Links: Profile News Message Board | |
| Charts:- Daily , Weekly | |
| Add SASR to Watchlist: View: Get Complete SASR Trend Analysis ➞ | |
 | upst Upstart Holdings, Inc. |
| Sector: Financials | |
| SubSector: Credit Services | |
| MarketCap: 2900 Millions | |
| Recent Price: 22.86 Smart Investing & Trading Score: 24 | |
| Day Percent Change: 3.37% Day Change: 0.75 | |
| Week Change: -2.52% Year-to-date Change: -43.6% | |
| upst Links: Profile News Message Board | |
| Charts:- Daily , Weekly | |
| Add upst to Watchlist: View: Get Complete upst Trend Analysis ➞ | |
 | CYTK Cytokinetics, Incorporated |
| Sector: Health Care | |
| SubSector: Biotechnology | |
| MarketCap: 654.285 Millions | |
| Recent Price: 63.38 Smart Investing & Trading Score: 17 | |
| Day Percent Change: 3.36% Day Change: 2.06 | |
| Week Change: -3% Year-to-date Change: -24.1% | |
| CYTK Links: Profile News Message Board | |
| Charts:- Daily , Weekly | |
| Add CYTK to Watchlist: View: Get Complete CYTK Trend Analysis ➞ | |
 | HLIT Harmonic Inc. |
| Sector: Technology | |
| SubSector: Communication Equipment | |
| MarketCap: 533.539 Millions | |
| Recent Price: 11.10 Smart Investing & Trading Score: 64 | |
| Day Percent Change: 3.35% Day Change: 0.36 | |
| Week Change: 20.65% Year-to-date Change: -14.9% | |
| HLIT Links: Profile News Message Board | |
| Charts:- Daily , Weekly | |
| Add HLIT to Watchlist: View: Get Complete HLIT Trend Analysis ➞ | |
 | PFBC Preferred Bank |
| Sector: Financials | |
| SubSector: Regional - Pacific Banks | |
| MarketCap: 559.629 Millions | |
| Recent Price: 78.22 Smart Investing & Trading Score: 100 | |
| Day Percent Change: 3.34% Day Change: 2.53 | |
| Week Change: 2.31% Year-to-date Change: 7.1% | |
| PFBC Links: Profile News Message Board | |
| Charts:- Daily , Weekly | |
| Add PFBC to Watchlist: View: Get Complete PFBC Trend Analysis ➞ | |
 | NBTB NBT Bancorp Inc. |
| Sector: Financials | |
| SubSector: Regional - Northeast Banks | |
| MarketCap: 1451.89 Millions | |
| Recent Price: 36.18 Smart Investing & Trading Score: 93 | |
| Day Percent Change: 3.34% Day Change: 1.17 | |
| Week Change: 0.58% Year-to-date Change: -13.7% | |
| NBTB Links: Profile News Message Board | |
| Charts:- Daily , Weekly | |
| Add NBTB to Watchlist: View: Get Complete NBTB Trend Analysis ➞ | |
 | TARS Tarsus Pharmaceuticals, Inc. |
| Sector: Health Care | |
| SubSector: Biotechnology | |
| MarketCap: 74487 Millions | |
| Recent Price: 32.48 Smart Investing & Trading Score: 17 | |
| Day Percent Change: 3.34% Day Change: 1.05 | |
| Week Change: 1.37% Year-to-date Change: 60.2% | |
| TARS Links: Profile News Message Board | |
| Charts:- Daily , Weekly | |
| Add TARS to Watchlist: View: Get Complete TARS Trend Analysis ➞ | |
 | GCBC Greene County Bancorp, Inc. |
| Sector: Financials | |
| SubSector: Savings & Loans | |
| MarketCap: 314.83 Millions | |
| Recent Price: 30.40 Smart Investing & Trading Score: 75 | |
| Day Percent Change: 3.33% Day Change: 0.98 | |
| Week Change: 1.37% Year-to-date Change: 7.8% | |
| GCBC Links: Profile News Message Board | |
| Charts:- Daily , Weekly | |
| Add GCBC to Watchlist: View: Get Complete GCBC Trend Analysis ➞ | |
 | AOMR Angel Oak Mortgage REIT, Inc. |
| Sector: Financials | |
| SubSector: REIT - Mortgage | |
| MarketCap: 202 Millions | |
| Recent Price: 10.88 Smart Investing & Trading Score: 38 | |
| Day Percent Change: 3.32% Day Change: 0.35 | |
| Week Change: -0.09% Year-to-date Change: 2.5% | |
| AOMR Links: Profile News Message Board | |
| Charts:- Daily , Weekly | |
| Add AOMR to Watchlist: View: Get Complete AOMR Trend Analysis ➞ | |
 | TNYA Tenaya Therapeutics, Inc. |
| Sector: Health Care | |
| SubSector: Biotechnology | |
| MarketCap: 395 Millions | |
| Recent Price: 4.69 Smart Investing & Trading Score: 59 | |
| Day Percent Change: 3.30% Day Change: 0.15 | |
| Week Change: 8.82% Year-to-date Change: 47.5% | |
| TNYA Links: Profile News Message Board | |
| Charts:- Daily , Weekly | |
| Add TNYA to Watchlist: View: Get Complete TNYA Trend Analysis ➞ | |
 | FATE Fate Therapeutics, Inc. |
| Sector: Health Care | |
| SubSector: Biotechnology | |
| MarketCap: 2022.45 Millions | |
| Recent Price: 4.08 Smart Investing & Trading Score: 32 | |
| Day Percent Change: 3.29% Day Change: 0.13 | |
| Week Change: 7.37% Year-to-date Change: 9.1% | |
| FATE Links: Profile News Message Board | |
| Charts:- Daily , Weekly | |
| Add FATE to Watchlist: View: Get Complete FATE Trend Analysis ➞ | |
 | DDD 3D Systems Corporation |
| Sector: Technology | |
| SubSector: Computer Peripherals | |
| MarketCap: 842.989 Millions | |
| Recent Price: 3.46 Smart Investing & Trading Score: 52 | |
| Day Percent Change: 3.28% Day Change: 0.11 | |
| Week Change: 0.87% Year-to-date Change: -45.5% | |
| DDD Links: Profile News Message Board | |
| Charts:- Daily , Weekly | |
| Add DDD to Watchlist: View: Get Complete DDD Trend Analysis ➞ | |
 | BY Byline Bancorp, Inc. |
| Sector: Financials | |
| SubSector: Regional - Midwest Banks | |
| MarketCap: 381.87 Millions | |
| Recent Price: 22.38 Smart Investing & Trading Score: 100 | |
| Day Percent Change: 3.28% Day Change: 0.71 | |
| Week Change: 2.75% Year-to-date Change: -5.0% | |
| BY Links: Profile News Message Board | |
| Charts:- Daily , Weekly | |
| Add BY to Watchlist: View: Get Complete BY Trend Analysis ➞ | |
 | BLFY Blue Foundry Bancorp |
| Sector: Financials | |
| SubSector: Banks - Regional | |
| MarketCap: 264 Millions | |
| Recent Price: 8.82 Smart Investing & Trading Score: 67 | |
| Day Percent Change: 3.28% Day Change: 0.28 | |
| Week Change: 0.46% Year-to-date Change: -8.4% | |
| BLFY Links: Profile News Message Board | |
| Charts:- Daily , Weekly | |
| Add BLFY to Watchlist: View: Get Complete BLFY Trend Analysis ➞ | |
 | BMRC Bank of Marin Bancorp |
| Sector: Financials | |
| SubSector: Regional - Pacific Banks | |
| MarketCap: 367.929 Millions | |
| Recent Price: 14.83 Smart Investing & Trading Score: 27 | |
| Day Percent Change: 3.27% Day Change: 0.47 | |
| Week Change: -3.95% Year-to-date Change: -32.7% | |
| BMRC Links: Profile News Message Board | |
| Charts:- Daily , Weekly | |
| Add BMRC to Watchlist: View: Get Complete BMRC Trend Analysis ➞ | |
 | MDGL Madrigal Pharmaceuticals, Inc. |
| Sector: Health Care | |
| SubSector: Biotechnology | |
| MarketCap: 1104.35 Millions | |
| Recent Price: 210.69 Smart Investing & Trading Score: 27 | |
| Day Percent Change: 3.27% Day Change: 6.67 | |
| Week Change: 8.98% Year-to-date Change: -8.9% | |
| MDGL Links: Profile News Message Board | |
| Charts:- Daily , Weekly | |
| Add MDGL to Watchlist: View: Get Complete MDGL Trend Analysis ➞ | |
 | DAWN Day One Biopharmaceuticals, Inc. |
| Sector: Health Care | |
| SubSector: Biotechnology | |
| MarketCap: 1040 Millions | |
| Recent Price: 17.66 Smart Investing & Trading Score: 100 | |
| Day Percent Change: 3.27% Day Change: 0.56 | |
| Week Change: 18.44% Year-to-date Change: 20.2% | |
| DAWN Links: Profile News Message Board | |
| Charts:- Daily , Weekly | |
| Add DAWN to Watchlist: View: Get Complete DAWN Trend Analysis ➞ | |
 | DMRC Digimarc Corporation |
| Sector: Technology | |
| SubSector: Information Technology Services | |
| MarketCap: 222.268 Millions | |
| Recent Price: 21.83 Smart Investing & Trading Score: 27 | |
| Day Percent Change: 3.26% Day Change: 0.69 | |
| Week Change: -2.46% Year-to-date Change: -39.6% | |
| DMRC Links: Profile News Message Board | |
| Charts:- Daily , Weekly | |
| Add DMRC to Watchlist: View: Get Complete DMRC Trend Analysis ➞ | |
| Too many stocks? View smallcap stocks filtered by marketcap & sector |
| Marketcap: All SmallCap Stocks (default-no microcap), Large, Mid-Range, Small & MicroCap |
| Sector: Tech, Finance, Energy, Staples, Retail, Industrial, Materials, Utilities & Medical |
|
Best Stocks Today 12Stocks.com |
© 2024 12Stocks.com Terms & Conditions Privacy Contact Us
All Information Provided Only For Education And Not To Be Used For Investing or Trading. See Terms & Conditions


One More Thing ... Get Best Stocks Delivered Daily!
Never Ever Miss A Move With Our Top Ten Stocks Lists
Find Best Stocks In Any Market - Bull or Bear Market
Take A Peek At Our Top Ten Stocks Lists: Daily, Weekly, Year-to-Date & Top Trends
Find Best Stocks In Any Market - Bull or Bear Market
Take A Peek At Our Top Ten Stocks Lists: Daily, Weekly, Year-to-Date & Top Trends
Smallcap Stocks With Best Up Trends [0-bearish to 100-bullish]: Surmodics [100], Rocky Brands[100], TransMedics Group[100], LendingClub [100], A10 s[100], Carpenter [100], UFP [100], PROCEPT BioRobotics[100], Xencor [100], Trinity Industries[100], TPG RE[100]
Best Smallcap Stocks Year-to-Date:
Janux [441.55%], Viking [310.45%], Longboard [259.25%], Alpine Immune[239.26%], Avidity Biosciences[185.4%], Bakkt [182.96%], Cullinan Oncology[175.33%], Vera [173.32%], Arcutis Bio[173.07%], Super Micro[159.62%], Y-mAbs [141.35%] Best Smallcap Stocks This Week:
Deciphera [73.07%], Eyenovia [44.86%], Cue Biopharma[39.93%], Poseida [30.52%], Seres [30.3%], P3 Health[29.62%], Phibro Animal[28.75%], TransMedics Group[27.69%], Surmodics [27.24%], LendingTree [26.12%], Rocky Brands[24.58%] Best Smallcap Stocks Daily:
Surmodics [29.62%], Rocky Brands[28.06%], TransMedics Group[24.91%], Ventyx Biosciences[24.63%], Eyenovia [21.17%], LendingClub [19.68%], Summit [19.08%], Powell Industries[18.74%], MiMedx Group[18.34%], CareDx [18.04%], A10 s[17.69%]