
 Login Sign Up


| |||||
 |  | ||||

| 12Stocks.com Market Intelligence |
Best SmallCap Stocks
|
| In a hurry? Small Cap Stock Lists: Performance Trends Table, Stock Charts
Sort Small Cap stocks: Daily, Weekly, Year-to-Date, Market Cap & Trends. Filter Small Cap stocks list by sector: Show all, Tech, Finance, Energy, Staples, Retail, Industrial, Materials, Utilities and HealthCare Filter Small Cap stocks list by size: All Large Medium Small and MicroCap |
| 12Stocks.com Small Cap Stocks Performances & Trends Daily | |||||||||
|
|  The overall Smart Investing & Trading Score is 14 (0-bearish to 100-bullish) which puts Small Cap index in short term bearish trend. The Smart Investing & Trading Score from previous trading session is 41 and hence a deterioration of trend.
| ||||||||
Here are the Smart Investing & Trading Scores of the most requested small cap stocks at 12Stocks.com (click stock name for detailed review):
|


| 12Stocks.com: Investing in Smallcap Index with Stocks | |
|
The following table helps investors and traders sort through current performance and trends (as measured by Smart Investing & Trading Score) of various
stocks in the Smallcap Index. Quick View: Move mouse or cursor over stock symbol (ticker) to view short-term technical chart and over stock name to view long term chart. Click on  to add stock symbol to your watchlist and to add stock symbol to your watchlist and  to view watchlist. Click on any ticker or stock name for detailed market intelligence report for that stock. to view watchlist. Click on any ticker or stock name for detailed market intelligence report for that stock. |
12Stocks.com Performance of Stocks in Smallcap Index
| Ticker | Stock Name | Watchlist | Category | Recent Price | Smart Investing & Trading Score | Change % | YTD Change% |
| HLMN | Hillman Solutions |   | Industrials | 9.68 | 42 | 1.15 | 4.71% |
| NRC | National Research | | Health Care | 34.64 | 64 | 1.14 | -12.44% |
| JXN | Jackson Financial | | Financials | 69.10 | 61 | 1.14 | 34.44% |
| OBIO | Orchestra BioMed | | Health Care | 4.46 | 52 | 1.13 | -51.04% |
| SSD | Simpson | | Industrials | 175.84 | 32 | 1.12 | -11.18% |
| CCOI | Cogent | | Technology | 64.90 | 32 | 1.12 | -14.67% |
| IMAX | IMAX | | Services & Goods | 16.19 | 10 | 1.12 | 7.79% |
| CDRE | Cadre | | Industrials | 33.72 | 50 | 1.11 | 2.27% |
| WW | WW | | Services & Goods | 1.83 | 52 | 1.10 | -79.09% |
| AVXL | Anavex Life | | Health Care | 3.69 | 52 | 1.10 | -60.37% |
| ABR | Arbor Realty | | Financials | 12.97 | 69 | 1.09 | -14.56% |
| NTGR | NETGEAR | | Technology | 14.94 | 70 | 1.08 | 2.47% |
| ORC | Orchid Island | | Financials | 8.42 | 32 | 1.08 | -0.12% |
| LEGH | Legacy Housing | | Industrials | 20.59 | 64 | 1.08 | -18.36% |
| IBTX | Independent Bank | | Financials | 37.64 | 0 | 1.07 | -26.02% |
| MTX | Minerals | | Materials | 73.66 | 71 | 1.06 | 3.30% |
| HQY | HealthEquity | | Technology | 79.75 | 25 | 1.06 | 20.29% |
| SJW | SJW Group | | Utilities | 55.02 | 87 | 1.05 | -15.81% |
| SABR | Sabre | | Technology | 2.90 | 90 | 1.05 | -34.09% |
| MSGE | Madison Square | | Technology | 39.56 | 76 | 1.05 | 24.36% |
| RDN | Radian Group | | Financials | 30.18 | 65 | 1.04 | 5.71% |
| AMWD | American Woodmark | | Consumer Staples | 93.04 | 32 | 1.04 | 0.20% |
| UNIT | Uniti Group | | Financials | 5.81 | 62 | 1.04 | 0.52% |
| SAFE | Safehold | | Financials | 18.43 | 42 | 1.04 | -21.24% |
| MCRI | Monarch Casino | | Services & Goods | 68.47 | 25 | 1.03 | -0.98% |


| Too many stocks? View smallcap stocks filtered by marketcap & sector |
| Marketcap: All SmallCap Stocks (default-no microcap), Large, Mid-Range, Small |
| Smallcap Sector: Tech, Finance, Energy, Staples, Retail, Industrial, Materials, & Medical |
|
Get the most comprehensive stock market coverage daily at 12Stocks.com ➞ Best Stocks Today ➞ Best Stocks Weekly ➞ Best Stocks Year-to-Date ➞ Best Stocks Trends ➞  Best Stocks Today 12Stocks.com Best Nasdaq Stocks ➞ Best S&P 500 Stocks ➞ Best Tech Stocks ➞ Best Biotech Stocks ➞ |
| Detailed Overview of SmallCap Stocks |
| SmallCap Technical Overview, Leaders & Laggards, Top SmallCap ETF Funds & Detailed SmallCap Stocks List, Charts, Trends & More |
| Smallcap: Technical Analysis, Trends & YTD Performance | |
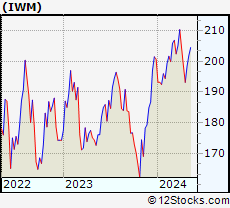
| SmallCap segment as represented by
IWM, an exchange-traded fund [ETF], holds basket of thousands of smallcap stocks from across all major sectors of the US stock market. The smallcap index (contains stocks like Riverbed & Sotheby's) is down by -2.19% and is currently underperforming the overall market by -6.73% year-to-date. Below is a quick view of technical charts and trends: | |
 IWM Weekly Chart |
|
| Long Term Trend: Not Good | |
| Medium Term Trend: Not Good | |
 IWM Daily Chart |
|
| Short Term Trend: Not Good | |
| Overall Trend Score: 14 | |
| YTD Performance: -2.19% | |
| **Trend Scores & Views Are Only For Educational Purposes And Not For Investing | |
| 12Stocks.com: Top Performing Small Cap Index Stocks | ||||||||||||||||||||||||||||||||||||||||||||||||
 The top performing Small Cap Index stocks year to date are
Now, more recently, over last week, the top performing Small Cap Index stocks on the move are


|
||||||||||||||||||||||||||||||||||||||||||||||||
| 12Stocks.com: Investing in Smallcap Index using Exchange Traded Funds | |
|
The following table shows list of key exchange traded funds (ETF) that
help investors track Smallcap index. The following list also includes leveraged ETF funds that track twice or thrice the daily returns of Smallcap indices. Short or inverse ETF funds move in the opposite direction to the index they track and are useful during market pullbacks or during bear markets. Quick View: Move mouse or cursor over ETF symbol (ticker) to view short-term technical chart and over ETF name to view long term chart. Click on ticker or stock name for detailed view. Click on to add stock symbol to your watchlist and to view watchlist. |
12Stocks.com List of ETFs that track Smallcap Index
| Ticker | ETF Name | Watchlist | Recent Price | Smart Investing & Trading Score | Change % | Week % | Year-to-date % |
| IWM | iShares Russell 2000 | | 196.31 | 14 | 0.21 | -1.05 | -2.19% |
| IJR | iShares Core S&P Small-Cap | | 104.74 | 22 | 0.34 | -0.86 | -3.24% |
| VTWO | Vanguard Russell 2000 ETF | | 79.36 | 14 | 0.25 | -1.07 | -2.15% |
| IWN | iShares Russell 2000 Value | | 149.82 | 22 | 0.52 | -0.87 | -3.55% |
| IJS | iShares S&P Small-Cap 600 Value | | 96.40 | 15 | 0.33 | -0.81 | -6.47% |
| IWO | iShares Russell 2000 Growth | | 249.58 | 7 | -0.30 | -1.39 | -1.05% |
| IJT | iShares S&P Small-Cap 600 Growth | | 124.94 | 15 | 0.27 | -0.91 | -0.16% |
| XSLV | PowerShares S&P SmallCap Low Volatil ETF | | 42.83 | 52 | 0.68 | 0.26 | -2.99% |
| SDD | ProShares UltraShort SmallCap600 | | 19.71 | 78 | 0.70 | 1.85 | 6.95% |
| SMLV | SPDR SSGA US Small Cap Low Volatil ETF | | 107.44 | 40 | 1.11 | -0.07 | -4.51% |
| SBB | ProShares Short SmallCap600 | | 16.56 | 71 | 0.05 | 1.06 | 3.94% |
| SAA | ProShares Ultra SmallCap600 | | 22.58 | 8 | -0.08 | -1.99 | -9.49% |
| 12Stocks.com: Charts, Trends, Fundamental Data and Performances of SmallCap Stocks | |
|
We now take in-depth look at all SmallCap stocks including charts, multi-period performances and overall trends (as measured by Smart Investing & Trading Score). One can sort SmallCap stocks (click link to choose) by Daily, Weekly and by Year-to-Date performances. Also, one can sort by size of the company or by market capitalization. |
| Select Your Default Chart Type: | |||||
| |||||
| Click on stock symbol or name for detailed view. Click on to add stock symbol to your watchlist and to view watchlist. Quick View: Move mouse or cursor over "Daily" to quickly view daily technical stock chart and over "Weekly" to view weekly technical stock chart. | |||||

 | HLMN Hillman Solutions Corp. |
| Sector: Industrials | |
| SubSector: Tools & Accessories | |
| MarketCap: 1720 Millions | |
| Recent Price: 9.68 Smart Investing & Trading Score: 42 | |
| Day Percent Change: 1.15% Day Change: 0.11 | |
| Week Change: -0.72% Year-to-date Change: 4.7% | |
| HLMN Links: Profile News Message Board | |
| Charts:- Daily , Weekly | |
| Add HLMN to Watchlist: View: Get Complete HLMN Trend Analysis ➞ | |
 | NRC National Research Corporation |
| Sector: Health Care | |
| SubSector: Medical Laboratories & Research | |
| MarketCap: 1187.7 Millions | |
| Recent Price: 34.64 Smart Investing & Trading Score: 64 | |
| Day Percent Change: 1.14% Day Change: 0.39 | |
| Week Change: 2.45% Year-to-date Change: -12.4% | |
| NRC Links: Profile News Message Board | |
| Charts:- Daily , Weekly | |
| Add NRC to Watchlist: View: Get Complete NRC Trend Analysis ➞ | |
 | JXN Jackson Financial Inc. |
| Sector: Financials | |
| SubSector: Insurance - Life | |
| MarketCap: 2460 Millions | |
| Recent Price: 69.10 Smart Investing & Trading Score: 61 | |
| Day Percent Change: 1.14% Day Change: 0.78 | |
| Week Change: -0.66% Year-to-date Change: 34.4% | |
| JXN Links: Profile News Message Board | |
| Charts:- Daily , Weekly | |
| Add JXN to Watchlist: View: Get Complete JXN Trend Analysis ➞ | |
 | OBIO Orchestra BioMed Holdings, Inc. |
| Sector: Health Care | |
| SubSector: Biotechnology | |
| MarketCap: 271 Millions | |
| Recent Price: 4.46 Smart Investing & Trading Score: 52 | |
| Day Percent Change: 1.13% Day Change: 0.05 | |
| Week Change: 1.59% Year-to-date Change: -51.0% | |
| OBIO Links: Profile News Message Board | |
| Charts:- Daily , Weekly | |
| Add OBIO to Watchlist: View: Get Complete OBIO Trend Analysis ➞ | |
 | SSD Simpson Manufacturing Co., Inc. |
| Sector: Industrials | |
| SubSector: Small Tools & Accessories | |
| MarketCap: 2850.16 Millions | |
| Recent Price: 175.84 Smart Investing & Trading Score: 32 | |
| Day Percent Change: 1.12% Day Change: 1.95 | |
| Week Change: 1.28% Year-to-date Change: -11.2% | |
| SSD Links: Profile News Message Board | |
| Charts:- Daily , Weekly | |
| Add SSD to Watchlist: View: Get Complete SSD Trend Analysis ➞ | |
 | CCOI Cogent Communications Holdings, Inc. |
| Sector: Technology | |
| SubSector: Diversified Communication Services | |
| MarketCap: 3868.14 Millions | |
| Recent Price: 64.90 Smart Investing & Trading Score: 32 | |
| Day Percent Change: 1.12% Day Change: 0.72 | |
| Week Change: -1.35% Year-to-date Change: -14.7% | |
| CCOI Links: Profile News Message Board | |
| Charts:- Daily , Weekly | |
| Add CCOI to Watchlist: View: Get Complete CCOI Trend Analysis ➞ | |
 | IMAX IMAX Corporation |
| Sector: Services & Goods | |
| SubSector: Entertainment - Diversified | |
| MarketCap: 874.237 Millions | |
| Recent Price: 16.19 Smart Investing & Trading Score: 10 | |
| Day Percent Change: 1.12% Day Change: 0.18 | |
| Week Change: -5.6% Year-to-date Change: 7.8% | |
| IMAX Links: Profile News Message Board | |
| Charts:- Daily , Weekly | |
| Add IMAX to Watchlist: View: Get Complete IMAX Trend Analysis ➞ | |
 | CDRE Cadre Holdings, Inc. |
| Sector: Industrials | |
| SubSector: Aerospace & Defense | |
| MarketCap: 817 Millions | |
| Recent Price: 33.72 Smart Investing & Trading Score: 50 | |
| Day Percent Change: 1.11% Day Change: 0.37 | |
| Week Change: 1.81% Year-to-date Change: 2.3% | |
| CDRE Links: Profile News Message Board | |
| Charts:- Daily , Weekly | |
| Add CDRE to Watchlist: View: Get Complete CDRE Trend Analysis ➞ | |
 | WW WW International, Inc. |
| Sector: Services & Goods | |
| SubSector: Personal Services | |
| MarketCap: 1186.25 Millions | |
| Recent Price: 1.83 Smart Investing & Trading Score: 52 | |
| Day Percent Change: 1.10% Day Change: 0.02 | |
| Week Change: 4.57% Year-to-date Change: -79.1% | |
| WW Links: Profile News Message Board | |
| Charts:- Daily , Weekly | |
| Add WW to Watchlist: View: Get Complete WW Trend Analysis ➞ | |
 | AVXL Anavex Life Sciences Corp. |
| Sector: Health Care | |
| SubSector: Biotechnology | |
| MarketCap: 175.985 Millions | |
| Recent Price: 3.69 Smart Investing & Trading Score: 52 | |
| Day Percent Change: 1.10% Day Change: 0.04 | |
| Week Change: 7.27% Year-to-date Change: -60.4% | |
| AVXL Links: Profile News Message Board | |
| Charts:- Daily , Weekly | |
| Add AVXL to Watchlist: View: Get Complete AVXL Trend Analysis ➞ | |
 | ABR Arbor Realty Trust, Inc. |
| Sector: Financials | |
| SubSector: Mortgage Investment | |
| MarketCap: 648.939 Millions | |
| Recent Price: 12.97 Smart Investing & Trading Score: 69 | |
| Day Percent Change: 1.09% Day Change: 0.14 | |
| Week Change: 1.17% Year-to-date Change: -14.6% | |
| ABR Links: Profile News Message Board | |
| Charts:- Daily , Weekly | |
| Add ABR to Watchlist: View: Get Complete ABR Trend Analysis ➞ | |
 | NTGR NETGEAR, Inc. |
| Sector: Technology | |
| SubSector: Communication Equipment | |
| MarketCap: 558.839 Millions | |
| Recent Price: 14.94 Smart Investing & Trading Score: 70 | |
| Day Percent Change: 1.08% Day Change: 0.16 | |
| Week Change: 0.61% Year-to-date Change: 2.5% | |
| NTGR Links: Profile News Message Board | |
| Charts:- Daily , Weekly | |
| Add NTGR to Watchlist: View: Get Complete NTGR Trend Analysis ➞ | |
 | ORC Orchid Island Capital, Inc. |
| Sector: Financials | |
| SubSector: Mortgage Investment | |
| MarketCap: 212.339 Millions | |
| Recent Price: 8.42 Smart Investing & Trading Score: 32 | |
| Day Percent Change: 1.08% Day Change: 0.09 | |
| Week Change: -3.44% Year-to-date Change: -0.1% | |
| ORC Links: Profile News Message Board | |
| Charts:- Daily , Weekly | |
| Add ORC to Watchlist: View: Get Complete ORC Trend Analysis ➞ | |
 | LEGH Legacy Housing Corporation |
| Sector: Industrials | |
| SubSector: Residential Construction | |
| MarketCap: 298.006 Millions | |
| Recent Price: 20.59 Smart Investing & Trading Score: 64 | |
| Day Percent Change: 1.08% Day Change: 0.22 | |
| Week Change: 1.43% Year-to-date Change: -18.4% | |
| LEGH Links: Profile News Message Board | |
| Charts:- Daily , Weekly | |
| Add LEGH to Watchlist: View: Get Complete LEGH Trend Analysis ➞ | |
 | IBTX Independent Bank Group, Inc. |
| Sector: Financials | |
| SubSector: Regional - Southeast Banks | |
| MarketCap: 1133.35 Millions | |
| Recent Price: 37.64 Smart Investing & Trading Score: 0 | |
| Day Percent Change: 1.07% Day Change: 0.40 | |
| Week Change: -4.32% Year-to-date Change: -26.0% | |
| IBTX Links: Profile News Message Board | |
| Charts:- Daily , Weekly | |
| Add IBTX to Watchlist: View: Get Complete IBTX Trend Analysis ➞ | |
 | MTX Minerals Technologies Inc. |
| Sector: Materials | |
| SubSector: Chemicals - Major Diversified | |
| MarketCap: 1155.36 Millions | |
| Recent Price: 73.66 Smart Investing & Trading Score: 71 | |
| Day Percent Change: 1.06% Day Change: 0.77 | |
| Week Change: -0.05% Year-to-date Change: 3.3% | |
| MTX Links: Profile News Message Board | |
| Charts:- Daily , Weekly | |
| Add MTX to Watchlist: View: Get Complete MTX Trend Analysis ➞ | |
 | HQY HealthEquity, Inc. |
| Sector: Technology | |
| SubSector: Healthcare Information Services | |
| MarketCap: 3369.75 Millions | |
| Recent Price: 79.75 Smart Investing & Trading Score: 25 | |
| Day Percent Change: 1.06% Day Change: 0.84 | |
| Week Change: -0.64% Year-to-date Change: 20.3% | |
| HQY Links: Profile News Message Board | |
| Charts:- Daily , Weekly | |
| Add HQY to Watchlist: View: Get Complete HQY Trend Analysis ➞ | |
 | SJW SJW Group |
| Sector: Utilities | |
| SubSector: Water Utilities | |
| MarketCap: 1571.62 Millions | |
| Recent Price: 55.02 Smart Investing & Trading Score: 87 | |
| Day Percent Change: 1.05% Day Change: 0.57 | |
| Week Change: 2.84% Year-to-date Change: -15.8% | |
| SJW Links: Profile News Message Board | |
| Charts:- Daily , Weekly | |
| Add SJW to Watchlist: View: Get Complete SJW Trend Analysis ➞ | |
 | SABR Sabre Corporation |
| Sector: Technology | |
| SubSector: Information Technology Services | |
| MarketCap: 152.468 Millions | |
| Recent Price: 2.90 Smart Investing & Trading Score: 90 | |
| Day Percent Change: 1.05% Day Change: 0.03 | |
| Week Change: 3.57% Year-to-date Change: -34.1% | |
| SABR Links: Profile News Message Board | |
| Charts:- Daily , Weekly | |
| Add SABR to Watchlist: View: Get Complete SABR Trend Analysis ➞ | |
 | MSGE Madison Square Garden Entertainment Corp. |
| Sector: Technology | |
| SubSector: Entertainment | |
| MarketCap: 18837 Millions | |
| Recent Price: 39.56 Smart Investing & Trading Score: 76 | |
| Day Percent Change: 1.05% Day Change: 0.41 | |
| Week Change: 0.36% Year-to-date Change: 24.4% | |
| MSGE Links: Profile News Message Board | |
| Charts:- Daily , Weekly | |
| Add MSGE to Watchlist: View: Get Complete MSGE Trend Analysis ➞ | |
 | RDN Radian Group Inc. |
| Sector: Financials | |
| SubSector: Property & Casualty Insurance | |
| MarketCap: 2950.12 Millions | |
| Recent Price: 30.18 Smart Investing & Trading Score: 65 | |
| Day Percent Change: 1.04% Day Change: 0.31 | |
| Week Change: -0.56% Year-to-date Change: 5.7% | |
| RDN Links: Profile News Message Board | |
| Charts:- Daily , Weekly | |
| Add RDN to Watchlist: View: Get Complete RDN Trend Analysis ➞ | |
 | AMWD American Woodmark Corporation |
| Sector: Consumer Staples | |
| SubSector: Home Furnishings & Fixtures | |
| MarketCap: 958.435 Millions | |
| Recent Price: 93.04 Smart Investing & Trading Score: 32 | |
| Day Percent Change: 1.04% Day Change: 0.96 | |
| Week Change: 0.13% Year-to-date Change: 0.2% | |
| AMWD Links: Profile News Message Board | |
| Charts:- Daily , Weekly | |
| Add AMWD to Watchlist: View: Get Complete AMWD Trend Analysis ➞ | |
 | UNIT Uniti Group Inc. |
| Sector: Financials | |
| SubSector: REIT - Industrial | |
| MarketCap: 1363.09 Millions | |
| Recent Price: 5.81 Smart Investing & Trading Score: 62 | |
| Day Percent Change: 1.04% Day Change: 0.06 | |
| Week Change: 0.52% Year-to-date Change: 0.5% | |
| UNIT Links: Profile News Message Board | |
| Charts:- Daily , Weekly | |
| Add UNIT to Watchlist: View: Get Complete UNIT Trend Analysis ➞ | |
 | SAFE Safehold Inc. |
| Sector: Financials | |
| SubSector: REIT - Diversified | |
| MarketCap: 2994.63 Millions | |
| Recent Price: 18.43 Smart Investing & Trading Score: 42 | |
| Day Percent Change: 1.04% Day Change: 0.19 | |
| Week Change: 1.21% Year-to-date Change: -21.2% | |
| SAFE Links: Profile News Message Board | |
| Charts:- Daily , Weekly | |
| Add SAFE to Watchlist: View: Get Complete SAFE Trend Analysis ➞ | |
 | MCRI Monarch Casino & Resort, Inc. |
| Sector: Services & Goods | |
| SubSector: Resorts & Casinos | |
| MarketCap: 352.894 Millions | |
| Recent Price: 68.47 Smart Investing & Trading Score: 25 | |
| Day Percent Change: 1.03% Day Change: 0.70 | |
| Week Change: 0.59% Year-to-date Change: -1.0% | |
| MCRI Links: Profile News Message Board | |
| Charts:- Daily , Weekly | |
| Add MCRI to Watchlist: View: Get Complete MCRI Trend Analysis ➞ | |
| Too many stocks? View smallcap stocks filtered by marketcap & sector |
| Marketcap: All SmallCap Stocks (default-no microcap), Large, Mid-Range, Small & MicroCap |
| Sector: Tech, Finance, Energy, Staples, Retail, Industrial, Materials, Utilities & Medical |
|
Best Stocks Today 12Stocks.com |
© 2024 12Stocks.com Terms & Conditions Privacy Contact Us
All Information Provided Only For Education And Not To Be Used For Investing or Trading. See Terms & Conditions


One More Thing ... Get Best Stocks Delivered Daily!
Never Ever Miss A Move With Our Top Ten Stocks Lists
Find Best Stocks In Any Market - Bull or Bear Market
Take A Peek At Our Top Ten Stocks Lists: Daily, Weekly, Year-to-Date & Top Trends
Find Best Stocks In Any Market - Bull or Bear Market
Take A Peek At Our Top Ten Stocks Lists: Daily, Weekly, Year-to-Date & Top Trends
Smallcap Stocks With Best Up Trends [0-bearish to 100-bullish]: Surmodics [100], Rocky Brands[100], TransMedics Group[100], LendingClub [100], Summit [100], A10 s[100], Carpenter [100], UFP [100], PROCEPT BioRobotics[100], Xencor [100], Trinity Industries[100]
Best Smallcap Stocks Year-to-Date:
Janux [441.55%], Viking [310.69%], Longboard [259.25%], Alpine Immune[239.29%], Avidity Biosciences[185.4%], Bakkt [182.96%], Cullinan Oncology[175.33%], Arcutis Bio[173.68%], Vera [173.32%], Super Micro[159.73%], Y-mAbs [141.79%] Best Smallcap Stocks This Week:
Deciphera [73.11%], Eyenovia [45.65%], Cue Biopharma[39.56%], Seres [30.91%], Poseida [30.05%], P3 Health[29.62%], Phibro Animal[28.44%], TransMedics Group[27.72%], Surmodics [27.36%], LendingTree [26.36%], Rocky Brands[24.92%] Best Smallcap Stocks Daily:
Surmodics [29.74%], Rocky Brands[28.41%], TransMedics Group[24.93%], Ventyx Biosciences[24.63%], Eyenovia [21.84%], LendingClub [19.68%], Summit [19.59%], Powell Industries[18.89%], MiMedx Group[18.67%], CareDx [18.30%], A10 s[17.69%]