
 Login Sign Up


| |||||
 |  | ||||

| 12Stocks.com Market Intelligence |
Best SmallCap Stocks
|
| In a hurry? Small Cap Stock Lists: Performance Trends Table, Stock Charts
Sort Small Cap stocks: Daily, Weekly, Year-to-Date, Market Cap & Trends. Filter Small Cap stocks list by sector: Show all, Tech, Finance, Energy, Staples, Retail, Industrial, Materials, Utilities and HealthCare Filter Small Cap stocks list by size: All Large Medium Small and MicroCap |
| 12Stocks.com Small Cap Stocks Performances & Trends Daily | |||||||||
|
|  The overall Smart Investing & Trading Score is 7 (0-bearish to 100-bullish) which puts Small Cap index in short term bearish trend. The Smart Investing & Trading Score from previous trading session is 41 and hence a deterioration of trend.
| ||||||||
Here are the Smart Investing & Trading Scores of the most requested small cap stocks at 12Stocks.com (click stock name for detailed review):
|


| 12Stocks.com: Investing in Smallcap Index with Stocks | |
|
The following table helps investors and traders sort through current performance and trends (as measured by Smart Investing & Trading Score) of various
stocks in the Smallcap Index. Quick View: Move mouse or cursor over stock symbol (ticker) to view short-term technical chart and over stock name to view long term chart. Click on  to add stock symbol to your watchlist and to add stock symbol to your watchlist and  to view watchlist. Click on any ticker or stock name for detailed market intelligence report for that stock. to view watchlist. Click on any ticker or stock name for detailed market intelligence report for that stock. |
12Stocks.com Performance of Stocks in Smallcap Index
| Ticker | Stock Name | Watchlist | Category | Recent Price | Smart Investing & Trading Score | Change % | YTD Change% |
| FWRD | Forward Air |   | Transports | 21.50 | 20 | -2.34 | -65.79% |
| TERN | Terns | | Health Care | 4.95 | 30 | -2.37 | -25.11% |
| OMI | Owens & Minor | | Services & Goods | 24.15 | 18 | -2.38 | 25.32% |
| SFM | Sprouts Farmers | | Services & Goods | 64.44 | 48 | -2.42 | 33.93% |
| TTMI | TTM | | Technology | 14.57 | 32 | -2.44 | -7.87% |
| LBPH | Longboard | | Health Care | 20.78 | 52 | -2.44 | 240.10% |
| MTDR | Matador Resources | | Energy | 60.77 | 0 | -2.46 | 6.88% |
| AOSL | Alpha and | | Technology | 21.33 | 27 | -2.47 | -18.15% |
| CRGY | Crescent Energy | | Energy | 10.38 | 0 | -2.49 | -21.34% |
| SMR | NuScale Power | | Industrials | 5.66 | 51 | -2.50 | 75.35% |
| BLKB | Blackbaud | | Technology | 75.96 | 36 | -2.52 | -12.39% |
| DUOL | Duolingo | | Technology | 220.05 | 32 | -2.52 | -3.43% |
| KLIC | Kulicke and | | Technology | 45.09 | 7 | -2.56 | -17.59% |
| NDLS | Noodles & | | Services & Goods | 1.52 | 52 | -2.56 | -51.75% |
| SHAK | Shake Shack | | Services & Goods | 103.11 | 27 | -2.59 | 39.11% |
| COHU | Cohu | | Technology | 29.53 | 0 | -2.61 | -16.56% |
| FORM | FormFactor | | Technology | 43.42 | 33 | -2.62 | 4.10% |
| DIOD | Diodes | | Technology | 71.10 | 68 | -2.62 | -11.70% |
| HEAR | Turtle Beach | | Technology | 13.73 | 41 | -2.62 | 25.39% |
| SM | SM Energy | | Energy | 47.22 | 31 | -2.63 | 21.94% |
| MPB | Mid Penn | | Financials | 20.19 | 42 | -2.63 | -16.85% |
| XFOR | X4 | | Health Care | 1.09 | 31 | -2.68 | 29.99% |
| BWMN | Bowman Consulting | | Industrials | 31.62 | 22 | -2.68 | -10.20% |
| SAVE | Spirit Airlines | | Transports | 3.44 | 20 | -2.69 | -79.04% |
| MTSI | MACOM | | Technology | 99.11 | 41 | -2.78 | 6.63% |
| For chart view version of above stock list: Chart View ➞ 0 - 25 , 25 - 50 , 50 - 75 , 75 - 100 , 100 - 125 , 125 - 150 , 150 - 175 , 175 - 200 , 200 - 225 , 225 - 250 , 250 - 275 , 275 - 300 , 300 - 325 , 325 - 350 , 350 - 375 , 375 - 400 , 400 - 425 , 425 - 450 , 450 - 475 , 475 - 500 , 500 - 525 , 525 - 550 , 550 - 575 , 575 - 600 , 600 - 625 , 625 - 650 , 650 - 675 , 675 - 700 , 700 - 725 , 725 - 750 , 750 - 775 , 775 - 800 , 800 - 825 , 825 - 850 , 850 - 875 , 875 - 900 , 900 - 925 , 925 - 950 , 950 - 975 , 975 - 1000 , 1000 - 1025 , 1025 - 1050 , 1050 - 1075 , 1075 - 1100 , 1100 - 1125 , 1125 - 1150 , 1150 - 1175 , 1175 - 1200 , 1200 - 1225 , 1225 - 1250 , 1250 - 1275 , 1275 - 1300 , 1300 - 1325 , 1325 - 1350 , 1350 - 1375 , 1375 - 1400 , 1400 - 1425 , 1425 - 1450 , 1450 - 1475 , 1475 - 1500 , 1500 - 1525 , 1525 - 1550 , 1550 - 1575 | ||
 | Click To Change The Sort Order: By Market Cap or Company Size Performance: Year-to-date, Week and Day |  |
| Too many stocks? View smallcap stocks filtered by marketcap & sector |
| Marketcap: All SmallCap Stocks (default-no microcap), Large, Mid-Range, Small |
| Smallcap Sector: Tech, Finance, Energy, Staples, Retail, Industrial, Materials, & Medical |
|
Get the most comprehensive stock market coverage daily at 12Stocks.com ➞ Best Stocks Today ➞ Best Stocks Weekly ➞ Best Stocks Year-to-Date ➞ Best Stocks Trends ➞  Best Stocks Today 12Stocks.com Best Nasdaq Stocks ➞ Best S&P 500 Stocks ➞ Best Tech Stocks ➞ Best Biotech Stocks ➞ |
| Detailed Overview of SmallCap Stocks |
| SmallCap Technical Overview, Leaders & Laggards, Top SmallCap ETF Funds & Detailed SmallCap Stocks List, Charts, Trends & More |
| Smallcap: Technical Analysis, Trends & YTD Performance | |
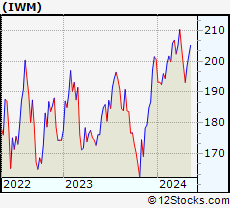
| SmallCap segment as represented by
IWM, an exchange-traded fund [ETF], holds basket of thousands of smallcap stocks from across all major sectors of the US stock market. The smallcap index (contains stocks like Riverbed & Sotheby's) is down by -2.65% and is currently underperforming the overall market by -7.34% year-to-date. Below is a quick view of technical charts and trends: | |
 IWM Weekly Chart |
|
| Long Term Trend: Not Good | |
| Medium Term Trend: Not Good | |
 IWM Daily Chart |
|
| Short Term Trend: Not Good | |
| Overall Trend Score: 7 | |
| YTD Performance: -2.65% | |
| **Trend Scores & Views Are Only For Educational Purposes And Not For Investing | |
| 12Stocks.com: Top Performing Small Cap Index Stocks | ||||||||||||||||||||||||||||||||||||||||||||||||
 The top performing Small Cap Index stocks year to date are
Now, more recently, over last week, the top performing Small Cap Index stocks on the move are


|
||||||||||||||||||||||||||||||||||||||||||||||||
| 12Stocks.com: Investing in Smallcap Index using Exchange Traded Funds | |
|
The following table shows list of key exchange traded funds (ETF) that
help investors track Smallcap index. The following list also includes leveraged ETF funds that track twice or thrice the daily returns of Smallcap indices. Short or inverse ETF funds move in the opposite direction to the index they track and are useful during market pullbacks or during bear markets. Quick View: Move mouse or cursor over ETF symbol (ticker) to view short-term technical chart and over ETF name to view long term chart. Click on ticker or stock name for detailed view. Click on to add stock symbol to your watchlist and to view watchlist. |
12Stocks.com List of ETFs that track Smallcap Index
| Ticker | ETF Name | Watchlist | Recent Price | Smart Investing & Trading Score | Change % | Week % | Year-to-date % |
| IWM | iShares Russell 2000 | | 195.39 | 7 | -0.26 | -1.51 | -2.65% |
| IJR | iShares Core S&P Small-Cap | | 104.72 | 15 | 0.32 | -0.88 | -3.26% |
| VTWO | Vanguard Russell 2000 ETF | | 79.15 | 7 | -0.01 | -1.33 | -2.4% |
| IWN | iShares Russell 2000 Value | | 149.66 | 15 | 0.42 | -0.98 | -3.65% |
| IWO | iShares Russell 2000 Growth | | 248.76 | 7 | -0.62 | -1.71 | -1.37% |
| IJS | iShares S&P Small-Cap 600 Value | | 96.40 | 8 | 0.33 | -0.81 | -6.47% |
| IJT | iShares S&P Small-Cap 600 Growth | | 125.02 | 15 | 0.34 | -0.85 | -0.1% |
| XSLV | PowerShares S&P SmallCap Low Volatil ETF | | 42.75 | 38 | 0.49 | 0.07 | -3.17% |
| 12Stocks.com: Charts, Trends, Fundamental Data and Performances of SmallCap Stocks | |
|
We now take in-depth look at all SmallCap stocks including charts, multi-period performances and overall trends (as measured by Smart Investing & Trading Score). One can sort SmallCap stocks (click link to choose) by Daily, Weekly and by Year-to-Date performances. Also, one can sort by size of the company or by market capitalization. |
| Select Your Default Chart Type: | |||||
| |||||
| Click on stock symbol or name for detailed view. Click on to add stock symbol to your watchlist and to view watchlist. Quick View: Move mouse or cursor over "Daily" to quickly view daily technical stock chart and over "Weekly" to view weekly technical stock chart. | |||||

 | FWRD Forward Air Corporation |
| Sector: Transports | |
| SubSector: Air Delivery & Freight Services | |
| MarketCap: 1278.88 Millions | |
| Recent Price: 21.50 Smart Investing & Trading Score: 20 | |
| Day Percent Change: -2.34% Day Change: -0.52 | |
| Week Change: -3.44% Year-to-date Change: -65.8% | |
| FWRD Links: Profile News Message Board | |
| Charts:- Daily , Weekly | |
| Add FWRD to Watchlist: View: Get Complete FWRD Trend Analysis ➞ | |
 | TERN Terns Pharmaceuticals, Inc. |
| Sector: Health Care | |
| SubSector: Biotechnology | |
| MarketCap: 611 Millions | |
| Recent Price: 4.95 Smart Investing & Trading Score: 30 | |
| Day Percent Change: -2.37% Day Change: -0.12 | |
| Week Change: 0.81% Year-to-date Change: -25.1% | |
| TERN Links: Profile News Message Board | |
| Charts:- Daily , Weekly | |
| Add TERN to Watchlist: View: Get Complete TERN Trend Analysis ➞ | |
 | OMI Owens & Minor, Inc. |
| Sector: Services & Goods | |
| SubSector: Medical Equipment Wholesale | |
| MarketCap: 403.92 Millions | |
| Recent Price: 24.15 Smart Investing & Trading Score: 18 | |
| Day Percent Change: -2.38% Day Change: -0.59 | |
| Week Change: -3.75% Year-to-date Change: 25.3% | |
| OMI Links: Profile News Message Board | |
| Charts:- Daily , Weekly | |
| Add OMI to Watchlist: View: Get Complete OMI Trend Analysis ➞ | |
 | SFM Sprouts Farmers Market, Inc. |
| Sector: Services & Goods | |
| SubSector: Grocery Stores | |
| MarketCap: 2495.85 Millions | |
| Recent Price: 64.44 Smart Investing & Trading Score: 48 | |
| Day Percent Change: -2.42% Day Change: -1.59 | |
| Week Change: -3.8% Year-to-date Change: 33.9% | |
| SFM Links: Profile News Message Board | |
| Charts:- Daily , Weekly | |
| Add SFM to Watchlist: View: Get Complete SFM Trend Analysis ➞ | |
 | TTMI TTM Technologies, Inc. |
| Sector: Technology | |
| SubSector: Printed Circuit Boards | |
| MarketCap: 1028.35 Millions | |
| Recent Price: 14.57 Smart Investing & Trading Score: 32 | |
| Day Percent Change: -2.44% Day Change: -0.37 | |
| Week Change: -3.73% Year-to-date Change: -7.9% | |
| TTMI Links: Profile News Message Board | |
| Charts:- Daily , Weekly | |
| Add TTMI to Watchlist: View: Get Complete TTMI Trend Analysis ➞ | |
 | LBPH Longboard Pharmaceuticals, Inc. |
| Sector: Health Care | |
| SubSector: Biotechnology | |
| MarketCap: 169 Millions | |
| Recent Price: 20.78 Smart Investing & Trading Score: 52 | |
| Day Percent Change: -2.44% Day Change: -0.52 | |
| Week Change: 5.38% Year-to-date Change: 240.1% | |
| LBPH Links: Profile News Message Board | |
| Charts:- Daily , Weekly | |
| Add LBPH to Watchlist: View: Get Complete LBPH Trend Analysis ➞ | |
 | MTDR Matador Resources Company |
| Sector: Energy | |
| SubSector: Independent Oil & Gas | |
| MarketCap: 196.593 Millions | |
| Recent Price: 60.77 Smart Investing & Trading Score: 0 | |
| Day Percent Change: -2.46% Day Change: -1.53 | |
| Week Change: -7.38% Year-to-date Change: 6.9% | |
| MTDR Links: Profile News Message Board | |
| Charts:- Daily , Weekly | |
| Add MTDR to Watchlist: View: Get Complete MTDR Trend Analysis ➞ | |
 | AOSL Alpha and Omega Semiconductor Limited |
| Sector: Technology | |
| SubSector: Semiconductor - Specialized | |
| MarketCap: 158.66 Millions | |
| Recent Price: 21.33 Smart Investing & Trading Score: 27 | |
| Day Percent Change: -2.47% Day Change: -0.54 | |
| Week Change: -3.88% Year-to-date Change: -18.2% | |
| AOSL Links: Profile News Message Board | |
| Charts:- Daily , Weekly | |
| Add AOSL to Watchlist: View: Get Complete AOSL Trend Analysis ➞ | |
 | CRGY Crescent Energy Company |
| Sector: Energy | |
| SubSector: Oil & Gas E&P | |
| MarketCap: 1700 Millions | |
| Recent Price: 10.38 Smart Investing & Trading Score: 0 | |
| Day Percent Change: -2.49% Day Change: -0.27 | |
| Week Change: -4.2% Year-to-date Change: -21.3% | |
| CRGY Links: Profile News Message Board | |
| Charts:- Daily , Weekly | |
| Add CRGY to Watchlist: View: Get Complete CRGY Trend Analysis ➞ | |
 | SMR NuScale Power Corporation |
| Sector: Industrials | |
| SubSector: Specialty Industrial Machinery | |
| MarketCap: 1510 Millions | |
| Recent Price: 5.66 Smart Investing & Trading Score: 51 | |
| Day Percent Change: -2.50% Day Change: -0.14 | |
| Week Change: -6.68% Year-to-date Change: 75.4% | |
| SMR Links: Profile News Message Board | |
| Charts:- Daily , Weekly | |
| Add SMR to Watchlist: View: Get Complete SMR Trend Analysis ➞ | |
 | BLKB Blackbaud, Inc. |
| Sector: Technology | |
| SubSector: Business Software & Services | |
| MarketCap: 2838.48 Millions | |
| Recent Price: 75.96 Smart Investing & Trading Score: 36 | |
| Day Percent Change: -2.52% Day Change: -1.96 | |
| Week Change: -2.55% Year-to-date Change: -12.4% | |
| BLKB Links: Profile News Message Board | |
| Charts:- Daily , Weekly | |
| Add BLKB to Watchlist: View: Get Complete BLKB Trend Analysis ➞ | |
 | DUOL Duolingo, Inc. |
| Sector: Technology | |
| SubSector: Software - Application | |
| MarketCap: 6070 Millions | |
| Recent Price: 220.05 Smart Investing & Trading Score: 32 | |
| Day Percent Change: -2.52% Day Change: -5.69 | |
| Week Change: -1.11% Year-to-date Change: -3.4% | |
| DUOL Links: Profile News Message Board | |
| Charts:- Daily , Weekly | |
| Add DUOL to Watchlist: View: Get Complete DUOL Trend Analysis ➞ | |
 | KLIC Kulicke and Soffa Industries, Inc. |
| Sector: Technology | |
| SubSector: Semiconductor Equipment & Materials | |
| MarketCap: 1336.68 Millions | |
| Recent Price: 45.09 Smart Investing & Trading Score: 7 | |
| Day Percent Change: -2.56% Day Change: -1.19 | |
| Week Change: -4.09% Year-to-date Change: -17.6% | |
| KLIC Links: Profile News Message Board | |
| Charts:- Daily , Weekly | |
| Add KLIC to Watchlist: View: Get Complete KLIC Trend Analysis ➞ | |
 | NDLS Noodles & Company |
| Sector: Services & Goods | |
| SubSector: Restaurants | |
| MarketCap: 188.77 Millions | |
| Recent Price: 1.52 Smart Investing & Trading Score: 52 | |
| Day Percent Change: -2.56% Day Change: -0.04 | |
| Week Change: 8.57% Year-to-date Change: -51.8% | |
| NDLS Links: Profile News Message Board | |
| Charts:- Daily , Weekly | |
| Add NDLS to Watchlist: View: Get Complete NDLS Trend Analysis ➞ | |
 | SHAK Shake Shack Inc. |
| Sector: Services & Goods | |
| SubSector: Specialty Eateries | |
| MarketCap: 1497.67 Millions | |
| Recent Price: 103.11 Smart Investing & Trading Score: 27 | |
| Day Percent Change: -2.59% Day Change: -2.74 | |
| Week Change: -1.69% Year-to-date Change: 39.1% | |
| SHAK Links: Profile News Message Board | |
| Charts:- Daily , Weekly | |
| Add SHAK to Watchlist: View: Get Complete SHAK Trend Analysis ➞ | |
 | COHU Cohu, Inc. |
| Sector: Technology | |
| SubSector: Semiconductor Equipment & Materials | |
| MarketCap: 519.518 Millions | |
| Recent Price: 29.53 Smart Investing & Trading Score: 0 | |
| Day Percent Change: -2.61% Day Change: -0.79 | |
| Week Change: -4.99% Year-to-date Change: -16.6% | |
| COHU Links: Profile News Message Board | |
| Charts:- Daily , Weekly | |
| Add COHU to Watchlist: View: Get Complete COHU Trend Analysis ➞ | |
 | FORM FormFactor, Inc. |
| Sector: Technology | |
| SubSector: Semiconductor - Broad Line | |
| MarketCap: 1426.42 Millions | |
| Recent Price: 43.42 Smart Investing & Trading Score: 33 | |
| Day Percent Change: -2.62% Day Change: -1.17 | |
| Week Change: -2.97% Year-to-date Change: 4.1% | |
| FORM Links: Profile News Message Board | |
| Charts:- Daily , Weekly | |
| Add FORM to Watchlist: View: Get Complete FORM Trend Analysis ➞ | |
 | DIOD Diodes Incorporated |
| Sector: Technology | |
| SubSector: Semiconductor - Integrated Circuits | |
| MarketCap: 1967.6 Millions | |
| Recent Price: 71.10 Smart Investing & Trading Score: 68 | |
| Day Percent Change: -2.62% Day Change: -1.91 | |
| Week Change: -2.17% Year-to-date Change: -11.7% | |
| DIOD Links: Profile News Message Board | |
| Charts:- Daily , Weekly | |
| Add DIOD to Watchlist: View: Get Complete DIOD Trend Analysis ➞ | |
 | HEAR Turtle Beach Corporation |
| Sector: Technology | |
| SubSector: Communication Equipment | |
| MarketCap: 73.0539 Millions | |
| Recent Price: 13.73 Smart Investing & Trading Score: 41 | |
| Day Percent Change: -2.62% Day Change: -0.37 | |
| Week Change: -2.9% Year-to-date Change: 25.4% | |
| HEAR Links: Profile News Message Board | |
| Charts:- Daily , Weekly | |
| Add HEAR to Watchlist: View: Get Complete HEAR Trend Analysis ➞ | |
 | SM SM Energy Company |
| Sector: Energy | |
| SubSector: Independent Oil & Gas | |
| MarketCap: 137.593 Millions | |
| Recent Price: 47.22 Smart Investing & Trading Score: 31 | |
| Day Percent Change: -2.63% Day Change: -1.27 | |
| Week Change: -7.13% Year-to-date Change: 21.9% | |
| SM Links: Profile News Message Board | |
| Charts:- Daily , Weekly | |
| Add SM to Watchlist: View: Get Complete SM Trend Analysis ➞ | |
 | MPB Mid Penn Bancorp, Inc. |
| Sector: Financials | |
| SubSector: Regional - Northeast Banks | |
| MarketCap: 187.699 Millions | |
| Recent Price: 20.19 Smart Investing & Trading Score: 42 | |
| Day Percent Change: -2.63% Day Change: -0.54 | |
| Week Change: -3.21% Year-to-date Change: -16.9% | |
| MPB Links: Profile News Message Board | |
| Charts:- Daily , Weekly | |
| Add MPB to Watchlist: View: Get Complete MPB Trend Analysis ➞ | |
 | XFOR X4 Pharmaceuticals, Inc. |
| Sector: Health Care | |
| SubSector: Biotechnology | |
| MarketCap: 143.385 Millions | |
| Recent Price: 1.09 Smart Investing & Trading Score: 31 | |
| Day Percent Change: -2.68% Day Change: -0.03 | |
| Week Change: -6.44% Year-to-date Change: 30.0% | |
| XFOR Links: Profile News Message Board | |
| Charts:- Daily , Weekly | |
| Add XFOR to Watchlist: View: Get Complete XFOR Trend Analysis ➞ | |
 | BWMN Bowman Consulting Group Ltd. |
| Sector: Industrials | |
| SubSector: Engineering & Construction | |
| MarketCap: 443 Millions | |
| Recent Price: 31.62 Smart Investing & Trading Score: 22 | |
| Day Percent Change: -2.68% Day Change: -0.87 | |
| Week Change: -4.04% Year-to-date Change: -10.2% | |
| BWMN Links: Profile News Message Board | |
| Charts:- Daily , Weekly | |
| Add BWMN to Watchlist: View: Get Complete BWMN Trend Analysis ➞ | |
 | SAVE Spirit Airlines, Inc. |
| Sector: Transports | |
| SubSector: Major Airlines | |
| MarketCap: 885 Millions | |
| Recent Price: 3.44 Smart Investing & Trading Score: 20 | |
| Day Percent Change: -2.69% Day Change: -0.09 | |
| Week Change: -2.97% Year-to-date Change: -79.0% | |
| SAVE Links: Profile News Message Board | |
| Charts:- Daily , Weekly | |
| Add SAVE to Watchlist: View: Get Complete SAVE Trend Analysis ➞ | |
 | MTSI MACOM Technology Solutions Holdings, Inc. |
| Sector: Technology | |
| SubSector: Semiconductor - Broad Line | |
| MarketCap: 1214.42 Millions | |
| Recent Price: 99.11 Smart Investing & Trading Score: 41 | |
| Day Percent Change: -2.78% Day Change: -2.84 | |
| Week Change: -2.55% Year-to-date Change: 6.6% | |
| MTSI Links: Profile News Message Board | |
| Charts:- Daily , Weekly | |
| Add MTSI to Watchlist: View: Get Complete MTSI Trend Analysis ➞ | |
| For tabular summary view of above stock list: Summary View ➞ 0 - 25 , 25 - 50 , 50 - 75 , 75 - 100 , 100 - 125 , 125 - 150 , 150 - 175 , 175 - 200 , 200 - 225 , 225 - 250 , 250 - 275 , 275 - 300 , 300 - 325 , 325 - 350 , 350 - 375 , 375 - 400 , 400 - 425 , 425 - 450 , 450 - 475 , 475 - 500 , 500 - 525 , 525 - 550 , 550 - 575 , 575 - 600 , 600 - 625 , 625 - 650 , 650 - 675 , 675 - 700 , 700 - 725 , 725 - 750 , 750 - 775 , 775 - 800 , 800 - 825 , 825 - 850 , 850 - 875 , 875 - 900 , 900 - 925 , 925 - 950 , 950 - 975 , 975 - 1000 , 1000 - 1025 , 1025 - 1050 , 1050 - 1075 , 1075 - 1100 , 1100 - 1125 , 1125 - 1150 , 1150 - 1175 , 1175 - 1200 , 1200 - 1225 , 1225 - 1250 , 1250 - 1275 , 1275 - 1300 , 1300 - 1325 , 1325 - 1350 , 1350 - 1375 , 1375 - 1400 , 1400 - 1425 , 1425 - 1450 , 1450 - 1475 , 1475 - 1500 , 1500 - 1525 , 1525 - 1550 , 1550 - 1575 | ||
| Click To Change The Sort Order: By Market Cap or Company Size Performance: Year-to-date, Week and Day | |
| Select Chart Type: | ||
| Too many stocks? View smallcap stocks filtered by marketcap & sector |
| Marketcap: All SmallCap Stocks (default-no microcap), Large, Mid-Range, Small & MicroCap |
| Sector: Tech, Finance, Energy, Staples, Retail, Industrial, Materials, Utilities & Medical |
|
Best Stocks Today 12Stocks.com |
© 2024 12Stocks.com Terms & Conditions Privacy Contact Us
All Information Provided Only For Education And Not To Be Used For Investing or Trading. See Terms & Conditions


One More Thing ... Get Best Stocks Delivered Daily!
Never Ever Miss A Move With Our Top Ten Stocks Lists
Find Best Stocks In Any Market - Bull or Bear Market
Take A Peek At Our Top Ten Stocks Lists: Daily, Weekly, Year-to-Date & Top Trends
Find Best Stocks In Any Market - Bull or Bear Market
Take A Peek At Our Top Ten Stocks Lists: Daily, Weekly, Year-to-Date & Top Trends
Smallcap Stocks With Best Up Trends [0-bearish to 100-bullish]: Surmodics [100], TransMedics Group[100], Rocky Brands[100], A10 s[100], UFP [100], Conduent [100], LendingClub [100], Xencor [100], Luxfer [100], TPG RE[100], PROCEPT BioRobotics[100]
Best Smallcap Stocks Year-to-Date:
Janux [426.11%], Viking [309.94%], Longboard [240.1%], Alpine Immune[239.26%], Cullinan Oncology[174.84%], Avidity Biosciences[167.7%], Vera [165.02%], Bakkt [157.85%], Super Micro[147.95%], Hippo [138.75%], Trevi [118.66%] Best Smallcap Stocks This Week:
Poseida [32.63%], P3 Health[31.62%], Phibro Animal[31.42%], Seres [29.7%], TransMedics Group[28.76%], Cue Biopharma[27.11%], LendingTree [25.75%], Surmodics [24.11%], Harmonic [21.25%], Conduent [19.61%], Eyenovia [19.55%] Best Smallcap Stocks Daily:
Surmodics [26.43%], TransMedics Group[25.95%], Powell Industries[22.27%], Rocky Brands[22.16%], Inari Medical[18.51%], A10 s[18.34%], Ventyx Biosciences[16.91%], Poseida [16.74%], UFP [16.54%], Conduent [16.19%], LendingClub [15.96%]