
 Login Sign Up


| |||||
 |  | ||||

| 12Stocks.com Market Intelligence |
Best SmallCap Stocks
|
| In a hurry? Small Cap Stock Lists: Performance Trends Table, Stock Charts
Sort Small Cap stocks: Daily, Weekly, Year-to-Date, Market Cap & Trends. Filter Small Cap stocks list by sector: Show all, Tech, Finance, Energy, Staples, Retail, Industrial, Materials, Utilities and HealthCare Filter Small Cap stocks list by size: All Large Medium Small and MicroCap |
| 12Stocks.com Small Cap Stocks Performances & Trends Daily | |||||||||
|
|  The overall Smart Investing & Trading Score is 14 (0-bearish to 100-bullish) which puts Small Cap index in short term bearish trend. The Smart Investing & Trading Score from previous trading session is 41 and hence a deterioration of trend.
| ||||||||
Here are the Smart Investing & Trading Scores of the most requested small cap stocks at 12Stocks.com (click stock name for detailed review):
|


| 12Stocks.com: Investing in Smallcap Index with Stocks | |
|
The following table helps investors and traders sort through current performance and trends (as measured by Smart Investing & Trading Score) of various
stocks in the Smallcap Index. Quick View: Move mouse or cursor over stock symbol (ticker) to view short-term technical chart and over stock name to view long term chart. Click on  to add stock symbol to your watchlist and to add stock symbol to your watchlist and  to view watchlist. Click on any ticker or stock name for detailed market intelligence report for that stock. to view watchlist. Click on any ticker or stock name for detailed market intelligence report for that stock. |
12Stocks.com Performance of Stocks in Smallcap Index
| Ticker | Stock Name | Watchlist | Category | Recent Price | Smart Investing & Trading Score | Change % | YTD Change% |
| MCRB | Seres |   | Health Care | 1.08 | 74 | 9.02 | -22.86% |
| DHX | DHI Group | | Services & Goods | 2.55 | 47 | 8.97 | -1.54% |
| NRIX | Nurix | | Health Care | 13.08 | 68 | 8.82 | 26.62% |
| WKHS | Workhorse Group | | Consumer Staples | 0.16 | 42 | 8.80 | -54.31% |
| RXST | RxSight | | Health Care | 56.67 | 95 | 8.80 | 41.29% |
| LUNA | Luna Innovations | | Technology | 2.23 | 42 | 8.50 | -66.39% |
| IMRX | Immuneering | | Health Care | 1.54 | 42 | 8.45 | -79.71% |
| YMAB | Y-mAbs | | Health Care | 16.49 | 64 | 8.42 | 141.79% |
| NAUT | Nautilus | | Health Care | 2.75 | 90 | 8.27 | -16.41% |
| DOCN | DigitalOcean | | Technology | 35.53 | 74 | 8.13 | -3.92% |
| SVRA | Savara | | Health Care | 4.95 | 49 | 8.08 | 5.32% |
| OMER | Omeros | | Health Care | 3.40 | 54 | 7.94 | 3.98% |
| COCO | Vita Coco | | Consumer Staples | 26.17 | 87 | 7.92 | 1.63% |
| NVAX | Novavax | | Health Care | 4.67 | 74 | 7.85 | -2.71% |
| BMEA | Biomea Fusion | | Health Care | 11.56 | 49 | 7.84 | -21.04% |
| KYMR | Kymera | | Health Care | 36.24 | 52 | 7.79 | 42.62% |
| ALLK | Allakos | | Health Care | 1.13 | 69 | 7.62 | -58.61% |
| GPRO | GoPro | | Consumer Staples | 1.86 | 74 | 7.51 | -46.40% |
| AMPX | Amprius | | Industrials | 2.01 | 74 | 7.49 | -59.88% |
| NVCT | Nuvectis Pharma | | Health Care | 6.54 | 35 | 7.48 | -20.98% |
| LYEL | Lyell Immunopharma | | Health Care | 2.33 | 37 | 7.37 | 18.58% |
| FHTX | Foghorn | | Health Care | 5.86 | 49 | 7.33 | -8.65% |
| KALV | KalVista | | Health Care | 12.18 | 64 | 7.31 | -0.57% |
| ZYXI | Zynex | | Health Care | 11.77 | 39 | 7.29 | 8.08% |
| SPRY | ARS | | Health Care | 9.32 | 90 | 7.25 | 63.94% |


| Too many stocks? View smallcap stocks filtered by marketcap & sector |
| Marketcap: All SmallCap Stocks (default-no microcap), Large, Mid-Range, Small |
| Smallcap Sector: Tech, Finance, Energy, Staples, Retail, Industrial, Materials, & Medical |
|
Get the most comprehensive stock market coverage daily at 12Stocks.com ➞ Best Stocks Today ➞ Best Stocks Weekly ➞ Best Stocks Year-to-Date ➞ Best Stocks Trends ➞  Best Stocks Today 12Stocks.com Best Nasdaq Stocks ➞ Best S&P 500 Stocks ➞ Best Tech Stocks ➞ Best Biotech Stocks ➞ |
| Detailed Overview of SmallCap Stocks |
| SmallCap Technical Overview, Leaders & Laggards, Top SmallCap ETF Funds & Detailed SmallCap Stocks List, Charts, Trends & More |
| Smallcap: Technical Analysis, Trends & YTD Performance | |
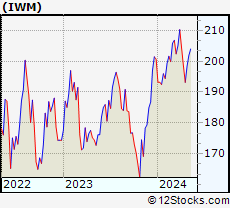
| SmallCap segment as represented by
IWM, an exchange-traded fund [ETF], holds basket of thousands of smallcap stocks from across all major sectors of the US stock market. The smallcap index (contains stocks like Riverbed & Sotheby's) is down by -2.19% and is currently underperforming the overall market by -6.73% year-to-date. Below is a quick view of technical charts and trends: | |
 IWM Weekly Chart |
|
| Long Term Trend: Not Good | |
| Medium Term Trend: Not Good | |
 IWM Daily Chart |
|
| Short Term Trend: Not Good | |
| Overall Trend Score: 14 | |
| YTD Performance: -2.19% | |
| **Trend Scores & Views Are Only For Educational Purposes And Not For Investing | |
| 12Stocks.com: Top Performing Small Cap Index Stocks | ||||||||||||||||||||||||||||||||||||||||||||||||
 The top performing Small Cap Index stocks year to date are
Now, more recently, over last week, the top performing Small Cap Index stocks on the move are


|
||||||||||||||||||||||||||||||||||||||||||||||||
| 12Stocks.com: Investing in Smallcap Index using Exchange Traded Funds | |
|
The following table shows list of key exchange traded funds (ETF) that
help investors track Smallcap index. The following list also includes leveraged ETF funds that track twice or thrice the daily returns of Smallcap indices. Short or inverse ETF funds move in the opposite direction to the index they track and are useful during market pullbacks or during bear markets. Quick View: Move mouse or cursor over ETF symbol (ticker) to view short-term technical chart and over ETF name to view long term chart. Click on ticker or stock name for detailed view. Click on to add stock symbol to your watchlist and to view watchlist. |
12Stocks.com List of ETFs that track Smallcap Index
| Ticker | ETF Name | Watchlist | Recent Price | Smart Investing & Trading Score | Change % | Week % | Year-to-date % |
| IWM | iShares Russell 2000 | | 196.31 | 14 | 0.21 | -1.05 | -2.19% |
| IJR | iShares Core S&P Small-Cap | | 104.74 | 22 | 0.34 | -0.86 | -3.24% |
| VTWO | Vanguard Russell 2000 ETF | | 79.36 | 14 | 0.25 | -1.07 | -2.15% |
| IWN | iShares Russell 2000 Value | | 149.82 | 22 | 0.52 | -0.87 | -3.55% |
| IJS | iShares S&P Small-Cap 600 Value | | 96.40 | 15 | 0.33 | -0.81 | -6.47% |
| IWO | iShares Russell 2000 Growth | | 249.58 | 7 | -0.30 | -1.39 | -1.05% |
| IJT | iShares S&P Small-Cap 600 Growth | | 124.94 | 15 | 0.27 | -0.91 | -0.16% |
| XSLV | PowerShares S&P SmallCap Low Volatil ETF | | 42.83 | 52 | 0.68 | 0.26 | -2.99% |
| SDD | ProShares UltraShort SmallCap600 | | 19.71 | 78 | 0.70 | 1.85 | 6.95% |
| SMLV | SPDR SSGA US Small Cap Low Volatil ETF | | 107.44 | 40 | 1.11 | -0.07 | -4.51% |
| SBB | ProShares Short SmallCap600 | | 16.56 | 71 | 0.05 | 1.06 | 3.94% |
| SAA | ProShares Ultra SmallCap600 | | 22.58 | 8 | -0.08 | -1.99 | -9.49% |
| 12Stocks.com: Charts, Trends, Fundamental Data and Performances of SmallCap Stocks | |
|
We now take in-depth look at all SmallCap stocks including charts, multi-period performances and overall trends (as measured by Smart Investing & Trading Score). One can sort SmallCap stocks (click link to choose) by Daily, Weekly and by Year-to-Date performances. Also, one can sort by size of the company or by market capitalization. |
| Select Your Default Chart Type: | |||||
| |||||
| Click on stock symbol or name for detailed view. Click on to add stock symbol to your watchlist and to view watchlist. Quick View: Move mouse or cursor over "Daily" to quickly view daily technical stock chart and over "Weekly" to view weekly technical stock chart. | |||||

 | MCRB Seres Therapeutics, Inc. |
| Sector: Health Care | |
| SubSector: Biotechnology | |
| MarketCap: 217.585 Millions | |
| Recent Price: 1.08 Smart Investing & Trading Score: 74 | |
| Day Percent Change: 9.02% Day Change: 0.09 | |
| Week Change: 30.91% Year-to-date Change: -22.9% | |
| MCRB Links: Profile News Message Board | |
| Charts:- Daily , Weekly | |
| Add MCRB to Watchlist: View: Get Complete MCRB Trend Analysis ➞ | |
 | DHX DHI Group, Inc. |
| Sector: Services & Goods | |
| SubSector: Staffing & Outsourcing Services | |
| MarketCap: 144.728 Millions | |
| Recent Price: 2.55 Smart Investing & Trading Score: 47 | |
| Day Percent Change: 8.97% Day Change: 0.21 | |
| Week Change: 0.39% Year-to-date Change: -1.5% | |
| DHX Links: Profile News Message Board | |
| Charts:- Daily , Weekly | |
| Add DHX to Watchlist: View: Get Complete DHX Trend Analysis ➞ | |
 | NRIX Nurix Therapeutics, Inc. |
| Sector: Health Care | |
| SubSector: Biotechnology | |
| MarketCap: 16787 Millions | |
| Recent Price: 13.08 Smart Investing & Trading Score: 68 | |
| Day Percent Change: 8.82% Day Change: 1.06 | |
| Week Change: 5.83% Year-to-date Change: 26.6% | |
| NRIX Links: Profile News Message Board | |
| Charts:- Daily , Weekly | |
| Add NRIX to Watchlist: View: Get Complete NRIX Trend Analysis ➞ | |
 | WKHS Workhorse Group Inc. |
| Sector: Consumer Staples | |
| SubSector: Auto Parts | |
| MarketCap: 129.839 Millions | |
| Recent Price: 0.16 Smart Investing & Trading Score: 42 | |
| Day Percent Change: 8.80% Day Change: 0.01 | |
| Week Change: 4.78% Year-to-date Change: -54.3% | |
| WKHS Links: Profile News Message Board | |
| Charts:- Daily , Weekly | |
| Add WKHS to Watchlist: View: Get Complete WKHS Trend Analysis ➞ | |
 | RXST RxSight, Inc. |
| Sector: Health Care | |
| SubSector: Medical Devices | |
| MarketCap: 893 Millions | |
| Recent Price: 56.67 Smart Investing & Trading Score: 95 | |
| Day Percent Change: 8.80% Day Change: 4.59 | |
| Week Change: 7.43% Year-to-date Change: 41.3% | |
| RXST Links: Profile News Message Board | |
| Charts:- Daily , Weekly | |
| Add RXST to Watchlist: View: Get Complete RXST Trend Analysis ➞ | |
 | LUNA Luna Innovations Incorporated |
| Sector: Technology | |
| SubSector: Scientific & Technical Instruments | |
| MarketCap: 166.353 Millions | |
| Recent Price: 2.23 Smart Investing & Trading Score: 42 | |
| Day Percent Change: 8.50% Day Change: 0.17 | |
| Week Change: 12.31% Year-to-date Change: -66.4% | |
| LUNA Links: Profile News Message Board | |
| Charts:- Daily , Weekly | |
| Add LUNA to Watchlist: View: Get Complete LUNA Trend Analysis ➞ | |
 | IMRX Immuneering Corporation |
| Sector: Health Care | |
| SubSector: Biotechnology | |
| MarketCap: 303 Millions | |
| Recent Price: 1.54 Smart Investing & Trading Score: 42 | |
| Day Percent Change: 8.45% Day Change: 0.12 | |
| Week Change: 4.76% Year-to-date Change: -79.7% | |
| IMRX Links: Profile News Message Board | |
| Charts:- Daily , Weekly | |
| Add IMRX to Watchlist: View: Get Complete IMRX Trend Analysis ➞ | |
 | YMAB Y-mAbs Therapeutics, Inc. |
| Sector: Health Care | |
| SubSector: Biotechnology | |
| MarketCap: 899.585 Millions | |
| Recent Price: 16.49 Smart Investing & Trading Score: 64 | |
| Day Percent Change: 8.42% Day Change: 1.28 | |
| Week Change: 12.1% Year-to-date Change: 141.8% | |
| YMAB Links: Profile News Message Board | |
| Charts:- Daily , Weekly | |
| Add YMAB to Watchlist: View: Get Complete YMAB Trend Analysis ➞ | |
 | NAUT Nautilus Biotechnology, Inc. |
| Sector: Health Care | |
| SubSector: Biotechnology | |
| MarketCap: 458 Millions | |
| Recent Price: 2.75 Smart Investing & Trading Score: 90 | |
| Day Percent Change: 8.27% Day Change: 0.21 | |
| Week Change: 10.44% Year-to-date Change: -16.4% | |
| NAUT Links: Profile News Message Board | |
| Charts:- Daily , Weekly | |
| Add NAUT to Watchlist: View: Get Complete NAUT Trend Analysis ➞ | |
 | DOCN DigitalOcean Holdings, Inc. |
| Sector: Technology | |
| SubSector: Software - Infrastructure | |
| MarketCap: 3620 Millions | |
| Recent Price: 35.53 Smart Investing & Trading Score: 74 | |
| Day Percent Change: 8.13% Day Change: 2.67 | |
| Week Change: 6.03% Year-to-date Change: -3.9% | |
| DOCN Links: Profile News Message Board | |
| Charts:- Daily , Weekly | |
| Add DOCN to Watchlist: View: Get Complete DOCN Trend Analysis ➞ | |
 | SVRA Savara Inc. |
| Sector: Health Care | |
| SubSector: Biotechnology | |
| MarketCap: 80.3785 Millions | |
| Recent Price: 4.95 Smart Investing & Trading Score: 49 | |
| Day Percent Change: 8.08% Day Change: 0.37 | |
| Week Change: 12.24% Year-to-date Change: 5.3% | |
| SVRA Links: Profile News Message Board | |
| Charts:- Daily , Weekly | |
| Add SVRA to Watchlist: View: Get Complete SVRA Trend Analysis ➞ | |
 | OMER Omeros Corporation |
| Sector: Health Care | |
| SubSector: Biotechnology | |
| MarketCap: 759.585 Millions | |
| Recent Price: 3.40 Smart Investing & Trading Score: 54 | |
| Day Percent Change: 7.94% Day Change: 0.25 | |
| Week Change: 7.94% Year-to-date Change: 4.0% | |
| OMER Links: Profile News Message Board | |
| Charts:- Daily , Weekly | |
| Add OMER to Watchlist: View: Get Complete OMER Trend Analysis ➞ | |
 | COCO The Vita Coco Company, Inc. |
| Sector: Consumer Staples | |
| SubSector: Beverages - Non-Alcoholic | |
| MarketCap: 1510 Millions | |
| Recent Price: 26.17 Smart Investing & Trading Score: 87 | |
| Day Percent Change: 7.92% Day Change: 1.92 | |
| Week Change: 5.82% Year-to-date Change: 1.6% | |
| COCO Links: Profile News Message Board | |
| Charts:- Daily , Weekly | |
| Add COCO to Watchlist: View: Get Complete COCO Trend Analysis ➞ | |
 | NVAX Novavax, Inc. |
| Sector: Health Care | |
| SubSector: Biotechnology | |
| MarketCap: 376.185 Millions | |
| Recent Price: 4.67 Smart Investing & Trading Score: 74 | |
| Day Percent Change: 7.85% Day Change: 0.34 | |
| Week Change: 14.18% Year-to-date Change: -2.7% | |
| NVAX Links: Profile News Message Board | |
| Charts:- Daily , Weekly | |
| Add NVAX to Watchlist: View: Get Complete NVAX Trend Analysis ➞ | |
 | BMEA Biomea Fusion, Inc. |
| Sector: Health Care | |
| SubSector: Biotechnology | |
| MarketCap: 818 Millions | |
| Recent Price: 11.56 Smart Investing & Trading Score: 49 | |
| Day Percent Change: 7.84% Day Change: 0.84 | |
| Week Change: 7.34% Year-to-date Change: -21.0% | |
| BMEA Links: Profile News Message Board | |
| Charts:- Daily , Weekly | |
| Add BMEA to Watchlist: View: Get Complete BMEA Trend Analysis ➞ | |
 | KYMR Kymera Therapeutics, Inc. |
| Sector: Health Care | |
| SubSector: Biotechnology | |
| MarketCap: 27087 Millions | |
| Recent Price: 36.24 Smart Investing & Trading Score: 52 | |
| Day Percent Change: 7.79% Day Change: 2.62 | |
| Week Change: 8.6% Year-to-date Change: 42.6% | |
| KYMR Links: Profile News Message Board | |
| Charts:- Daily , Weekly | |
| Add KYMR to Watchlist: View: Get Complete KYMR Trend Analysis ➞ | |
 | ALLK Allakos Inc. |
| Sector: Health Care | |
| SubSector: Biotechnology | |
| MarketCap: 3233.55 Millions | |
| Recent Price: 1.13 Smart Investing & Trading Score: 69 | |
| Day Percent Change: 7.62% Day Change: 0.08 | |
| Week Change: 10.78% Year-to-date Change: -58.6% | |
| ALLK Links: Profile News Message Board | |
| Charts:- Daily , Weekly | |
| Add ALLK to Watchlist: View: Get Complete ALLK Trend Analysis ➞ | |
 | GPRO GoPro, Inc. |
| Sector: Consumer Staples | |
| SubSector: Photographic Equipment & Supplies | |
| MarketCap: 475.925 Millions | |
| Recent Price: 1.86 Smart Investing & Trading Score: 74 | |
| Day Percent Change: 7.51% Day Change: 0.13 | |
| Week Change: 7.51% Year-to-date Change: -46.4% | |
| GPRO Links: Profile News Message Board | |
| Charts:- Daily , Weekly | |
| Add GPRO to Watchlist: View: Get Complete GPRO Trend Analysis ➞ | |
 | AMPX Amprius Technologies, Inc. |
| Sector: Industrials | |
| SubSector: Electrical Equipment & Parts | |
| MarketCap: 608 Millions | |
| Recent Price: 2.01 Smart Investing & Trading Score: 74 | |
| Day Percent Change: 7.49% Day Change: 0.14 | |
| Week Change: 15.52% Year-to-date Change: -59.9% | |
| AMPX Links: Profile News Message Board | |
| Charts:- Daily , Weekly | |
| Add AMPX to Watchlist: View: Get Complete AMPX Trend Analysis ➞ | |
 | NVCT Nuvectis Pharma, Inc. |
| Sector: Health Care | |
| SubSector: Biotechnology | |
| MarketCap: 258 Millions | |
| Recent Price: 6.54 Smart Investing & Trading Score: 35 | |
| Day Percent Change: 7.48% Day Change: 0.46 | |
| Week Change: 0.54% Year-to-date Change: -21.0% | |
| NVCT Links: Profile News Message Board | |
| Charts:- Daily , Weekly | |
| Add NVCT to Watchlist: View: Get Complete NVCT Trend Analysis ➞ | |
 | LYEL Lyell Immunopharma, Inc. |
| Sector: Health Care | |
| SubSector: Biotechnology | |
| MarketCap: 809 Millions | |
| Recent Price: 2.33 Smart Investing & Trading Score: 37 | |
| Day Percent Change: 7.37% Day Change: 0.16 | |
| Week Change: 7.62% Year-to-date Change: 18.6% | |
| LYEL Links: Profile News Message Board | |
| Charts:- Daily , Weekly | |
| Add LYEL to Watchlist: View: Get Complete LYEL Trend Analysis ➞ | |
 | FHTX Foghorn Therapeutics Inc. |
| Sector: Health Care | |
| SubSector: Biotechnology | |
| MarketCap: 74487 Millions | |
| Recent Price: 5.86 Smart Investing & Trading Score: 49 | |
| Day Percent Change: 7.33% Day Change: 0.40 | |
| Week Change: 6.74% Year-to-date Change: -8.7% | |
| FHTX Links: Profile News Message Board | |
| Charts:- Daily , Weekly | |
| Add FHTX to Watchlist: View: Get Complete FHTX Trend Analysis ➞ | |
 | KALV KalVista Pharmaceuticals, Inc. |
| Sector: Health Care | |
| SubSector: Biotechnology | |
| MarketCap: 138.385 Millions | |
| Recent Price: 12.18 Smart Investing & Trading Score: 64 | |
| Day Percent Change: 7.31% Day Change: 0.83 | |
| Week Change: 12.99% Year-to-date Change: -0.6% | |
| KALV Links: Profile News Message Board | |
| Charts:- Daily , Weekly | |
| Add KALV to Watchlist: View: Get Complete KALV Trend Analysis ➞ | |
 | ZYXI Zynex, Inc. |
| Sector: Health Care | |
| SubSector: Medical Appliances & Equipment | |
| MarketCap: 388.58 Millions | |
| Recent Price: 11.77 Smart Investing & Trading Score: 39 | |
| Day Percent Change: 7.29% Day Change: 0.80 | |
| Week Change: 5% Year-to-date Change: 8.1% | |
| ZYXI Links: Profile News Message Board | |
| Charts:- Daily , Weekly | |
| Add ZYXI to Watchlist: View: Get Complete ZYXI Trend Analysis ➞ | |
 | SPRY ARS Pharmaceuticals, Inc. |
| Sector: Health Care | |
| SubSector: Biotechnology | |
| MarketCap: 632 Millions | |
| Recent Price: 9.32 Smart Investing & Trading Score: 90 | |
| Day Percent Change: 7.25% Day Change: 0.63 | |
| Week Change: 11.48% Year-to-date Change: 63.9% | |
| SPRY Links: Profile News Message Board | |
| Charts:- Daily , Weekly | |
| Add SPRY to Watchlist: View: Get Complete SPRY Trend Analysis ➞ | |
| Too many stocks? View smallcap stocks filtered by marketcap & sector |
| Marketcap: All SmallCap Stocks (default-no microcap), Large, Mid-Range, Small & MicroCap |
| Sector: Tech, Finance, Energy, Staples, Retail, Industrial, Materials, Utilities & Medical |
|
Best Stocks Today 12Stocks.com |
© 2024 12Stocks.com Terms & Conditions Privacy Contact Us
All Information Provided Only For Education And Not To Be Used For Investing or Trading. See Terms & Conditions


One More Thing ... Get Best Stocks Delivered Daily!
Never Ever Miss A Move With Our Top Ten Stocks Lists
Find Best Stocks In Any Market - Bull or Bear Market
Take A Peek At Our Top Ten Stocks Lists: Daily, Weekly, Year-to-Date & Top Trends
Find Best Stocks In Any Market - Bull or Bear Market
Take A Peek At Our Top Ten Stocks Lists: Daily, Weekly, Year-to-Date & Top Trends
Smallcap Stocks With Best Up Trends [0-bearish to 100-bullish]: Surmodics [100], Rocky Brands[100], TransMedics Group[100], LendingClub [100], Summit [100], A10 s[100], Carpenter [100], UFP [100], PROCEPT BioRobotics[100], Xencor [100], Trinity Industries[100]
Best Smallcap Stocks Year-to-Date:
Janux [441.55%], Viking [310.69%], Longboard [259.25%], Alpine Immune[239.29%], Avidity Biosciences[185.4%], Bakkt [182.96%], Cullinan Oncology[175.33%], Arcutis Bio[173.68%], Vera [173.32%], Super Micro[159.73%], Y-mAbs [141.79%] Best Smallcap Stocks This Week:
Deciphera [73.11%], Eyenovia [45.65%], Cue Biopharma[39.56%], Seres [30.91%], Poseida [30.05%], P3 Health[29.62%], Phibro Animal[28.44%], TransMedics Group[27.72%], Surmodics [27.36%], LendingTree [26.36%], Rocky Brands[24.92%] Best Smallcap Stocks Daily:
Surmodics [29.74%], Rocky Brands[28.41%], TransMedics Group[24.93%], Ventyx Biosciences[24.63%], Eyenovia [21.84%], LendingClub [19.68%], Summit [19.59%], Powell Industries[18.89%], MiMedx Group[18.67%], CareDx [18.30%], A10 s[17.69%]