
 Login Sign Up


| |||||
 |  | ||||

| 12Stocks.com Market Intelligence |
Best SmallCap Stocks
|
| In a hurry? Small Cap Stock Lists: Performance Trends Table, Stock Charts
Sort Small Cap stocks: Daily, Weekly, Year-to-Date, Market Cap & Trends. Filter Small Cap stocks list by sector: Show all, Tech, Finance, Energy, Staples, Retail, Industrial, Materials, Utilities and HealthCare Filter Small Cap stocks list by size: All Large Medium Small and MicroCap |
| 12Stocks.com Small Cap Stocks Performances & Trends Daily | |||||||||
|
|  The overall Smart Investing & Trading Score is 14 (0-bearish to 100-bullish) which puts Small Cap index in short term bearish trend. The Smart Investing & Trading Score from previous trading session is 41 and hence a deterioration of trend.
| ||||||||
Here are the Smart Investing & Trading Scores of the most requested small cap stocks at 12Stocks.com (click stock name for detailed review):
|


| 12Stocks.com: Investing in Smallcap Index with Stocks | |
|
The following table helps investors and traders sort through current performance and trends (as measured by Smart Investing & Trading Score) of various
stocks in the Smallcap Index. Quick View: Move mouse or cursor over stock symbol (ticker) to view short-term technical chart and over stock name to view long term chart. Click on  to add stock symbol to your watchlist and to add stock symbol to your watchlist and  to view watchlist. Click on any ticker or stock name for detailed market intelligence report for that stock. to view watchlist. Click on any ticker or stock name for detailed market intelligence report for that stock. |
12Stocks.com Performance of Stocks in Smallcap Index
| Ticker | Stock Name | Watchlist | Category | Recent Price | Smart Investing & Trading Score | Change % | YTD Change% |
| PLCE | Children s |   | Services & Goods | 6.72 | 10 | -3.45 | -71.06% |
| MSTR | MicroStrategy | | Technology | 1028.27 | 13 | -3.45 | 62.80% |
| TLYS | Tilly s | | Services & Goods | 5.86 | 17 | -3.46 | -22.28% |
| SNFCA | Security National | | Financials | 6.50 | 0 | -3.49 | -27.78% |
| GRNT | Granite Ridge | | Energy | 6.29 | 36 | -3.53 | 4.31% |
| CRDO | Credo | | Technology | 17.23 | 7 | -3.53 | -11.91% |
| BRZE | Braze | | Technology | 40.39 | 17 | -3.53 | -24.14% |
| ACCD | Accolade | | Health Care | 7.36 | 0 | -3.54 | -38.77% |
| JBGS | JBG SMITH | | Financials | 14.47 | 0 | -3.60 | -14.93% |
| ROCK | Gibraltar Industries | | Materials | 68.86 | 0 | -3.64 | -12.81% |
| AOSL | Alpha and | | Technology | 21.07 | 27 | -3.66 | -19.15% |
| UCTT | Ultra Clean | | Technology | 40.28 | 7 | -3.71 | 17.98% |
| CRGY | Crescent Energy | | Energy | 10.24 | 0 | -3.76 | -22.37% |
| RMBS | Rambus | | Technology | 52.75 | 0 | -3.78 | -22.71% |
| EGY | VAALCO Energy | | Energy | 6.15 | 36 | -3.91 | 36.97% |
| VSH | Vishay Inter | | Technology | 22.23 | 58 | -3.93 | -7.26% |
| VKTX | Viking | | Health Care | 76.43 | 59 | -3.96 | 310.69% |
| PAR | PAR | | Technology | 42.20 | 17 | -3.97 | -3.08% |
| PRTS | U.S. Auto | | Consumer Staples | 1.20 | 25 | -4.00 | -62.03% |
| UIS | Unisys | | Technology | 5.21 | 15 | -4.05 | -7.30% |
| BOOT | Boot Barn | | Services & Goods | 102.06 | 58 | -4.14 | 32.96% |
| KLIC | Kulicke and | | Technology | 44.36 | 0 | -4.15 | -18.93% |
| MED | Medifast | | Services & Goods | 26.36 | 10 | -4.25 | -60.79% |
| BRCC | BRC | | Consumer Staples | 3.73 | 5 | -4.36 | 2.47% |
| CRK | Comstock Resources | | Energy | 9.77 | 63 | -4.40 | 10.40% |


| Too many stocks? View smallcap stocks filtered by marketcap & sector |
| Marketcap: All SmallCap Stocks (default-no microcap), Large, Mid-Range, Small |
| Smallcap Sector: Tech, Finance, Energy, Staples, Retail, Industrial, Materials, & Medical |
|
Get the most comprehensive stock market coverage daily at 12Stocks.com ➞ Best Stocks Today ➞ Best Stocks Weekly ➞ Best Stocks Year-to-Date ➞ Best Stocks Trends ➞  Best Stocks Today 12Stocks.com Best Nasdaq Stocks ➞ Best S&P 500 Stocks ➞ Best Tech Stocks ➞ Best Biotech Stocks ➞ |
| Detailed Overview of SmallCap Stocks |
| SmallCap Technical Overview, Leaders & Laggards, Top SmallCap ETF Funds & Detailed SmallCap Stocks List, Charts, Trends & More |
| Smallcap: Technical Analysis, Trends & YTD Performance | |
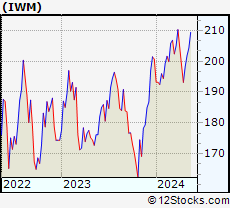
| SmallCap segment as represented by
IWM, an exchange-traded fund [ETF], holds basket of thousands of smallcap stocks from across all major sectors of the US stock market. The smallcap index (contains stocks like Riverbed & Sotheby's) is down by -2.19% and is currently underperforming the overall market by -6.73% year-to-date. Below is a quick view of technical charts and trends: | |
 IWM Weekly Chart |
|
| Long Term Trend: Not Good | |
| Medium Term Trend: Not Good | |
 IWM Daily Chart |
|
| Short Term Trend: Not Good | |
| Overall Trend Score: 14 | |
| YTD Performance: -2.19% | |
| **Trend Scores & Views Are Only For Educational Purposes And Not For Investing | |
| 12Stocks.com: Top Performing Small Cap Index Stocks | ||||||||||||||||||||||||||||||||||||||||||||||||
 The top performing Small Cap Index stocks year to date are
Now, more recently, over last week, the top performing Small Cap Index stocks on the move are


|
||||||||||||||||||||||||||||||||||||||||||||||||
| 12Stocks.com: Investing in Smallcap Index using Exchange Traded Funds | |
|
The following table shows list of key exchange traded funds (ETF) that
help investors track Smallcap index. The following list also includes leveraged ETF funds that track twice or thrice the daily returns of Smallcap indices. Short or inverse ETF funds move in the opposite direction to the index they track and are useful during market pullbacks or during bear markets. Quick View: Move mouse or cursor over ETF symbol (ticker) to view short-term technical chart and over ETF name to view long term chart. Click on ticker or stock name for detailed view. Click on to add stock symbol to your watchlist and to view watchlist. |
12Stocks.com List of ETFs that track Smallcap Index
| Ticker | ETF Name | Watchlist | Recent Price | Smart Investing & Trading Score | Change % | Week % | Year-to-date % |
| IWM | iShares Russell 2000 | | 196.31 | 14 | 0.21 | -1.05 | -2.19% |
| IJR | iShares Core S&P Small-Cap | | 104.74 | 22 | 0.34 | -0.86 | -3.24% |
| VTWO | Vanguard Russell 2000 ETF | | 79.36 | 14 | 0.25 | -1.07 | -2.15% |
| IWN | iShares Russell 2000 Value | | 149.82 | 22 | 0.52 | -0.87 | -3.55% |
| IJS | iShares S&P Small-Cap 600 Value | | 96.40 | 15 | 0.33 | -0.81 | -6.47% |
| IWO | iShares Russell 2000 Growth | | 249.58 | 7 | -0.30 | -1.39 | -1.05% |
| IJT | iShares S&P Small-Cap 600 Growth | | 124.94 | 15 | 0.27 | -0.91 | -0.16% |
| XSLV | PowerShares S&P SmallCap Low Volatil ETF | | 42.83 | 62 | 0.68 | 0.26 | -2.99% |
| SDD | ProShares UltraShort SmallCap600 | | 19.71 | 86 | 0.70 | 1.85 | 6.95% |
| SMLV | SPDR SSGA US Small Cap Low Volatil ETF | | 107.44 | 45 | 1.11 | -0.07 | -4.51% |
| SBB | ProShares Short SmallCap600 | | 16.56 | 79 | 0.05 | 1.06 | 3.94% |
| SAA | ProShares Ultra SmallCap600 | | 22.58 | 8 | -0.08 | -1.99 | -9.49% |
| 12Stocks.com: Charts, Trends, Fundamental Data and Performances of SmallCap Stocks | |
|
We now take in-depth look at all SmallCap stocks including charts, multi-period performances and overall trends (as measured by Smart Investing & Trading Score). One can sort SmallCap stocks (click link to choose) by Daily, Weekly and by Year-to-Date performances. Also, one can sort by size of the company or by market capitalization. |
| Select Your Default Chart Type: | |||||
| |||||
| Click on stock symbol or name for detailed view. Click on to add stock symbol to your watchlist and to view watchlist. Quick View: Move mouse or cursor over "Daily" to quickly view daily technical stock chart and over "Weekly" to view weekly technical stock chart. | |||||

 | PLCE The Children s Place, Inc. |
| Sector: Services & Goods | |
| SubSector: Apparel Stores | |
| MarketCap: 303.608 Millions | |
| Recent Price: 6.72 Smart Investing & Trading Score: 10 | |
| Day Percent Change: -3.45% Day Change: -0.24 | |
| Week Change: -5.22% Year-to-date Change: -71.1% | |
| PLCE Links: Profile News Message Board | |
| Charts:- Daily , Weekly | |
| Add PLCE to Watchlist: View: Get Complete PLCE Trend Analysis ➞ | |
 | MSTR MicroStrategy Incorporated |
| Sector: Technology | |
| SubSector: Application Software | |
| MarketCap: 1164.52 Millions | |
| Recent Price: 1028.27 Smart Investing & Trading Score: 13 | |
| Day Percent Change: -3.45% Day Change: -36.76 | |
| Week Change: -19.82% Year-to-date Change: 62.8% | |
| MSTR Links: Profile News Message Board | |
| Charts:- Daily , Weekly | |
| Add MSTR to Watchlist: View: Get Complete MSTR Trend Analysis ➞ | |
 | TLYS Tilly s, Inc. |
| Sector: Services & Goods | |
| SubSector: Apparel Stores | |
| MarketCap: 127.408 Millions | |
| Recent Price: 5.86 Smart Investing & Trading Score: 17 | |
| Day Percent Change: -3.46% Day Change: -0.21 | |
| Week Change: -2.5% Year-to-date Change: -22.3% | |
| TLYS Links: Profile News Message Board | |
| Charts:- Daily , Weekly | |
| Add TLYS to Watchlist: View: Get Complete TLYS Trend Analysis ➞ | |
 | SNFCA Security National Financial Corporation |
| Sector: Financials | |
| SubSector: Credit Services | |
| MarketCap: 81.0208 Millions | |
| Recent Price: 6.50 Smart Investing & Trading Score: 0 | |
| Day Percent Change: -3.49% Day Change: -0.24 | |
| Week Change: -3.27% Year-to-date Change: -27.8% | |
| SNFCA Links: Profile News Message Board | |
| Charts:- Daily , Weekly | |
| Add SNFCA to Watchlist: View: Get Complete SNFCA Trend Analysis ➞ | |
 | GRNT Granite Ridge Resources, Inc. |
| Sector: Energy | |
| SubSector: Oil & Gas E&P | |
| MarketCap: 890 Millions | |
| Recent Price: 6.29 Smart Investing & Trading Score: 36 | |
| Day Percent Change: -3.53% Day Change: -0.23 | |
| Week Change: -5.13% Year-to-date Change: 4.3% | |
| GRNT Links: Profile News Message Board | |
| Charts:- Daily , Weekly | |
| Add GRNT to Watchlist: View: Get Complete GRNT Trend Analysis ➞ | |
 | CRDO Credo Technology Group Holding Ltd |
| Sector: Technology | |
| SubSector: Communication Equipment | |
| MarketCap: 2590 Millions | |
| Recent Price: 17.23 Smart Investing & Trading Score: 7 | |
| Day Percent Change: -3.53% Day Change: -0.63 | |
| Week Change: -7.14% Year-to-date Change: -11.9% | |
| CRDO Links: Profile News Message Board | |
| Charts:- Daily , Weekly | |
| Add CRDO to Watchlist: View: Get Complete CRDO Trend Analysis ➞ | |
 | BRZE Braze, Inc. |
| Sector: Technology | |
| SubSector: Software - Application | |
| MarketCap: 4340 Millions | |
| Recent Price: 40.39 Smart Investing & Trading Score: 17 | |
| Day Percent Change: -3.53% Day Change: -1.48 | |
| Week Change: -3.19% Year-to-date Change: -24.1% | |
| BRZE Links: Profile News Message Board | |
| Charts:- Daily , Weekly | |
| Add BRZE to Watchlist: View: Get Complete BRZE Trend Analysis ➞ | |
 | ACCD Accolade, Inc. |
| Sector: Health Care | |
| SubSector: Health Information Services | |
| MarketCap: 32987 Millions | |
| Recent Price: 7.36 Smart Investing & Trading Score: 0 | |
| Day Percent Change: -3.54% Day Change: -0.27 | |
| Week Change: -6.72% Year-to-date Change: -38.8% | |
| ACCD Links: Profile News Message Board | |
| Charts:- Daily , Weekly | |
| Add ACCD to Watchlist: View: Get Complete ACCD Trend Analysis ➞ | |
 | JBGS JBG SMITH Properties |
| Sector: Financials | |
| SubSector: Property Management | |
| MarketCap: 4335.32 Millions | |
| Recent Price: 14.47 Smart Investing & Trading Score: 0 | |
| Day Percent Change: -3.60% Day Change: -0.54 | |
| Week Change: -4.36% Year-to-date Change: -14.9% | |
| JBGS Links: Profile News Message Board | |
| Charts:- Daily , Weekly | |
| Add JBGS to Watchlist: View: Get Complete JBGS Trend Analysis ➞ | |
 | ROCK Gibraltar Industries, Inc. |
| Sector: Materials | |
| SubSector: Steel & Iron | |
| MarketCap: 1341.08 Millions | |
| Recent Price: 68.86 Smart Investing & Trading Score: 0 | |
| Day Percent Change: -3.64% Day Change: -2.60 | |
| Week Change: -4.71% Year-to-date Change: -12.8% | |
| ROCK Links: Profile News Message Board | |
| Charts:- Daily , Weekly | |
| Add ROCK to Watchlist: View: Get Complete ROCK Trend Analysis ➞ | |
 | AOSL Alpha and Omega Semiconductor Limited |
| Sector: Technology | |
| SubSector: Semiconductor - Specialized | |
| MarketCap: 158.66 Millions | |
| Recent Price: 21.07 Smart Investing & Trading Score: 27 | |
| Day Percent Change: -3.66% Day Change: -0.80 | |
| Week Change: -5.05% Year-to-date Change: -19.2% | |
| AOSL Links: Profile News Message Board | |
| Charts:- Daily , Weekly | |
| Add AOSL to Watchlist: View: Get Complete AOSL Trend Analysis ➞ | |
 | UCTT Ultra Clean Holdings, Inc. |
| Sector: Technology | |
| SubSector: Semiconductor Equipment & Materials | |
| MarketCap: 528.518 Millions | |
| Recent Price: 40.28 Smart Investing & Trading Score: 7 | |
| Day Percent Change: -3.71% Day Change: -1.55 | |
| Week Change: -4% Year-to-date Change: 18.0% | |
| UCTT Links: Profile News Message Board | |
| Charts:- Daily , Weekly | |
| Add UCTT to Watchlist: View: Get Complete UCTT Trend Analysis ➞ | |
 | CRGY Crescent Energy Company |
| Sector: Energy | |
| SubSector: Oil & Gas E&P | |
| MarketCap: 1700 Millions | |
| Recent Price: 10.24 Smart Investing & Trading Score: 0 | |
| Day Percent Change: -3.76% Day Change: -0.40 | |
| Week Change: -5.45% Year-to-date Change: -22.4% | |
| CRGY Links: Profile News Message Board | |
| Charts:- Daily , Weekly | |
| Add CRGY to Watchlist: View: Get Complete CRGY Trend Analysis ➞ | |
 | RMBS Rambus Inc. |
| Sector: Technology | |
| SubSector: Semiconductor- Memory Chips | |
| MarketCap: 1296 Millions | |
| Recent Price: 52.75 Smart Investing & Trading Score: 0 | |
| Day Percent Change: -3.78% Day Change: -2.07 | |
| Week Change: -10.94% Year-to-date Change: -22.7% | |
| RMBS Links: Profile News Message Board | |
| Charts:- Daily , Weekly | |
| Add RMBS to Watchlist: View: Get Complete RMBS Trend Analysis ➞ | |
 | EGY VAALCO Energy, Inc. |
| Sector: Energy | |
| SubSector: Independent Oil & Gas | |
| MarketCap: 59.5593 Millions | |
| Recent Price: 6.15 Smart Investing & Trading Score: 36 | |
| Day Percent Change: -3.91% Day Change: -0.25 | |
| Week Change: -3.76% Year-to-date Change: 37.0% | |
| EGY Links: Profile News Message Board | |
| Charts:- Daily , Weekly | |
| Add EGY to Watchlist: View: Get Complete EGY Trend Analysis ➞ | |
 | VSH Vishay Intertechnology, Inc. |
| Sector: Technology | |
| SubSector: Semiconductor - Broad Line | |
| MarketCap: 2132.52 Millions | |
| Recent Price: 22.23 Smart Investing & Trading Score: 58 | |
| Day Percent Change: -3.93% Day Change: -0.91 | |
| Week Change: -1.77% Year-to-date Change: -7.3% | |
| VSH Links: Profile News Message Board | |
| Charts:- Daily , Weekly | |
| Add VSH to Watchlist: View: Get Complete VSH Trend Analysis ➞ | |
 | VKTX Viking Therapeutics, Inc. |
| Sector: Health Care | |
| SubSector: Biotechnology | |
| MarketCap: 388.585 Millions | |
| Recent Price: 76.43 Smart Investing & Trading Score: 59 | |
| Day Percent Change: -3.96% Day Change: -3.15 | |
| Week Change: 2.85% Year-to-date Change: 310.7% | |
| VKTX Links: Profile News Message Board | |
| Charts:- Daily , Weekly | |
| Add VKTX to Watchlist: View: Get Complete VKTX Trend Analysis ➞ | |
 | PAR PAR Technology Corporation |
| Sector: Technology | |
| SubSector: Application Software | |
| MarketCap: 255.862 Millions | |
| Recent Price: 42.20 Smart Investing & Trading Score: 17 | |
| Day Percent Change: -3.97% Day Change: -1.74 | |
| Week Change: -2.41% Year-to-date Change: -3.1% | |
| PAR Links: Profile News Message Board | |
| Charts:- Daily , Weekly | |
| Add PAR to Watchlist: View: Get Complete PAR Trend Analysis ➞ | |
 | PRTS U.S. Auto Parts Network, Inc. |
| Sector: Consumer Staples | |
| SubSector: Auto Parts | |
| MarketCap: 65.0939 Millions | |
| Recent Price: 1.20 Smart Investing & Trading Score: 25 | |
| Day Percent Change: -4.00% Day Change: -0.05 | |
| Week Change: -0.83% Year-to-date Change: -62.0% | |
| PRTS Links: Profile News Message Board | |
| Charts:- Daily , Weekly | |
| Add PRTS to Watchlist: View: Get Complete PRTS Trend Analysis ➞ | |
 | UIS Unisys Corporation |
| Sector: Technology | |
| SubSector: Information Technology Services | |
| MarketCap: 803.868 Millions | |
| Recent Price: 5.21 Smart Investing & Trading Score: 15 | |
| Day Percent Change: -4.05% Day Change: -0.22 | |
| Week Change: -4.58% Year-to-date Change: -7.3% | |
| UIS Links: Profile News Message Board | |
| Charts:- Daily , Weekly | |
| Add UIS to Watchlist: View: Get Complete UIS Trend Analysis ➞ | |
 | BOOT Boot Barn Holdings, Inc. |
| Sector: Services & Goods | |
| SubSector: Apparel Stores | |
| MarketCap: 360.608 Millions | |
| Recent Price: 102.06 Smart Investing & Trading Score: 58 | |
| Day Percent Change: -4.14% Day Change: -4.41 | |
| Week Change: -5.32% Year-to-date Change: 33.0% | |
| BOOT Links: Profile News Message Board | |
| Charts:- Daily , Weekly | |
| Add BOOT to Watchlist: View: Get Complete BOOT Trend Analysis ➞ | |
 | KLIC Kulicke and Soffa Industries, Inc. |
| Sector: Technology | |
| SubSector: Semiconductor Equipment & Materials | |
| MarketCap: 1336.68 Millions | |
| Recent Price: 44.36 Smart Investing & Trading Score: 0 | |
| Day Percent Change: -4.15% Day Change: -1.92 | |
| Week Change: -5.66% Year-to-date Change: -18.9% | |
| KLIC Links: Profile News Message Board | |
| Charts:- Daily , Weekly | |
| Add KLIC to Watchlist: View: Get Complete KLIC Trend Analysis ➞ | |
 | MED Medifast, Inc. |
| Sector: Services & Goods | |
| SubSector: Specialty Retail, Other | |
| MarketCap: 681.044 Millions | |
| Recent Price: 26.36 Smart Investing & Trading Score: 10 | |
| Day Percent Change: -4.25% Day Change: -1.17 | |
| Week Change: -21.8% Year-to-date Change: -60.8% | |
| MED Links: Profile News Message Board | |
| Charts:- Daily , Weekly | |
| Add MED to Watchlist: View: Get Complete MED Trend Analysis ➞ | |
 | BRCC BRC Inc. |
| Sector: Consumer Staples | |
| SubSector: Packaged Foods | |
| MarketCap: 1110 Millions | |
| Recent Price: 3.73 Smart Investing & Trading Score: 5 | |
| Day Percent Change: -4.36% Day Change: -0.17 | |
| Week Change: -9.25% Year-to-date Change: 2.5% | |
| BRCC Links: Profile News Message Board | |
| Charts:- Daily , Weekly | |
| Add BRCC to Watchlist: View: Get Complete BRCC Trend Analysis ➞ | |
 | CRK Comstock Resources, Inc. |
| Sector: Energy | |
| SubSector: Independent Oil & Gas | |
| MarketCap: 959.793 Millions | |
| Recent Price: 9.77 Smart Investing & Trading Score: 63 | |
| Day Percent Change: -4.40% Day Change: -0.45 | |
| Week Change: -5.33% Year-to-date Change: 10.4% | |
| CRK Links: Profile News Message Board | |
| Charts:- Daily , Weekly | |
| Add CRK to Watchlist: View: Get Complete CRK Trend Analysis ➞ | |
| Too many stocks? View smallcap stocks filtered by marketcap & sector |
| Marketcap: All SmallCap Stocks (default-no microcap), Large, Mid-Range, Small & MicroCap |
| Sector: Tech, Finance, Energy, Staples, Retail, Industrial, Materials, Utilities & Medical |
|
Best Stocks Today 12Stocks.com |
© 2024 12Stocks.com Terms & Conditions Privacy Contact Us
All Information Provided Only For Education And Not To Be Used For Investing or Trading. See Terms & Conditions


One More Thing ... Get Best Stocks Delivered Daily!
Never Ever Miss A Move With Our Top Ten Stocks Lists
Find Best Stocks In Any Market - Bull or Bear Market
Take A Peek At Our Top Ten Stocks Lists: Daily, Weekly, Year-to-Date & Top Trends
Find Best Stocks In Any Market - Bull or Bear Market
Take A Peek At Our Top Ten Stocks Lists: Daily, Weekly, Year-to-Date & Top Trends
Smallcap Stocks With Best Up Trends [0-bearish to 100-bullish]: Surmodics [100], Rocky Brands[100], TransMedics Group[100], LendingClub [100], Summit [100], A10 s[100], Carpenter [100], UFP [100], PROCEPT BioRobotics[100], Xencor [100], Trinity Industries[100]
Best Smallcap Stocks Year-to-Date:
Janux [441.55%], Viking [310.69%], Longboard [259.25%], Alpine Immune[239.29%], Avidity Biosciences[185.4%], Bakkt [182.96%], Cullinan Oncology[175.33%], Arcutis Bio[173.68%], Vera [173.32%], Super Micro[159.73%], Y-mAbs [141.79%] Best Smallcap Stocks This Week:
Deciphera [73.11%], Eyenovia [45.65%], Cue Biopharma[39.56%], Seres [30.91%], Poseida [30.05%], P3 Health[29.62%], Phibro Animal[28.44%], TransMedics Group[27.72%], Surmodics [27.36%], LendingTree [26.36%], Rocky Brands[24.92%] Best Smallcap Stocks Daily:
Surmodics [29.74%], Rocky Brands[28.41%], TransMedics Group[24.93%], Ventyx Biosciences[24.63%], Eyenovia [21.84%], LendingClub [19.68%], Summit [19.59%], Powell Industries[18.89%], MiMedx Group[18.67%], CareDx [18.30%], A10 s[17.69%]