
 Login Sign Up


| |||||
 |  | ||||

| 12Stocks.com Market Intelligence |
Best SmallCap Stocks
|
| In a hurry? Small Cap Stock Lists: Performance Trends Table, Stock Charts
Sort Small Cap stocks: Daily, Weekly, Year-to-Date, Market Cap & Trends. Filter Small Cap stocks list by sector: Show all, Tech, Finance, Energy, Staples, Retail, Industrial, Materials, Utilities and HealthCare Filter Small Cap stocks list by size: All Large Medium Small and MicroCap |
| 12Stocks.com Small Cap Stocks Performances & Trends Daily | |||||||||
|
|  The overall Smart Investing & Trading Score is 14 (0-bearish to 100-bullish) which puts Small Cap index in short term bearish trend. The Smart Investing & Trading Score from previous trading session is 41 and hence a deterioration of trend.
| ||||||||
Here are the Smart Investing & Trading Scores of the most requested small cap stocks at 12Stocks.com (click stock name for detailed review):
|


| 12Stocks.com: Investing in Smallcap Index with Stocks | |
|
The following table helps investors and traders sort through current performance and trends (as measured by Smart Investing & Trading Score) of various
stocks in the Smallcap Index. Quick View: Move mouse or cursor over stock symbol (ticker) to view short-term technical chart and over stock name to view long term chart. Click on  to add stock symbol to your watchlist and to add stock symbol to your watchlist and  to view watchlist. Click on any ticker or stock name for detailed market intelligence report for that stock. to view watchlist. Click on any ticker or stock name for detailed market intelligence report for that stock. |
12Stocks.com Performance of Stocks in Smallcap Index
| Ticker | Stock Name | Watchlist | Category | Recent Price | Smart Investing & Trading Score | Change % | YTD Change% |
| RM | Regional Management |   | Financials | 25.29 | 51 | 0.32 | 0.84% |
| CLAR | Clarus | | Consumer Staples | 6.35 | 90 | 0.32 | -7.90% |
| IMKTA | Ingles Markets | | Services & Goods | 71.97 | 20 | 0.31 | -16.67% |
| MPB | Mid Penn | | Financials | 20.80 | 50 | 0.31 | -14.33% |
| SPWH | Sportsman s | | Consumer Staples | 3.21 | 34 | 0.31 | -24.65% |
| NMRK | Newmark Group | | Financials | 9.60 | 17 | 0.31 | -12.41% |
| FLNG | Flex LNG | | Energy | 26.09 | 76 | 0.31 | -10.22% |
| GWH | ESS Tech | | Industrials | 0.76 | 52 | 0.31 | -33.96% |
| ME | 23andMe Holding | | Health Care | 0.50 | 59 | 0.30 | -43.74% |
| TRC | Tejon Ranch | | Financials | 16.83 | 68 | 0.30 | -2.15% |
| HAYN | Haynes | | Industrials | 60.33 | 63 | 0.30 | 5.75% |
| NXT | Nextracker | | Technology | 42.93 | 24 | 0.30 | -8.13% |
| IE | Ivanhoe Electric | | Materials | 10.13 | 43 | 0.30 | -0.05% |
| PAYO | Payoneer Global | | Technology | 4.95 | 68 | 0.30 | -6.52% |
| SHO | Sunstone Hotel | | Financials | 10.23 | 25 | 0.29 | -4.66% |
| INMD | InMode | | Health Care | 17.24 | 35 | 0.29 | -22.48% |
| NEO | NeoGenomics | | Health Care | 13.96 | 17 | 0.29 | -13.72% |
| KE | Kimball Electronics | | Technology | 20.99 | 40 | 0.29 | -22.12% |
| VALU | Value Line | | Services & Goods | 36.30 | 38 | 0.28 | -25.54% |
| GOGL | Golden Ocean | | Transports | 14.13 | 88 | 0.28 | 44.77% |
| ALIT | Alight | | Technology | 9.04 | 31 | 0.28 | 6.29% |
| TTEC | TTEC | | Technology | 7.30 | 20 | 0.27 | -66.31% |
| UFPI | Universal Forest | | Industrials | 113.00 | 25 | 0.27 | -10.00% |
| CBZ | CBIZ | | Services & Goods | 71.37 | 7 | 0.27 | 14.03% |
| BHE | Benchmark Electronics | | Technology | 30.29 | 27 | 0.26 | 9.59% |


| Too many stocks? View smallcap stocks filtered by marketcap & sector |
| Marketcap: All SmallCap Stocks (default-no microcap), Large, Mid-Range, Small |
| Smallcap Sector: Tech, Finance, Energy, Staples, Retail, Industrial, Materials, & Medical |
|
Get the most comprehensive stock market coverage daily at 12Stocks.com ➞ Best Stocks Today ➞ Best Stocks Weekly ➞ Best Stocks Year-to-Date ➞ Best Stocks Trends ➞  Best Stocks Today 12Stocks.com Best Nasdaq Stocks ➞ Best S&P 500 Stocks ➞ Best Tech Stocks ➞ Best Biotech Stocks ➞ |
| Detailed Overview of SmallCap Stocks |
| SmallCap Technical Overview, Leaders & Laggards, Top SmallCap ETF Funds & Detailed SmallCap Stocks List, Charts, Trends & More |
| Smallcap: Technical Analysis, Trends & YTD Performance | |
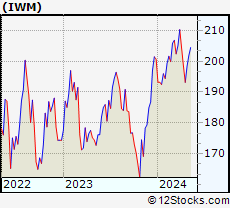
| SmallCap segment as represented by
IWM, an exchange-traded fund [ETF], holds basket of thousands of smallcap stocks from across all major sectors of the US stock market. The smallcap index (contains stocks like Riverbed & Sotheby's) is down by -2.19% and is currently underperforming the overall market by -6.73% year-to-date. Below is a quick view of technical charts and trends: | |
 IWM Weekly Chart |
|
| Long Term Trend: Not Good | |
| Medium Term Trend: Not Good | |
 IWM Daily Chart |
|
| Short Term Trend: Not Good | |
| Overall Trend Score: 14 | |
| YTD Performance: -2.19% | |
| **Trend Scores & Views Are Only For Educational Purposes And Not For Investing | |
| 12Stocks.com: Top Performing Small Cap Index Stocks | ||||||||||||||||||||||||||||||||||||||||||||||||
 The top performing Small Cap Index stocks year to date are
Now, more recently, over last week, the top performing Small Cap Index stocks on the move are


|
||||||||||||||||||||||||||||||||||||||||||||||||
| 12Stocks.com: Investing in Smallcap Index using Exchange Traded Funds | |
|
The following table shows list of key exchange traded funds (ETF) that
help investors track Smallcap index. The following list also includes leveraged ETF funds that track twice or thrice the daily returns of Smallcap indices. Short or inverse ETF funds move in the opposite direction to the index they track and are useful during market pullbacks or during bear markets. Quick View: Move mouse or cursor over ETF symbol (ticker) to view short-term technical chart and over ETF name to view long term chart. Click on ticker or stock name for detailed view. Click on to add stock symbol to your watchlist and to view watchlist. |
12Stocks.com List of ETFs that track Smallcap Index
| Ticker | ETF Name | Watchlist | Recent Price | Smart Investing & Trading Score | Change % | Week % | Year-to-date % |
| IWM | iShares Russell 2000 | | 196.31 | 14 | 0.21 | -1.05 | -2.19% |
| IJR | iShares Core S&P Small-Cap | | 104.74 | 22 | 0.34 | -0.86 | -3.24% |
| VTWO | Vanguard Russell 2000 ETF | | 79.36 | 14 | 0.25 | -1.07 | -2.15% |
| IWN | iShares Russell 2000 Value | | 149.82 | 22 | 0.52 | -0.87 | -3.55% |
| IJS | iShares S&P Small-Cap 600 Value | | 96.40 | 15 | 0.33 | -0.81 | -6.47% |
| IWO | iShares Russell 2000 Growth | | 249.58 | 7 | -0.30 | -1.39 | -1.05% |
| IJT | iShares S&P Small-Cap 600 Growth | | 124.94 | 15 | 0.27 | -0.91 | -0.16% |
| XSLV | PowerShares S&P SmallCap Low Volatil ETF | | 42.83 | 52 | 0.68 | 0.26 | -2.99% |
| SDD | ProShares UltraShort SmallCap600 | | 19.71 | 78 | 0.70 | 1.85 | 6.95% |
| SMLV | SPDR SSGA US Small Cap Low Volatil ETF | | 107.44 | 40 | 1.11 | -0.07 | -4.51% |
| SBB | ProShares Short SmallCap600 | | 16.56 | 71 | 0.05 | 1.06 | 3.94% |
| SAA | ProShares Ultra SmallCap600 | | 22.58 | 8 | -0.08 | -1.99 | -9.49% |
| 12Stocks.com: Charts, Trends, Fundamental Data and Performances of SmallCap Stocks | |
|
We now take in-depth look at all SmallCap stocks including charts, multi-period performances and overall trends (as measured by Smart Investing & Trading Score). One can sort SmallCap stocks (click link to choose) by Daily, Weekly and by Year-to-Date performances. Also, one can sort by size of the company or by market capitalization. |
| Select Your Default Chart Type: | |||||
| |||||
| Click on stock symbol or name for detailed view. Click on to add stock symbol to your watchlist and to view watchlist. Quick View: Move mouse or cursor over "Daily" to quickly view daily technical stock chart and over "Weekly" to view weekly technical stock chart. | |||||

 | RM Regional Management Corp. |
| Sector: Financials | |
| SubSector: Credit Services | |
| MarketCap: 148.008 Millions | |
| Recent Price: 25.29 Smart Investing & Trading Score: 51 | |
| Day Percent Change: 0.32% Day Change: 0.08 | |
| Week Change: -4.28% Year-to-date Change: 0.8% | |
| RM Links: Profile News Message Board | |
| Charts:- Daily , Weekly | |
| Add RM to Watchlist: View: Get Complete RM Trend Analysis ➞ | |
 | CLAR Clarus Corporation |
| Sector: Consumer Staples | |
| SubSector: Sporting Goods | |
| MarketCap: 290.144 Millions | |
| Recent Price: 6.35 Smart Investing & Trading Score: 90 | |
| Day Percent Change: 0.32% Day Change: 0.02 | |
| Week Change: 1.11% Year-to-date Change: -7.9% | |
| CLAR Links: Profile News Message Board | |
| Charts:- Daily , Weekly | |
| Add CLAR to Watchlist: View: Get Complete CLAR Trend Analysis ➞ | |
 | IMKTA Ingles Markets, Incorporated |
| Sector: Services & Goods | |
| SubSector: Grocery Stores | |
| MarketCap: 827.075 Millions | |
| Recent Price: 71.97 Smart Investing & Trading Score: 20 | |
| Day Percent Change: 0.31% Day Change: 0.22 | |
| Week Change: -1.02% Year-to-date Change: -16.7% | |
| IMKTA Links: Profile News Message Board | |
| Charts:- Daily , Weekly | |
| Add IMKTA to Watchlist: View: Get Complete IMKTA Trend Analysis ➞ | |
 | MPB Mid Penn Bancorp, Inc. |
| Sector: Financials | |
| SubSector: Regional - Northeast Banks | |
| MarketCap: 187.699 Millions | |
| Recent Price: 20.80 Smart Investing & Trading Score: 50 | |
| Day Percent Change: 0.31% Day Change: 0.07 | |
| Week Change: -0.29% Year-to-date Change: -14.3% | |
| MPB Links: Profile News Message Board | |
| Charts:- Daily , Weekly | |
| Add MPB to Watchlist: View: Get Complete MPB Trend Analysis ➞ | |
 | SPWH Sportsman s Warehouse Holdings, Inc. |
| Sector: Consumer Staples | |
| SubSector: Sporting Goods | |
| MarketCap: 247.144 Millions | |
| Recent Price: 3.21 Smart Investing & Trading Score: 34 | |
| Day Percent Change: 0.31% Day Change: 0.01 | |
| Week Change: -2.73% Year-to-date Change: -24.7% | |
| SPWH Links: Profile News Message Board | |
| Charts:- Daily , Weekly | |
| Add SPWH to Watchlist: View: Get Complete SPWH Trend Analysis ➞ | |
 | NMRK Newmark Group, Inc. |
| Sector: Financials | |
| SubSector: Property Management | |
| MarketCap: 767.542 Millions | |
| Recent Price: 9.60 Smart Investing & Trading Score: 17 | |
| Day Percent Change: 0.31% Day Change: 0.03 | |
| Week Change: -1.64% Year-to-date Change: -12.4% | |
| NMRK Links: Profile News Message Board | |
| Charts:- Daily , Weekly | |
| Add NMRK to Watchlist: View: Get Complete NMRK Trend Analysis ➞ | |
 | FLNG Flex LNG Ltd. |
| Sector: Energy | |
| SubSector: Oil & Gas Equipment & Services | |
| MarketCap: 220.261 Millions | |
| Recent Price: 26.09 Smart Investing & Trading Score: 76 | |
| Day Percent Change: 0.31% Day Change: 0.08 | |
| Week Change: -0.23% Year-to-date Change: -10.2% | |
| FLNG Links: Profile News Message Board | |
| Charts:- Daily , Weekly | |
| Add FLNG to Watchlist: View: Get Complete FLNG Trend Analysis ➞ | |
 | GWH ESS Tech, Inc. |
| Sector: Industrials | |
| SubSector: Electrical Equipment & Parts | |
| MarketCap: 239 Millions | |
| Recent Price: 0.76 Smart Investing & Trading Score: 52 | |
| Day Percent Change: 0.31% Day Change: 0.00 | |
| Week Change: 7.45% Year-to-date Change: -34.0% | |
| GWH Links: Profile News Message Board | |
| Charts:- Daily , Weekly | |
| Add GWH to Watchlist: View: Get Complete GWH Trend Analysis ➞ | |
 | ME 23andMe Holding Co. |
| Sector: Health Care | |
| SubSector: Diagnostics & Research | |
| MarketCap: 802 Millions | |
| Recent Price: 0.50 Smart Investing & Trading Score: 59 | |
| Day Percent Change: 0.30% Day Change: 0.00 | |
| Week Change: 7.99% Year-to-date Change: -43.7% | |
| ME Links: Profile News Message Board | |
| Charts:- Daily , Weekly | |
| Add ME to Watchlist: View: Get Complete ME Trend Analysis ➞ | |
 | TRC Tejon Ranch Co. |
| Sector: Financials | |
| SubSector: Property Management | |
| MarketCap: 346.442 Millions | |
| Recent Price: 16.83 Smart Investing & Trading Score: 68 | |
| Day Percent Change: 0.30% Day Change: 0.05 | |
| Week Change: -1.41% Year-to-date Change: -2.2% | |
| TRC Links: Profile News Message Board | |
| Charts:- Daily , Weekly | |
| Add TRC to Watchlist: View: Get Complete TRC Trend Analysis ➞ | |
 | HAYN Haynes International, Inc. |
| Sector: Industrials | |
| SubSector: Metal Fabrication | |
| MarketCap: 245.75 Millions | |
| Recent Price: 60.33 Smart Investing & Trading Score: 63 | |
| Day Percent Change: 0.30% Day Change: 0.18 | |
| Week Change: 0.03% Year-to-date Change: 5.8% | |
| HAYN Links: Profile News Message Board | |
| Charts:- Daily , Weekly | |
| Add HAYN to Watchlist: View: Get Complete HAYN Trend Analysis ➞ | |
 | NXT Nextracker Inc. |
| Sector: Technology | |
| SubSector: Solar | |
| MarketCap: 5590 Millions | |
| Recent Price: 42.93 Smart Investing & Trading Score: 24 | |
| Day Percent Change: 0.30% Day Change: 0.13 | |
| Week Change: -1.95% Year-to-date Change: -8.1% | |
| NXT Links: Profile News Message Board | |
| Charts:- Daily , Weekly | |
| Add NXT to Watchlist: View: Get Complete NXT Trend Analysis ➞ | |
 | IE Ivanhoe Electric Inc. |
| Sector: Materials | |
| SubSector: Copper | |
| MarketCap: 1200 Millions | |
| Recent Price: 10.13 Smart Investing & Trading Score: 43 | |
| Day Percent Change: 0.30% Day Change: 0.03 | |
| Week Change: -5.15% Year-to-date Change: -0.1% | |
| IE Links: Profile News Message Board | |
| Charts:- Daily , Weekly | |
| Add IE to Watchlist: View: Get Complete IE Trend Analysis ➞ | |
 | PAYO Payoneer Global Inc. |
| Sector: Technology | |
| SubSector: Software - Infrastructure | |
| MarketCap: 1710 Millions | |
| Recent Price: 4.95 Smart Investing & Trading Score: 68 | |
| Day Percent Change: 0.30% Day Change: 0.02 | |
| Week Change: -1.1% Year-to-date Change: -6.5% | |
| PAYO Links: Profile News Message Board | |
| Charts:- Daily , Weekly | |
| Add PAYO to Watchlist: View: Get Complete PAYO Trend Analysis ➞ | |
 | SHO Sunstone Hotel Investors, Inc. |
| Sector: Financials | |
| SubSector: REIT - Hotel/Motel | |
| MarketCap: 1861.04 Millions | |
| Recent Price: 10.23 Smart Investing & Trading Score: 25 | |
| Day Percent Change: 0.29% Day Change: 0.03 | |
| Week Change: -0.68% Year-to-date Change: -4.7% | |
| SHO Links: Profile News Message Board | |
| Charts:- Daily , Weekly | |
| Add SHO to Watchlist: View: Get Complete SHO Trend Analysis ➞ | |
 | INMD InMode Ltd. |
| Sector: Health Care | |
| SubSector: Medical Appliances & Equipment | |
| MarketCap: 689.08 Millions | |
| Recent Price: 17.24 Smart Investing & Trading Score: 35 | |
| Day Percent Change: 0.29% Day Change: 0.05 | |
| Week Change: 0.58% Year-to-date Change: -22.5% | |
| INMD Links: Profile News Message Board | |
| Charts:- Daily , Weekly | |
| Add INMD to Watchlist: View: Get Complete INMD Trend Analysis ➞ | |
 | NEO NeoGenomics, Inc. |
| Sector: Health Care | |
| SubSector: Medical Laboratories & Research | |
| MarketCap: 2763.8 Millions | |
| Recent Price: 13.96 Smart Investing & Trading Score: 17 | |
| Day Percent Change: 0.29% Day Change: 0.04 | |
| Week Change: -1.27% Year-to-date Change: -13.7% | |
| NEO Links: Profile News Message Board | |
| Charts:- Daily , Weekly | |
| Add NEO to Watchlist: View: Get Complete NEO Trend Analysis ➞ | |
 | KE Kimball Electronics, Inc. |
| Sector: Technology | |
| SubSector: Diversified Electronics | |
| MarketCap: 308.896 Millions | |
| Recent Price: 20.99 Smart Investing & Trading Score: 40 | |
| Day Percent Change: 0.29% Day Change: 0.06 | |
| Week Change: 0.82% Year-to-date Change: -22.1% | |
| KE Links: Profile News Message Board | |
| Charts:- Daily , Weekly | |
| Add KE to Watchlist: View: Get Complete KE Trend Analysis ➞ | |
 | VALU Value Line, Inc. |
| Sector: Services & Goods | |
| SubSector: Publishing - Periodicals | |
| MarketCap: 254.3 Millions | |
| Recent Price: 36.30 Smart Investing & Trading Score: 38 | |
| Day Percent Change: 0.28% Day Change: 0.10 | |
| Week Change: -0.14% Year-to-date Change: -25.5% | |
| VALU Links: Profile News Message Board | |
| Charts:- Daily , Weekly | |
| Add VALU to Watchlist: View: Get Complete VALU Trend Analysis ➞ | |
 | GOGL Golden Ocean Group Limited |
| Sector: Transports | |
| SubSector: Shipping | |
| MarketCap: 446.614 Millions | |
| Recent Price: 14.13 Smart Investing & Trading Score: 88 | |
| Day Percent Change: 0.28% Day Change: 0.04 | |
| Week Change: 0.57% Year-to-date Change: 44.8% | |
| GOGL Links: Profile News Message Board | |
| Charts:- Daily , Weekly | |
| Add GOGL to Watchlist: View: Get Complete GOGL Trend Analysis ➞ | |
 | ALIT Alight, Inc. |
| Sector: Technology | |
| SubSector: Software - Application | |
| MarketCap: 5130 Millions | |
| Recent Price: 9.04 Smart Investing & Trading Score: 31 | |
| Day Percent Change: 0.28% Day Change: 0.03 | |
| Week Change: -0.71% Year-to-date Change: 6.3% | |
| ALIT Links: Profile News Message Board | |
| Charts:- Daily , Weekly | |
| Add ALIT to Watchlist: View: Get Complete ALIT Trend Analysis ➞ | |
 | TTEC TTEC Holdings, Inc. |
| Sector: Technology | |
| SubSector: Information Technology Services | |
| MarketCap: 1528.48 Millions | |
| Recent Price: 7.30 Smart Investing & Trading Score: 20 | |
| Day Percent Change: 0.27% Day Change: 0.02 | |
| Week Change: -5.44% Year-to-date Change: -66.3% | |
| TTEC Links: Profile News Message Board | |
| Charts:- Daily , Weekly | |
| Add TTEC to Watchlist: View: Get Complete TTEC Trend Analysis ➞ | |
 | UFPI Universal Forest Products, Inc. |
| Sector: Industrials | |
| SubSector: Lumber, Wood Production | |
| MarketCap: 2263.38 Millions | |
| Recent Price: 113.00 Smart Investing & Trading Score: 25 | |
| Day Percent Change: 0.27% Day Change: 0.30 | |
| Week Change: -0.56% Year-to-date Change: -10.0% | |
| UFPI Links: Profile News Message Board | |
| Charts:- Daily , Weekly | |
| Add UFPI to Watchlist: View: Get Complete UFPI Trend Analysis ➞ | |
 | CBZ CBIZ, Inc. |
| Sector: Services & Goods | |
| SubSector: Business Services | |
| MarketCap: 1121.32 Millions | |
| Recent Price: 71.37 Smart Investing & Trading Score: 7 | |
| Day Percent Change: 0.27% Day Change: 0.19 | |
| Week Change: -1.91% Year-to-date Change: 14.0% | |
| CBZ Links: Profile News Message Board | |
| Charts:- Daily , Weekly | |
| Add CBZ to Watchlist: View: Get Complete CBZ Trend Analysis ➞ | |
 | BHE Benchmark Electronics, Inc. |
| Sector: Technology | |
| SubSector: Printed Circuit Boards | |
| MarketCap: 766.835 Millions | |
| Recent Price: 30.29 Smart Investing & Trading Score: 27 | |
| Day Percent Change: 0.26% Day Change: 0.08 | |
| Week Change: -3.41% Year-to-date Change: 9.6% | |
| BHE Links: Profile News Message Board | |
| Charts:- Daily , Weekly | |
| Add BHE to Watchlist: View: Get Complete BHE Trend Analysis ➞ | |
| Too many stocks? View smallcap stocks filtered by marketcap & sector |
| Marketcap: All SmallCap Stocks (default-no microcap), Large, Mid-Range, Small & MicroCap |
| Sector: Tech, Finance, Energy, Staples, Retail, Industrial, Materials, Utilities & Medical |
|
Best Stocks Today 12Stocks.com |
© 2024 12Stocks.com Terms & Conditions Privacy Contact Us
All Information Provided Only For Education And Not To Be Used For Investing or Trading. See Terms & Conditions


One More Thing ... Get Best Stocks Delivered Daily!
Never Ever Miss A Move With Our Top Ten Stocks Lists
Find Best Stocks In Any Market - Bull or Bear Market
Take A Peek At Our Top Ten Stocks Lists: Daily, Weekly, Year-to-Date & Top Trends
Find Best Stocks In Any Market - Bull or Bear Market
Take A Peek At Our Top Ten Stocks Lists: Daily, Weekly, Year-to-Date & Top Trends
Smallcap Stocks With Best Up Trends [0-bearish to 100-bullish]: Surmodics [100], Rocky Brands[100], TransMedics Group[100], LendingClub [100], Summit [100], A10 s[100], Carpenter [100], UFP [100], PROCEPT BioRobotics[100], Xencor [100], Trinity Industries[100]
Best Smallcap Stocks Year-to-Date:
Janux [441.55%], Viking [310.69%], Longboard [259.25%], Alpine Immune[239.29%], Avidity Biosciences[185.4%], Bakkt [182.96%], Cullinan Oncology[175.33%], Arcutis Bio[173.68%], Vera [173.32%], Super Micro[159.73%], Y-mAbs [141.79%] Best Smallcap Stocks This Week:
Deciphera [73.11%], Eyenovia [45.65%], Cue Biopharma[39.56%], Seres [30.91%], Poseida [30.05%], P3 Health[29.62%], Phibro Animal[28.44%], TransMedics Group[27.72%], Surmodics [27.36%], LendingTree [26.36%], Rocky Brands[24.92%] Best Smallcap Stocks Daily:
Surmodics [29.74%], Rocky Brands[28.41%], TransMedics Group[24.93%], Ventyx Biosciences[24.63%], Eyenovia [21.84%], LendingClub [19.68%], Summit [19.59%], Powell Industries[18.89%], MiMedx Group[18.67%], CareDx [18.30%], A10 s[17.69%]