
 Login Sign Up


| |||||
 |  | ||||

| 12Stocks.com Market Intelligence |
Best SmallCap Stocks
|
| In a hurry? Small Cap Stock Lists: Performance Trends Table, Stock Charts
Sort Small Cap stocks: Daily, Weekly, Year-to-Date, Market Cap & Trends. Filter Small Cap stocks list by sector: Show all, Tech, Finance, Energy, Staples, Retail, Industrial, Materials, Utilities and HealthCare Filter Small Cap stocks list by size: All Large Medium Small and MicroCap |
| 12Stocks.com Small Cap Stocks Performances & Trends Daily | |||||||||
|
|  The overall Smart Investing & Trading Score is 39 (0-bearish to 100-bullish) which puts Small Cap index in short term bearish to neutral trend. The Smart Investing & Trading Score from previous trading session is 41 and hence a deterioration of trend.
| ||||||||
Here are the Smart Investing & Trading Scores of the most requested small cap stocks at 12Stocks.com (click stock name for detailed review):
|


| 12Stocks.com: Investing in Smallcap Index with Stocks | |
|
The following table helps investors and traders sort through current performance and trends (as measured by Smart Investing & Trading Score) of various
stocks in the Smallcap Index. Quick View: Move mouse or cursor over stock symbol (ticker) to view short-term technical chart and over stock name to view long term chart. Click on  to add stock symbol to your watchlist and to add stock symbol to your watchlist and  to view watchlist. Click on any ticker or stock name for detailed market intelligence report for that stock. to view watchlist. Click on any ticker or stock name for detailed market intelligence report for that stock. |
12Stocks.com Performance of Stocks in Smallcap Index
| Ticker | Stock Name | Watchlist | Category | Recent Price | Smart Investing & Trading Score | Change % | YTD Change% |
| HWKN | Hawkins |   | Materials | 75.16 | 58 | -0.81 | 6.73% |
| CIFR | Cipher Mining | | Financials | 3.68 | 26 | -0.81 | -10.46% |
| LOCO | El Pollo | | Services & Goods | 8.45 | 7 | -0.82 | -4.20% |
| IDCC | InterDigital | | Technology | 97.90 | 32 | -0.84 | -9.80% |
| RICK | RCI Hospitality | | Services & Goods | 50.69 | 42 | -0.84 | -23.50% |
| CWH | Camping World | | Financials | 20.10 | 10 | -0.84 | -23.46% |
| PRM | Perimeter Solutions | | Materials | 6.94 | 53 | -0.86 | 51.03% |
| AMBA | Ambarella | | Technology | 45.57 | 59 | -0.87 | -25.65% |
| WTI | W&T Offshore | | Energy | 2.23 | 10 | -0.89 | -31.60% |
| PBH | Prestige Consumer | | Health Care | 71.12 | 75 | -0.89 | 16.17% |
| MRC | MRC Global | | Energy | 11.13 | 10 | -0.89 | 1.09% |
| XMTR | Xometry | | Industrials | 17.72 | 45 | -0.89 | -51.76% |
| TGI | Triumph Group | | Industrials | 13.24 | 42 | -0.90 | -20.14% |
| ANF | Abercrombie & Fitch Co | | Services & Goods | 120.41 | 57 | -0.91 | 36.49% |
| BOOM | DMC Global | | Industrials | 15.71 | 10 | -0.91 | -16.55% |
| GVA | Granite Construction | | Industrials | 54.99 | 65 | -0.92 | 8.12% |
| ASGN | ASGN | | Services & Goods | 95.56 | 15 | -0.92 | -0.63% |
| MCFT | MasterCraft Boat | | Consumer Staples | 20.04 | 20 | -0.94 | -11.48% |
| MATW | Matthews | | Services & Goods | 26.72 | 25 | -0.96 | -27.09% |
| SAH | Sonic Automotive | | Services & Goods | 57.28 | 68 | -0.97 | 1.90% |
| TREE | LendingTree | | Financials | 47.80 | 95 | -0.97 | 57.65% |
| VTS | Vitesse Energy | | Energy | 21.97 | 0 | -0.99 | -0.77% |
| NVEE | NV5 Global | | Services & Goods | 92.32 | 27 | -0.99 | -16.92% |
| TSQ | Townsquare Media | | Services & Goods | 11.95 | 53 | -0.99 | 13.16% |
| CMPR | Cimpress | | Services & Goods | 84.42 | 0 | -1.00 | 5.46% |


| Too many stocks? View smallcap stocks filtered by marketcap & sector |
| Marketcap: All SmallCap Stocks (default-no microcap), Large, Mid-Range, Small |
| Smallcap Sector: Tech, Finance, Energy, Staples, Retail, Industrial, Materials, & Medical |
|
Get the most comprehensive stock market coverage daily at 12Stocks.com ➞ Best Stocks Today ➞ Best Stocks Weekly ➞ Best Stocks Year-to-Date ➞ Best Stocks Trends ➞  Best Stocks Today 12Stocks.com Best Nasdaq Stocks ➞ Best S&P 500 Stocks ➞ Best Tech Stocks ➞ Best Biotech Stocks ➞ |
| Detailed Overview of SmallCap Stocks |
| SmallCap Technical Overview, Leaders & Laggards, Top SmallCap ETF Funds & Detailed SmallCap Stocks List, Charts, Trends & More |
| Smallcap: Technical Analysis, Trends & YTD Performance | |
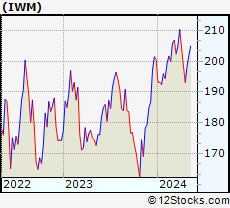
| SmallCap segment as represented by
IWM, an exchange-traded fund [ETF], holds basket of thousands of smallcap stocks from across all major sectors of the US stock market. The smallcap index (contains stocks like Riverbed & Sotheby's) is down by -2.19% and is currently underperforming the overall market by -6.73% year-to-date. Below is a quick view of technical charts and trends: | |
 IWM Weekly Chart |
|
| Long Term Trend: Not Good | |
| Medium Term Trend: Good | |
 IWM Daily Chart |
|
| Short Term Trend: Very Good | |
| Overall Trend Score: 39 | |
| YTD Performance: -2.19% | |
| **Trend Scores & Views Are Only For Educational Purposes And Not For Investing | |
| 12Stocks.com: Top Performing Small Cap Index Stocks | ||||||||||||||||||||||||||||||||||||||||||||||||
 The top performing Small Cap Index stocks year to date are
Now, more recently, over last week, the top performing Small Cap Index stocks on the move are


|
||||||||||||||||||||||||||||||||||||||||||||||||
| 12Stocks.com: Investing in Smallcap Index using Exchange Traded Funds | |
|
The following table shows list of key exchange traded funds (ETF) that
help investors track Smallcap index. The following list also includes leveraged ETF funds that track twice or thrice the daily returns of Smallcap indices. Short or inverse ETF funds move in the opposite direction to the index they track and are useful during market pullbacks or during bear markets. Quick View: Move mouse or cursor over ETF symbol (ticker) to view short-term technical chart and over ETF name to view long term chart. Click on ticker or stock name for detailed view. Click on to add stock symbol to your watchlist and to view watchlist. |
12Stocks.com List of ETFs that track Smallcap Index
| Ticker | ETF Name | Watchlist | Recent Price | Smart Investing & Trading Score | Change % | Week % | Year-to-date % |
| IWM | iShares Russell 2000 | | 196.31 | 39 | 0.21 | -1.05 | -2.19% |
| IJR | iShares Core S&P Small-Cap | | 104.75 | 22 | 0.34 | -0.85 | -3.23% |
| VTWO | Vanguard Russell 2000 ETF | | 79.37 | 14 | 0.27 | -1.06 | -2.13% |
| IWN | iShares Russell 2000 Value | | 149.91 | 22 | 0.58 | -0.81 | -3.49% |
| IJS | iShares S&P Small-Cap 600 Value | | 96.40 | 15 | 0.33 | -0.81 | -6.47% |
| IWO | iShares Russell 2000 Growth | | 249.70 | 7 | -0.25 | -1.34 | -1% |
| IJT | iShares S&P Small-Cap 600 Growth | | 124.90 | 15 | 0.24 | -0.94 | -0.19% |
| XSLV | PowerShares S&P SmallCap Low Volatil ETF | | 42.89 | 45 | 0.82 | 0.4 | -2.85% |
| SDD | ProShares UltraShort SmallCap600 | | 19.55 | 37 | -0.10 | 1.03 | 6.1% |
| SMLV | SPDR SSGA US Small Cap Low Volatil ETF | | 107.07 | 22 | 0.76 | -0.42 | -4.84% |
| SBB | ProShares Short SmallCap600 | | 16.50 | 27 | -0.30 | 0.7 | 3.58% |
| SAA | ProShares Ultra SmallCap600 | | 22.53 | 13 | -0.31 | -2.21 | -9.7% |
| 12Stocks.com: Charts, Trends, Fundamental Data and Performances of SmallCap Stocks | |
|
We now take in-depth look at all SmallCap stocks including charts, multi-period performances and overall trends (as measured by Smart Investing & Trading Score). One can sort SmallCap stocks (click link to choose) by Daily, Weekly and by Year-to-Date performances. Also, one can sort by size of the company or by market capitalization. |
| Select Your Default Chart Type: | |||||
| |||||
| Click on stock symbol or name for detailed view. Click on to add stock symbol to your watchlist and to view watchlist. Quick View: Move mouse or cursor over "Daily" to quickly view daily technical stock chart and over "Weekly" to view weekly technical stock chart. | |||||

 | HWKN Hawkins, Inc. |
| Sector: Materials | |
| SubSector: Specialty Chemicals | |
| MarketCap: 398.957 Millions | |
| Recent Price: 75.16 Smart Investing & Trading Score: 58 | |
| Day Percent Change: -0.81% Day Change: -0.61 | |
| Week Change: -0.82% Year-to-date Change: 6.7% | |
| HWKN Links: Profile News Message Board | |
| Charts:- Daily , Weekly | |
| Add HWKN to Watchlist: View: Get Complete HWKN Trend Analysis ➞ | |
 | CIFR Cipher Mining Inc. |
| Sector: Financials | |
| SubSector: Capital Markets | |
| MarketCap: 712 Millions | |
| Recent Price: 3.68 Smart Investing & Trading Score: 26 | |
| Day Percent Change: -0.81% Day Change: -0.03 | |
| Week Change: -18.04% Year-to-date Change: -10.5% | |
| CIFR Links: Profile News Message Board | |
| Charts:- Daily , Weekly | |
| Add CIFR to Watchlist: View: Get Complete CIFR Trend Analysis ➞ | |
 | LOCO El Pollo Loco Holdings, Inc. |
| Sector: Services & Goods | |
| SubSector: Restaurants | |
| MarketCap: 296.97 Millions | |
| Recent Price: 8.45 Smart Investing & Trading Score: 7 | |
| Day Percent Change: -0.82% Day Change: -0.07 | |
| Week Change: -5.16% Year-to-date Change: -4.2% | |
| LOCO Links: Profile News Message Board | |
| Charts:- Daily , Weekly | |
| Add LOCO to Watchlist: View: Get Complete LOCO Trend Analysis ➞ | |
 | IDCC InterDigital, Inc. |
| Sector: Technology | |
| SubSector: Wireless Communications | |
| MarketCap: 1225.27 Millions | |
| Recent Price: 97.90 Smart Investing & Trading Score: 32 | |
| Day Percent Change: -0.84% Day Change: -0.83 | |
| Week Change: -2.79% Year-to-date Change: -9.8% | |
| IDCC Links: Profile News Message Board | |
| Charts:- Daily , Weekly | |
| Add IDCC to Watchlist: View: Get Complete IDCC Trend Analysis ➞ | |
 | RICK RCI Hospitality Holdings, Inc. |
| Sector: Services & Goods | |
| SubSector: Restaurants | |
| MarketCap: 93 Millions | |
| Recent Price: 50.69 Smart Investing & Trading Score: 42 | |
| Day Percent Change: -0.84% Day Change: -0.43 | |
| Week Change: 0.24% Year-to-date Change: -23.5% | |
| RICK Links: Profile News Message Board | |
| Charts:- Daily , Weekly | |
| Add RICK to Watchlist: View: Get Complete RICK Trend Analysis ➞ | |
 | CWH Camping World Holdings, Inc. |
| Sector: Financials | |
| SubSector: REIT - Office | |
| MarketCap: 473.566 Millions | |
| Recent Price: 20.10 Smart Investing & Trading Score: 10 | |
| Day Percent Change: -0.84% Day Change: -0.17 | |
| Week Change: -6.29% Year-to-date Change: -23.5% | |
| CWH Links: Profile News Message Board | |
| Charts:- Daily , Weekly | |
| Add CWH to Watchlist: View: Get Complete CWH Trend Analysis ➞ | |
 | PRM Perimeter Solutions, SA |
| Sector: Materials | |
| SubSector: Specialty Chemicals | |
| MarketCap: 930 Millions | |
| Recent Price: 6.94 Smart Investing & Trading Score: 53 | |
| Day Percent Change: -0.86% Day Change: -0.06 | |
| Week Change: -1.7% Year-to-date Change: 51.0% | |
| PRM Links: Profile News Message Board | |
| Charts:- Daily , Weekly | |
| Add PRM to Watchlist: View: Get Complete PRM Trend Analysis ➞ | |
 | AMBA Ambarella, Inc. |
| Sector: Technology | |
| SubSector: Semiconductor Equipment & Materials | |
| MarketCap: 1509.38 Millions | |
| Recent Price: 45.57 Smart Investing & Trading Score: 59 | |
| Day Percent Change: -0.87% Day Change: -0.40 | |
| Week Change: 5.76% Year-to-date Change: -25.7% | |
| AMBA Links: Profile News Message Board | |
| Charts:- Daily , Weekly | |
| Add AMBA to Watchlist: View: Get Complete AMBA Trend Analysis ➞ | |
 | WTI W&T Offshore, Inc. |
| Sector: Energy | |
| SubSector: Oil & Gas Drilling & Exploration | |
| MarketCap: 244.539 Millions | |
| Recent Price: 2.23 Smart Investing & Trading Score: 10 | |
| Day Percent Change: -0.89% Day Change: -0.02 | |
| Week Change: -5.11% Year-to-date Change: -31.6% | |
| WTI Links: Profile News Message Board | |
| Charts:- Daily , Weekly | |
| Add WTI to Watchlist: View: Get Complete WTI Trend Analysis ➞ | |
 | PBH Prestige Consumer Healthcare Inc. |
| Sector: Health Care | |
| SubSector: Medical Appliances & Equipment | |
| MarketCap: 1639.6 Millions | |
| Recent Price: 71.12 Smart Investing & Trading Score: 75 | |
| Day Percent Change: -0.89% Day Change: -0.64 | |
| Week Change: 0.92% Year-to-date Change: 16.2% | |
| PBH Links: Profile News Message Board | |
| Charts:- Daily , Weekly | |
| Add PBH to Watchlist: View: Get Complete PBH Trend Analysis ➞ | |
 | MRC MRC Global Inc. |
| Sector: Energy | |
| SubSector: Oil & Gas Equipment & Services | |
| MarketCap: 364.061 Millions | |
| Recent Price: 11.13 Smart Investing & Trading Score: 10 | |
| Day Percent Change: -0.89% Day Change: -0.10 | |
| Week Change: -4.05% Year-to-date Change: 1.1% | |
| MRC Links: Profile News Message Board | |
| Charts:- Daily , Weekly | |
| Add MRC to Watchlist: View: Get Complete MRC Trend Analysis ➞ | |
 | XMTR Xometry, Inc. |
| Sector: Industrials | |
| SubSector: Specialty Industrial Machinery | |
| MarketCap: 1050 Millions | |
| Recent Price: 17.72 Smart Investing & Trading Score: 45 | |
| Day Percent Change: -0.89% Day Change: -0.16 | |
| Week Change: 1.14% Year-to-date Change: -51.8% | |
| XMTR Links: Profile News Message Board | |
| Charts:- Daily , Weekly | |
| Add XMTR to Watchlist: View: Get Complete XMTR Trend Analysis ➞ | |
 | TGI Triumph Group, Inc. |
| Sector: Industrials | |
| SubSector: Aerospace/Defense Products & Services | |
| MarketCap: 358.901 Millions | |
| Recent Price: 13.24 Smart Investing & Trading Score: 42 | |
| Day Percent Change: -0.90% Day Change: -0.12 | |
| Week Change: -3.07% Year-to-date Change: -20.1% | |
| TGI Links: Profile News Message Board | |
| Charts:- Daily , Weekly | |
| Add TGI to Watchlist: View: Get Complete TGI Trend Analysis ➞ | |
 | ANF Abercrombie & Fitch Co. |
| Sector: Services & Goods | |
| SubSector: Apparel Stores | |
| MarketCap: 589.108 Millions | |
| Recent Price: 120.41 Smart Investing & Trading Score: 57 | |
| Day Percent Change: -0.91% Day Change: -1.11 | |
| Week Change: -1.37% Year-to-date Change: 36.5% | |
| ANF Links: Profile News Message Board | |
| Charts:- Daily , Weekly | |
| Add ANF to Watchlist: View: Get Complete ANF Trend Analysis ➞ | |
 | BOOM DMC Global Inc. |
| Sector: Industrials | |
| SubSector: Metal Fabrication | |
| MarketCap: 359.15 Millions | |
| Recent Price: 15.71 Smart Investing & Trading Score: 10 | |
| Day Percent Change: -0.91% Day Change: -0.14 | |
| Week Change: -4.76% Year-to-date Change: -16.6% | |
| BOOM Links: Profile News Message Board | |
| Charts:- Daily , Weekly | |
| Add BOOM to Watchlist: View: Get Complete BOOM Trend Analysis ➞ | |
 | GVA Granite Construction Incorporated |
| Sector: Industrials | |
| SubSector: Heavy Construction | |
| MarketCap: 725.895 Millions | |
| Recent Price: 54.99 Smart Investing & Trading Score: 65 | |
| Day Percent Change: -0.92% Day Change: -0.51 | |
| Week Change: -0.97% Year-to-date Change: 8.1% | |
| GVA Links: Profile News Message Board | |
| Charts:- Daily , Weekly | |
| Add GVA to Watchlist: View: Get Complete GVA Trend Analysis ➞ | |
 | ASGN ASGN Incorporated |
| Sector: Services & Goods | |
| SubSector: Staffing & Outsourcing Services | |
| MarketCap: 2035.88 Millions | |
| Recent Price: 95.56 Smart Investing & Trading Score: 15 | |
| Day Percent Change: -0.92% Day Change: -0.89 | |
| Week Change: -2% Year-to-date Change: -0.6% | |
| ASGN Links: Profile News Message Board | |
| Charts:- Daily , Weekly | |
| Add ASGN to Watchlist: View: Get Complete ASGN Trend Analysis ➞ | |
 | MCFT MasterCraft Boat Holdings, Inc. |
| Sector: Consumer Staples | |
| SubSector: Recreational Vehicles | |
| MarketCap: 152.059 Millions | |
| Recent Price: 20.04 Smart Investing & Trading Score: 20 | |
| Day Percent Change: -0.94% Day Change: -0.19 | |
| Week Change: -2.48% Year-to-date Change: -11.5% | |
| MCFT Links: Profile News Message Board | |
| Charts:- Daily , Weekly | |
| Add MCFT to Watchlist: View: Get Complete MCFT Trend Analysis ➞ | |
 | MATW Matthews International Corporation |
| Sector: Services & Goods | |
| SubSector: Personal Services | |
| MarketCap: 803.325 Millions | |
| Recent Price: 26.72 Smart Investing & Trading Score: 25 | |
| Day Percent Change: -0.96% Day Change: -0.26 | |
| Week Change: -1.58% Year-to-date Change: -27.1% | |
| MATW Links: Profile News Message Board | |
| Charts:- Daily , Weekly | |
| Add MATW to Watchlist: View: Get Complete MATW Trend Analysis ➞ | |
 | SAH Sonic Automotive, Inc. |
| Sector: Services & Goods | |
| SubSector: Auto Dealerships | |
| MarketCap: 581.321 Millions | |
| Recent Price: 57.28 Smart Investing & Trading Score: 68 | |
| Day Percent Change: -0.97% Day Change: -0.56 | |
| Week Change: -8.06% Year-to-date Change: 1.9% | |
| SAH Links: Profile News Message Board | |
| Charts:- Daily , Weekly | |
| Add SAH to Watchlist: View: Get Complete SAH Trend Analysis ➞ | |
 | TREE LendingTree, Inc. |
| Sector: Financials | |
| SubSector: Mortgage Investment | |
| MarketCap: 2745.99 Millions | |
| Recent Price: 47.80 Smart Investing & Trading Score: 95 | |
| Day Percent Change: -0.97% Day Change: -0.47 | |
| Week Change: 26.12% Year-to-date Change: 57.7% | |
| TREE Links: Profile News Message Board | |
| Charts:- Daily , Weekly | |
| Add TREE to Watchlist: View: Get Complete TREE Trend Analysis ➞ | |
 | VTS Vitesse Energy, Inc. |
| Sector: Energy | |
| SubSector: Oil & Gas E&P | |
| MarketCap: 639 Millions | |
| Recent Price: 21.97 Smart Investing & Trading Score: 0 | |
| Day Percent Change: -0.99% Day Change: -0.22 | |
| Week Change: -4.23% Year-to-date Change: -0.8% | |
| VTS Links: Profile News Message Board | |
| Charts:- Daily , Weekly | |
| Add VTS to Watchlist: View: Get Complete VTS Trend Analysis ➞ | |
 | NVEE NV5 Global, Inc. |
| Sector: Services & Goods | |
| SubSector: Technical Services | |
| MarketCap: 484.91 Millions | |
| Recent Price: 92.32 Smart Investing & Trading Score: 27 | |
| Day Percent Change: -0.99% Day Change: -0.92 | |
| Week Change: -1.77% Year-to-date Change: -16.9% | |
| NVEE Links: Profile News Message Board | |
| Charts:- Daily , Weekly | |
| Add NVEE to Watchlist: View: Get Complete NVEE Trend Analysis ➞ | |
 | TSQ Townsquare Media, Inc. |
| Sector: Services & Goods | |
| SubSector: Broadcasting - Radio | |
| MarketCap: 101.795 Millions | |
| Recent Price: 11.95 Smart Investing & Trading Score: 53 | |
| Day Percent Change: -0.99% Day Change: -0.12 | |
| Week Change: -2.37% Year-to-date Change: 13.2% | |
| TSQ Links: Profile News Message Board | |
| Charts:- Daily , Weekly | |
| Add TSQ to Watchlist: View: Get Complete TSQ Trend Analysis ➞ | |
 | CMPR Cimpress plc |
| Sector: Services & Goods | |
| SubSector: Business Services | |
| MarketCap: 1675.02 Millions | |
| Recent Price: 84.42 Smart Investing & Trading Score: 0 | |
| Day Percent Change: -1.00% Day Change: -0.85 | |
| Week Change: -5.23% Year-to-date Change: 5.5% | |
| CMPR Links: Profile News Message Board | |
| Charts:- Daily , Weekly | |
| Add CMPR to Watchlist: View: Get Complete CMPR Trend Analysis ➞ | |
| Too many stocks? View smallcap stocks filtered by marketcap & sector |
| Marketcap: All SmallCap Stocks (default-no microcap), Large, Mid-Range, Small & MicroCap |
| Sector: Tech, Finance, Energy, Staples, Retail, Industrial, Materials, Utilities & Medical |
|
Best Stocks Today 12Stocks.com |
© 2024 12Stocks.com Terms & Conditions Privacy Contact Us
All Information Provided Only For Education And Not To Be Used For Investing or Trading. See Terms & Conditions


One More Thing ... Get Best Stocks Delivered Daily!
Never Ever Miss A Move With Our Top Ten Stocks Lists
Find Best Stocks In Any Market - Bull or Bear Market
Take A Peek At Our Top Ten Stocks Lists: Daily, Weekly, Year-to-Date & Top Trends
Find Best Stocks In Any Market - Bull or Bear Market
Take A Peek At Our Top Ten Stocks Lists: Daily, Weekly, Year-to-Date & Top Trends
Smallcap Stocks With Best Up Trends [0-bearish to 100-bullish]: Surmodics [100], Rocky Brands[100], TransMedics Group[100], LendingClub [100], A10 s[100], Carpenter [100], UFP [100], PROCEPT BioRobotics[100], Xencor [100], Trinity Industries[100], TPG RE[100]
Best Smallcap Stocks Year-to-Date:
Janux [441.55%], Viking [310.45%], Longboard [259.25%], Alpine Immune[239.26%], Avidity Biosciences[185.4%], Bakkt [182.96%], Cullinan Oncology[175.33%], Vera [173.32%], Arcutis Bio[173.07%], Super Micro[159.62%], Y-mAbs [141.35%] Best Smallcap Stocks This Week:
Deciphera [73.07%], Eyenovia [44.86%], Cue Biopharma[39.93%], Poseida [30.52%], Seres [30.3%], P3 Health[29.62%], Phibro Animal[28.75%], TransMedics Group[27.69%], Surmodics [27.24%], LendingTree [26.12%], Rocky Brands[24.58%] Best Smallcap Stocks Daily:
Surmodics [29.62%], Rocky Brands[28.06%], TransMedics Group[24.91%], Ventyx Biosciences[24.63%], Eyenovia [21.17%], LendingClub [19.68%], Summit [19.08%], Powell Industries[18.74%], MiMedx Group[18.34%], CareDx [18.04%], A10 s[17.69%]