
 Login Sign Up


| |||||
 |  | ||||

| 12Stocks.com Market Intelligence |
Best SmallCap Stocks
|
| In a hurry? Small Cap Stock Lists: Performance Trends Table, Stock Charts
Sort Small Cap stocks: Daily, Weekly, Year-to-Date, Market Cap & Trends. Filter Small Cap stocks list by sector: Show all, Tech, Finance, Energy, Staples, Retail, Industrial, Materials, Utilities and HealthCare Filter Small Cap stocks list by size: All Large Medium Small and MicroCap |
| 12Stocks.com Small Cap Stocks Performances & Trends Daily | |||||||||
|
|  The overall Smart Investing & Trading Score is 14 (0-bearish to 100-bullish) which puts Small Cap index in short term bearish trend. The Smart Investing & Trading Score from previous trading session is 41 and hence a deterioration of trend.
| ||||||||
Here are the Smart Investing & Trading Scores of the most requested small cap stocks at 12Stocks.com (click stock name for detailed review):
|


| 12Stocks.com: Investing in Smallcap Index with Stocks | |
|
The following table helps investors and traders sort through current performance and trends (as measured by Smart Investing & Trading Score) of various
stocks in the Smallcap Index. Quick View: Move mouse or cursor over stock symbol (ticker) to view short-term technical chart and over stock name to view long term chart. Click on  to add stock symbol to your watchlist and to add stock symbol to your watchlist and  to view watchlist. Click on any ticker or stock name for detailed market intelligence report for that stock. to view watchlist. Click on any ticker or stock name for detailed market intelligence report for that stock. |
12Stocks.com Performance of Stocks in Smallcap Index
| Ticker | Stock Name | Watchlist | Category | Recent Price | Smart Investing & Trading Score | Change % | YTD Change% |
| LQDA | Liquidia |   | Health Care | 13.17 | 32 | 2.49 | 9.48% |
| BIPC | Brookfield Infrastructure | | Utilities | 31.23 | 60 | 2.49 | -11.48% |
| NYMT | New York | | Financials | 7.02 | 50 | 2.48 | -17.70% |
| AIN | Albany | | Industrials | 81.71 | 0 | 2.46 | -16.81% |
| BUSE | First Busey | | Financials | 22.89 | 57 | 2.46 | -7.78% |
| WSFS | WSFS Financial | | Financials | 43.78 | 93 | 2.46 | -4.68% |
| TELL | Tellurian | | Energy | 0.44 | 17 | 2.46 | -41.68% |
| STBA | S&T Bancorp | | Financials | 30.89 | 50 | 2.45 | -7.57% |
| BEAM | Beam | | Health Care | 21.74 | 32 | 2.45 | -20.13% |
| EGRX | Eagle | | Health Care | 4.19 | 28 | 2.44 | -19.89% |
| MIRM | Mirum | | Health Care | 25.72 | 57 | 2.43 | -12.87% |
| PACB | Pacific Biosciences | | Health Care | 1.69 | 49 | 2.42 | -82.77% |
| NUVL | Nuvalent | | Health Care | 70.56 | 64 | 2.42 | -3.99% |
| WABC | Westamerica Ban | | Financials | 47.67 | 86 | 2.41 | -15.49% |
| PUMP | ProPetro Holding | | Energy | 8.93 | 93 | 2.41 | 6.56% |
| CORT | Corcept | | Health Care | 23.88 | 90 | 2.40 | -26.48% |
| HTBK | Heritage Commerce | | Financials | 8.13 | 74 | 2.39 | -18.04% |
| IRON | Disc Medicine | | Health Care | 28.52 | 42 | 2.39 | -50.84% |
| IHRT | iHeartMedia | | Services & Goods | 2.15 | 44 | 2.38 | -19.48% |
| SLDP | Solid Power | | Industrials | 1.73 | 90 | 2.37 | 21.40% |
| HMN | Horace Mann | | Financials | 37.73 | 100 | 2.36 | 15.38% |
| GNW | Genworth Financial | | Financials | 6.07 | 64 | 2.36 | -9.13% |
| GHC | Graham | | Services & Goods | 717.90 | 65 | 2.36 | 3.07% |
| HROW | Harrow Health | | Health Care | 10.43 | 20 | 2.36 | -6.88% |
| XPEL | XPEL | | Consumer Staples | 53.79 | 53 | 2.36 | -0.11% |


| Too many stocks? View smallcap stocks filtered by marketcap & sector |
| Marketcap: All SmallCap Stocks (default-no microcap), Large, Mid-Range, Small |
| Smallcap Sector: Tech, Finance, Energy, Staples, Retail, Industrial, Materials, & Medical |
|
Get the most comprehensive stock market coverage daily at 12Stocks.com ➞ Best Stocks Today ➞ Best Stocks Weekly ➞ Best Stocks Year-to-Date ➞ Best Stocks Trends ➞  Best Stocks Today 12Stocks.com Best Nasdaq Stocks ➞ Best S&P 500 Stocks ➞ Best Tech Stocks ➞ Best Biotech Stocks ➞ |
| Detailed Overview of SmallCap Stocks |
| SmallCap Technical Overview, Leaders & Laggards, Top SmallCap ETF Funds & Detailed SmallCap Stocks List, Charts, Trends & More |
| Smallcap: Technical Analysis, Trends & YTD Performance | |
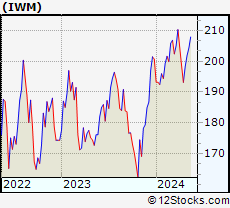
| SmallCap segment as represented by
IWM, an exchange-traded fund [ETF], holds basket of thousands of smallcap stocks from across all major sectors of the US stock market. The smallcap index (contains stocks like Riverbed & Sotheby's) is down by -2.19% and is currently underperforming the overall market by -6.73% year-to-date. Below is a quick view of technical charts and trends: | |
 IWM Weekly Chart |
|
| Long Term Trend: Not Good | |
| Medium Term Trend: Not Good | |
 IWM Daily Chart |
|
| Short Term Trend: Not Good | |
| Overall Trend Score: 14 | |
| YTD Performance: -2.19% | |
| **Trend Scores & Views Are Only For Educational Purposes And Not For Investing | |
| 12Stocks.com: Top Performing Small Cap Index Stocks | ||||||||||||||||||||||||||||||||||||||||||||||||
 The top performing Small Cap Index stocks year to date are
Now, more recently, over last week, the top performing Small Cap Index stocks on the move are


|
||||||||||||||||||||||||||||||||||||||||||||||||
| 12Stocks.com: Investing in Smallcap Index using Exchange Traded Funds | |
|
The following table shows list of key exchange traded funds (ETF) that
help investors track Smallcap index. The following list also includes leveraged ETF funds that track twice or thrice the daily returns of Smallcap indices. Short or inverse ETF funds move in the opposite direction to the index they track and are useful during market pullbacks or during bear markets. Quick View: Move mouse or cursor over ETF symbol (ticker) to view short-term technical chart and over ETF name to view long term chart. Click on ticker or stock name for detailed view. Click on to add stock symbol to your watchlist and to view watchlist. |
12Stocks.com List of ETFs that track Smallcap Index
| Ticker | ETF Name | Watchlist | Recent Price | Smart Investing & Trading Score | Change % | Week % | Year-to-date % |
| IWM | iShares Russell 2000 | | 196.31 | 14 | 0.21 | -1.05 | -2.19% |
| IJR | iShares Core S&P Small-Cap | | 104.74 | 22 | 0.34 | -0.86 | -3.24% |
| VTWO | Vanguard Russell 2000 ETF | | 79.36 | 14 | 0.25 | -1.07 | -2.15% |
| IWN | iShares Russell 2000 Value | | 149.82 | 22 | 0.52 | -0.87 | -3.55% |
| IJS | iShares S&P Small-Cap 600 Value | | 96.40 | 15 | 0.33 | -0.81 | -6.47% |
| IWO | iShares Russell 2000 Growth | | 249.58 | 7 | -0.30 | -1.39 | -1.05% |
| IJT | iShares S&P Small-Cap 600 Growth | | 124.94 | 15 | 0.27 | -0.91 | -0.16% |
| XSLV | PowerShares S&P SmallCap Low Volatil ETF | | 42.83 | 62 | 0.68 | 0.26 | -2.99% |
| SDD | ProShares UltraShort SmallCap600 | | 19.71 | 86 | 0.70 | 1.85 | 6.95% |
| SMLV | SPDR SSGA US Small Cap Low Volatil ETF | | 107.44 | 45 | 1.11 | -0.07 | -4.51% |
| SBB | ProShares Short SmallCap600 | | 16.56 | 79 | 0.05 | 1.06 | 3.94% |
| SAA | ProShares Ultra SmallCap600 | | 22.58 | 8 | -0.08 | -1.99 | -9.49% |
| 12Stocks.com: Charts, Trends, Fundamental Data and Performances of SmallCap Stocks | |
|
We now take in-depth look at all SmallCap stocks including charts, multi-period performances and overall trends (as measured by Smart Investing & Trading Score). One can sort SmallCap stocks (click link to choose) by Daily, Weekly and by Year-to-Date performances. Also, one can sort by size of the company or by market capitalization. |
| Select Your Default Chart Type: | |||||
| |||||
| Click on stock symbol or name for detailed view. Click on to add stock symbol to your watchlist and to view watchlist. Quick View: Move mouse or cursor over "Daily" to quickly view daily technical stock chart and over "Weekly" to view weekly technical stock chart. | |||||

 | LQDA Liquidia Technologies, Inc. |
| Sector: Health Care | |
| SubSector: Biotechnology | |
| MarketCap: 80.4785 Millions | |
| Recent Price: 13.17 Smart Investing & Trading Score: 32 | |
| Day Percent Change: 2.49% Day Change: 0.32 | |
| Week Change: 5.11% Year-to-date Change: 9.5% | |
| LQDA Links: Profile News Message Board | |
| Charts:- Daily , Weekly | |
| Add LQDA to Watchlist: View: Get Complete LQDA Trend Analysis ➞ | |
 | BIPC Brookfield Infrastructure Corporation |
| Sector: Utilities | |
| SubSector: Utilities Regulated Gas | |
| MarketCap: 31197 Millions | |
| Recent Price: 31.23 Smart Investing & Trading Score: 60 | |
| Day Percent Change: 2.49% Day Change: 0.76 | |
| Week Change: -0.22% Year-to-date Change: -11.5% | |
| BIPC Links: Profile News Message Board | |
| Charts:- Daily , Weekly | |
| Add BIPC to Watchlist: View: Get Complete BIPC Trend Analysis ➞ | |
 | NYMT New York Mortgage Trust, Inc. |
| Sector: Financials | |
| SubSector: Mortgage Investment | |
| MarketCap: 1038.39 Millions | |
| Recent Price: 7.02 Smart Investing & Trading Score: 50 | |
| Day Percent Change: 2.48% Day Change: 0.17 | |
| Week Change: -0.28% Year-to-date Change: -17.7% | |
| NYMT Links: Profile News Message Board | |
| Charts:- Daily , Weekly | |
| Add NYMT to Watchlist: View: Get Complete NYMT Trend Analysis ➞ | |
 | AIN Albany International Corp. |
| Sector: Industrials | |
| SubSector: Textile Industrial | |
| MarketCap: 1538.4 Millions | |
| Recent Price: 81.71 Smart Investing & Trading Score: 0 | |
| Day Percent Change: 2.46% Day Change: 1.96 | |
| Week Change: -6.81% Year-to-date Change: -16.8% | |
| AIN Links: Profile News Message Board | |
| Charts:- Daily , Weekly | |
| Add AIN to Watchlist: View: Get Complete AIN Trend Analysis ➞ | |
 | BUSE First Busey Corporation |
| Sector: Financials | |
| SubSector: Regional - Midwest Banks | |
| MarketCap: 876.97 Millions | |
| Recent Price: 22.89 Smart Investing & Trading Score: 57 | |
| Day Percent Change: 2.46% Day Change: 0.55 | |
| Week Change: 0.39% Year-to-date Change: -7.8% | |
| BUSE Links: Profile News Message Board | |
| Charts:- Daily , Weekly | |
| Add BUSE to Watchlist: View: Get Complete BUSE Trend Analysis ➞ | |
 | WSFS WSFS Financial Corporation |
| Sector: Financials | |
| SubSector: Regional - Mid-Atlantic Banks | |
| MarketCap: 1191.29 Millions | |
| Recent Price: 43.78 Smart Investing & Trading Score: 93 | |
| Day Percent Change: 2.46% Day Change: 1.05 | |
| Week Change: 2.17% Year-to-date Change: -4.7% | |
| WSFS Links: Profile News Message Board | |
| Charts:- Daily , Weekly | |
| Add WSFS to Watchlist: View: Get Complete WSFS Trend Analysis ➞ | |
 | TELL Tellurian Inc. |
| Sector: Energy | |
| SubSector: Oil & Gas Drilling & Exploration | |
| MarketCap: 245.339 Millions | |
| Recent Price: 0.44 Smart Investing & Trading Score: 17 | |
| Day Percent Change: 2.46% Day Change: 0.01 | |
| Week Change: -5.59% Year-to-date Change: -41.7% | |
| TELL Links: Profile News Message Board | |
| Charts:- Daily , Weekly | |
| Add TELL to Watchlist: View: Get Complete TELL Trend Analysis ➞ | |
 | STBA S&T Bancorp, Inc. |
| Sector: Financials | |
| SubSector: Regional - Northeast Banks | |
| MarketCap: 1136.99 Millions | |
| Recent Price: 30.89 Smart Investing & Trading Score: 50 | |
| Day Percent Change: 2.45% Day Change: 0.74 | |
| Week Change: -0.29% Year-to-date Change: -7.6% | |
| STBA Links: Profile News Message Board | |
| Charts:- Daily , Weekly | |
| Add STBA to Watchlist: View: Get Complete STBA Trend Analysis ➞ | |
 | BEAM Beam Therapeutics Inc. |
| Sector: Health Care | |
| SubSector: Biotechnology | |
| MarketCap: 44987 Millions | |
| Recent Price: 21.74 Smart Investing & Trading Score: 32 | |
| Day Percent Change: 2.45% Day Change: 0.52 | |
| Week Change: 1.68% Year-to-date Change: -20.1% | |
| BEAM Links: Profile News Message Board | |
| Charts:- Daily , Weekly | |
| Add BEAM to Watchlist: View: Get Complete BEAM Trend Analysis ➞ | |
 | EGRX Eagle Pharmaceuticals, Inc. |
| Sector: Health Care | |
| SubSector: Drugs - Generic | |
| MarketCap: 573.385 Millions | |
| Recent Price: 4.19 Smart Investing & Trading Score: 28 | |
| Day Percent Change: 2.44% Day Change: 0.10 | |
| Week Change: 0.72% Year-to-date Change: -19.9% | |
| EGRX Links: Profile News Message Board | |
| Charts:- Daily , Weekly | |
| Add EGRX to Watchlist: View: Get Complete EGRX Trend Analysis ➞ | |
 | MIRM Mirum Pharmaceuticals, Inc. |
| Sector: Health Care | |
| SubSector: Biotechnology | |
| MarketCap: 309.585 Millions | |
| Recent Price: 25.72 Smart Investing & Trading Score: 57 | |
| Day Percent Change: 2.43% Day Change: 0.61 | |
| Week Change: 5.15% Year-to-date Change: -12.9% | |
| MIRM Links: Profile News Message Board | |
| Charts:- Daily , Weekly | |
| Add MIRM to Watchlist: View: Get Complete MIRM Trend Analysis ➞ | |
 | PACB Pacific Biosciences of California, Inc. |
| Sector: Health Care | |
| SubSector: Biotechnology | |
| MarketCap: 470.685 Millions | |
| Recent Price: 1.69 Smart Investing & Trading Score: 49 | |
| Day Percent Change: 2.42% Day Change: 0.04 | |
| Week Change: 14.97% Year-to-date Change: -82.8% | |
| PACB Links: Profile News Message Board | |
| Charts:- Daily , Weekly | |
| Add PACB to Watchlist: View: Get Complete PACB Trend Analysis ➞ | |
 | NUVL Nuvalent, Inc. |
| Sector: Health Care | |
| SubSector: Biotechnology | |
| MarketCap: 2400 Millions | |
| Recent Price: 70.56 Smart Investing & Trading Score: 64 | |
| Day Percent Change: 2.42% Day Change: 1.67 | |
| Week Change: 5.62% Year-to-date Change: -4.0% | |
| NUVL Links: Profile News Message Board | |
| Charts:- Daily , Weekly | |
| Add NUVL to Watchlist: View: Get Complete NUVL Trend Analysis ➞ | |
 | WABC Westamerica Bancorporation |
| Sector: Financials | |
| SubSector: Regional - Pacific Banks | |
| MarketCap: 1557.69 Millions | |
| Recent Price: 47.67 Smart Investing & Trading Score: 86 | |
| Day Percent Change: 2.41% Day Change: 1.12 | |
| Week Change: 0.48% Year-to-date Change: -15.5% | |
| WABC Links: Profile News Message Board | |
| Charts:- Daily , Weekly | |
| Add WABC to Watchlist: View: Get Complete WABC Trend Analysis ➞ | |
 | PUMP ProPetro Holding Corp. |
| Sector: Energy | |
| SubSector: Oil & Gas Equipment & Services | |
| MarketCap: 181.261 Millions | |
| Recent Price: 8.93 Smart Investing & Trading Score: 93 | |
| Day Percent Change: 2.41% Day Change: 0.21 | |
| Week Change: -0.56% Year-to-date Change: 6.6% | |
| PUMP Links: Profile News Message Board | |
| Charts:- Daily , Weekly | |
| Add PUMP to Watchlist: View: Get Complete PUMP Trend Analysis ➞ | |
 | CORT Corcept Therapeutics Incorporated |
| Sector: Health Care | |
| SubSector: Biotechnology | |
| MarketCap: 1228.45 Millions | |
| Recent Price: 23.88 Smart Investing & Trading Score: 90 | |
| Day Percent Change: 2.40% Day Change: 0.56 | |
| Week Change: 4.74% Year-to-date Change: -26.5% | |
| CORT Links: Profile News Message Board | |
| Charts:- Daily , Weekly | |
| Add CORT to Watchlist: View: Get Complete CORT Trend Analysis ➞ | |
 | HTBK Heritage Commerce Corp |
| Sector: Financials | |
| SubSector: Regional - Pacific Banks | |
| MarketCap: 416.129 Millions | |
| Recent Price: 8.13 Smart Investing & Trading Score: 74 | |
| Day Percent Change: 2.39% Day Change: 0.19 | |
| Week Change: 1.63% Year-to-date Change: -18.0% | |
| HTBK Links: Profile News Message Board | |
| Charts:- Daily , Weekly | |
| Add HTBK to Watchlist: View: Get Complete HTBK Trend Analysis ➞ | |
 | IRON Disc Medicine Opco Inc |
| Sector: Health Care | |
| SubSector: Biotechnology | |
| MarketCap: 1100 Millions | |
| Recent Price: 28.52 Smart Investing & Trading Score: 42 | |
| Day Percent Change: 2.39% Day Change: 0.66 | |
| Week Change: 3.67% Year-to-date Change: -50.8% | |
| IRON Links: Profile News Message Board | |
| Charts:- Daily , Weekly | |
| Add IRON to Watchlist: View: Get Complete IRON Trend Analysis ➞ | |
 | IHRT iHeartMedia, Inc. |
| Sector: Services & Goods | |
| SubSector: Broadcasting - Radio | |
| MarketCap: 694 Millions | |
| Recent Price: 2.15 Smart Investing & Trading Score: 44 | |
| Day Percent Change: 2.38% Day Change: 0.05 | |
| Week Change: 0.47% Year-to-date Change: -19.5% | |
| IHRT Links: Profile News Message Board | |
| Charts:- Daily , Weekly | |
| Add IHRT to Watchlist: View: Get Complete IHRT Trend Analysis ➞ | |
 | SLDP Solid Power, Inc. |
| Sector: Industrials | |
| SubSector: Electrical Equipment & Parts | |
| MarketCap: 445 Millions | |
| Recent Price: 1.73 Smart Investing & Trading Score: 90 | |
| Day Percent Change: 2.37% Day Change: 0.04 | |
| Week Change: 1.17% Year-to-date Change: 21.4% | |
| SLDP Links: Profile News Message Board | |
| Charts:- Daily , Weekly | |
| Add SLDP to Watchlist: View: Get Complete SLDP Trend Analysis ➞ | |
 | HMN Horace Mann Educators Corporation |
| Sector: Financials | |
| SubSector: Property & Casualty Insurance | |
| MarketCap: 1545.52 Millions | |
| Recent Price: 37.73 Smart Investing & Trading Score: 100 | |
| Day Percent Change: 2.36% Day Change: 0.87 | |
| Week Change: 2.69% Year-to-date Change: 15.4% | |
| HMN Links: Profile News Message Board | |
| Charts:- Daily , Weekly | |
| Add HMN to Watchlist: View: Get Complete HMN Trend Analysis ➞ | |
 | GNW Genworth Financial, Inc. |
| Sector: Financials | |
| SubSector: Life Insurance | |
| MarketCap: 1719.76 Millions | |
| Recent Price: 6.07 Smart Investing & Trading Score: 64 | |
| Day Percent Change: 2.36% Day Change: 0.14 | |
| Week Change: 1.34% Year-to-date Change: -9.1% | |
| GNW Links: Profile News Message Board | |
| Charts:- Daily , Weekly | |
| Add GNW to Watchlist: View: Get Complete GNW Trend Analysis ➞ | |
 | GHC Graham Holdings Company |
| Sector: Services & Goods | |
| SubSector: Education & Training Services | |
| MarketCap: 1871.06 Millions | |
| Recent Price: 717.90 Smart Investing & Trading Score: 65 | |
| Day Percent Change: 2.36% Day Change: 16.53 | |
| Week Change: 0.01% Year-to-date Change: 3.1% | |
| GHC Links: Profile News Message Board | |
| Charts:- Daily , Weekly | |
| Add GHC to Watchlist: View: Get Complete GHC Trend Analysis ➞ | |
 | HROW Harrow Health, Inc. |
| Sector: Health Care | |
| SubSector: Drug Manufacturers - Other | |
| MarketCap: 104.033 Millions | |
| Recent Price: 10.43 Smart Investing & Trading Score: 20 | |
| Day Percent Change: 2.36% Day Change: 0.24 | |
| Week Change: -0.95% Year-to-date Change: -6.9% | |
| HROW Links: Profile News Message Board | |
| Charts:- Daily , Weekly | |
| Add HROW to Watchlist: View: Get Complete HROW Trend Analysis ➞ | |
 | XPEL XPEL, Inc. |
| Sector: Consumer Staples | |
| SubSector: Auto Parts | |
| MarketCap: 290.239 Millions | |
| Recent Price: 53.79 Smart Investing & Trading Score: 53 | |
| Day Percent Change: 2.36% Day Change: 1.24 | |
| Week Change: -1.74% Year-to-date Change: -0.1% | |
| XPEL Links: Profile News Message Board | |
| Charts:- Daily , Weekly | |
| Add XPEL to Watchlist: View: Get Complete XPEL Trend Analysis ➞ | |
| Too many stocks? View smallcap stocks filtered by marketcap & sector |
| Marketcap: All SmallCap Stocks (default-no microcap), Large, Mid-Range, Small & MicroCap |
| Sector: Tech, Finance, Energy, Staples, Retail, Industrial, Materials, Utilities & Medical |
|
Best Stocks Today 12Stocks.com |
© 2024 12Stocks.com Terms & Conditions Privacy Contact Us
All Information Provided Only For Education And Not To Be Used For Investing or Trading. See Terms & Conditions


One More Thing ... Get Best Stocks Delivered Daily!
Never Ever Miss A Move With Our Top Ten Stocks Lists
Find Best Stocks In Any Market - Bull or Bear Market
Take A Peek At Our Top Ten Stocks Lists: Daily, Weekly, Year-to-Date & Top Trends
Find Best Stocks In Any Market - Bull or Bear Market
Take A Peek At Our Top Ten Stocks Lists: Daily, Weekly, Year-to-Date & Top Trends
Smallcap Stocks With Best Up Trends [0-bearish to 100-bullish]: Surmodics [100], Rocky Brands[100], TransMedics Group[100], LendingClub [100], Summit [100], A10 s[100], Carpenter [100], UFP [100], PROCEPT BioRobotics[100], Xencor [100], Trinity Industries[100]
Best Smallcap Stocks Year-to-Date:
Janux [441.55%], Viking [310.69%], Longboard [259.25%], Alpine Immune[239.29%], Avidity Biosciences[185.4%], Bakkt [182.96%], Cullinan Oncology[175.33%], Arcutis Bio[173.68%], Vera [173.32%], Super Micro[159.73%], Y-mAbs [141.79%] Best Smallcap Stocks This Week:
Deciphera [73.11%], Eyenovia [45.65%], Cue Biopharma[39.56%], Seres [30.91%], Poseida [30.05%], P3 Health[29.62%], Phibro Animal[28.44%], TransMedics Group[27.72%], Surmodics [27.36%], LendingTree [26.36%], Rocky Brands[24.92%] Best Smallcap Stocks Daily:
Surmodics [29.74%], Rocky Brands[28.41%], TransMedics Group[24.93%], Ventyx Biosciences[24.63%], Eyenovia [21.84%], LendingClub [19.68%], Summit [19.59%], Powell Industries[18.89%], MiMedx Group[18.67%], CareDx [18.30%], A10 s[17.69%]