
 Login Sign Up


| |||||
 |  | ||||

| 12Stocks.com Market Intelligence |
Best SmallCap Stocks
|
| In a hurry? Small Cap Stock Lists: Performance Trends Table, Stock Charts
Sort Small Cap stocks: Daily, Weekly, Year-to-Date, Market Cap & Trends. Filter Small Cap stocks list by sector: Show all, Tech, Finance, Energy, Staples, Retail, Industrial, Materials, Utilities and HealthCare Filter Small Cap stocks list by size: All Large Medium Small and MicroCap |
| 12Stocks.com Small Cap Stocks Performances & Trends Daily | |||||||||
|
|  The overall Smart Investing & Trading Score is 14 (0-bearish to 100-bullish) which puts Small Cap index in short term bearish trend. The Smart Investing & Trading Score from previous trading session is 41 and hence a deterioration of trend.
| ||||||||
Here are the Smart Investing & Trading Scores of the most requested small cap stocks at 12Stocks.com (click stock name for detailed review):
|


| 12Stocks.com: Investing in Smallcap Index with Stocks | |
|
The following table helps investors and traders sort through current performance and trends (as measured by Smart Investing & Trading Score) of various
stocks in the Smallcap Index. Quick View: Move mouse or cursor over stock symbol (ticker) to view short-term technical chart and over stock name to view long term chart. Click on  to add stock symbol to your watchlist and to add stock symbol to your watchlist and  to view watchlist. Click on any ticker or stock name for detailed market intelligence report for that stock. to view watchlist. Click on any ticker or stock name for detailed market intelligence report for that stock. |
12Stocks.com Performance of Stocks in Smallcap Index
| Ticker | Stock Name | Watchlist | Category | Recent Price | Smart Investing & Trading Score | Change % | YTD Change% |
| RLJ | RLJ Lodging |   | Financials | 10.96 | 0 | -0.36 | -6.48% |
| FFWM | First Foundation | | Financials | 5.46 | 0 | -0.36 | -43.60% |
| DY | Dycom Industries | | Industrials | 139.50 | 53 | -0.37 | 21.21% |
| NEWT | Newtek Business | | Services & Goods | 10.75 | 15 | -0.37 | -22.10% |
| MOD | Modine | | Consumer Staples | 92.28 | 41 | -0.38 | 54.57% |
| NWPX | Northwest Pipe | | Materials | 31.63 | 54 | -0.38 | 4.53% |
| TSE | Trinseo S.A | | Materials | 2.60 | 20 | -0.38 | -68.94% |
| BLBD | Blue Bird | | Consumer Staples | 32.83 | 0 | -0.38 | 21.77% |
| NX | Quanex Building | | Industrials | 33.09 | 17 | -0.39 | 8.24% |
| BCO | Brink s | | Services & Goods | 87.12 | 41 | -0.39 | -0.94% |
| BELFB | Bel Fuse | | Technology | 58.49 | 66 | -0.39 | -12.40% |
| ROG | Rogers | | Technology | 118.62 | 73 | -0.39 | -10.18% |
| ATSG | Air Transport | | Transports | 12.77 | 61 | -0.39 | -27.48% |
| EPAC | Enerpac Tool | | Industrials | 35.49 | 48 | -0.39 | 14.15% |
| LZB | La-Z-Boy | | Consumer Staples | 32.71 | 0 | -0.40 | -11.40% |
| CXW | CoreCivic | | Financials | 14.84 | 10 | -0.40 | 2.13% |
| VSTO | Vista Outdoor | | Consumer Staples | 34.95 | 75 | -0.40 | 18.19% |
| ATMU | Atmus Filtration | | Industrials | 30.17 | 53 | -0.40 | 29.10% |
| GCI | Gannett Co | | Services & Goods | 2.41 | 48 | -0.41 | 4.78% |
| CBAN | Colony Bankcorp | | Financials | 10.98 | 47 | -0.41 | -17.44% |
| PATK | Patrick Industries | | Industrials | 104.06 | 0 | -0.41 | 3.70% |
| CWK | Cushman & Wakefield | | Financials | 9.61 | 12 | -0.41 | -11.02% |
| JOE | St. Joe | | Financials | 56.96 | 41 | -0.42 | -5.35% |
| AGYS | Agilysys | | Technology | 82.70 | 51 | -0.42 | -2.50% |
| SMMF | Summit Financial | | Financials | 26.36 | 25 | -0.42 | -14.11% |


| Too many stocks? View smallcap stocks filtered by marketcap & sector |
| Marketcap: All SmallCap Stocks (default-no microcap), Large, Mid-Range, Small |
| Smallcap Sector: Tech, Finance, Energy, Staples, Retail, Industrial, Materials, & Medical |
|
Get the most comprehensive stock market coverage daily at 12Stocks.com ➞ Best Stocks Today ➞ Best Stocks Weekly ➞ Best Stocks Year-to-Date ➞ Best Stocks Trends ➞  Best Stocks Today 12Stocks.com Best Nasdaq Stocks ➞ Best S&P 500 Stocks ➞ Best Tech Stocks ➞ Best Biotech Stocks ➞ |
| Detailed Overview of SmallCap Stocks |
| SmallCap Technical Overview, Leaders & Laggards, Top SmallCap ETF Funds & Detailed SmallCap Stocks List, Charts, Trends & More |
| Smallcap: Technical Analysis, Trends & YTD Performance | |
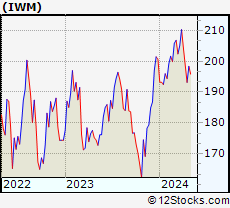
| SmallCap segment as represented by
IWM, an exchange-traded fund [ETF], holds basket of thousands of smallcap stocks from across all major sectors of the US stock market. The smallcap index (contains stocks like Riverbed & Sotheby's) is down by -2.19% and is currently underperforming the overall market by -6.73% year-to-date. Below is a quick view of technical charts and trends: | |
 IWM Weekly Chart |
|
| Long Term Trend: Not Good | |
| Medium Term Trend: Not Good | |
 IWM Daily Chart |
|
| Short Term Trend: Not Good | |
| Overall Trend Score: 14 | |
| YTD Performance: -2.19% | |
| **Trend Scores & Views Are Only For Educational Purposes And Not For Investing | |
| 12Stocks.com: Top Performing Small Cap Index Stocks | ||||||||||||||||||||||||||||||||||||||||||||||||
 The top performing Small Cap Index stocks year to date are
Now, more recently, over last week, the top performing Small Cap Index stocks on the move are


|
||||||||||||||||||||||||||||||||||||||||||||||||
| 12Stocks.com: Investing in Smallcap Index using Exchange Traded Funds | |
|
The following table shows list of key exchange traded funds (ETF) that
help investors track Smallcap index. The following list also includes leveraged ETF funds that track twice or thrice the daily returns of Smallcap indices. Short or inverse ETF funds move in the opposite direction to the index they track and are useful during market pullbacks or during bear markets. Quick View: Move mouse or cursor over ETF symbol (ticker) to view short-term technical chart and over ETF name to view long term chart. Click on ticker or stock name for detailed view. Click on to add stock symbol to your watchlist and to view watchlist. |
12Stocks.com List of ETFs that track Smallcap Index
| Ticker | ETF Name | Watchlist | Recent Price | Smart Investing & Trading Score | Change % | Week % | Year-to-date % |
| IWM | iShares Russell 2000 | | 196.31 | 14 | 0.21 | -1.05 | -2.19% |
| IJR | iShares Core S&P Small-Cap | | 104.74 | 22 | 0.34 | -0.86 | -3.24% |
| VTWO | Vanguard Russell 2000 ETF | | 79.36 | 14 | 0.25 | -1.07 | -2.15% |
| IWN | iShares Russell 2000 Value | | 149.82 | 22 | 0.52 | -0.87 | -3.55% |
| IJS | iShares S&P Small-Cap 600 Value | | 96.40 | 15 | 0.33 | -0.81 | -6.47% |
| IWO | iShares Russell 2000 Growth | | 249.58 | 7 | -0.30 | -1.39 | -1.05% |
| IJT | iShares S&P Small-Cap 600 Growth | | 124.94 | 15 | 0.27 | -0.91 | -0.16% |
| XSLV | PowerShares S&P SmallCap Low Volatil ETF | | 42.83 | 62 | 0.68 | 0.26 | -2.99% |
| SDD | ProShares UltraShort SmallCap600 | | 19.71 | 86 | 0.70 | 1.85 | 6.95% |
| SMLV | SPDR SSGA US Small Cap Low Volatil ETF | | 107.44 | 45 | 1.11 | -0.07 | -4.51% |
| SBB | ProShares Short SmallCap600 | | 16.56 | 79 | 0.05 | 1.06 | 3.94% |
| SAA | ProShares Ultra SmallCap600 | | 22.58 | 8 | -0.08 | -1.99 | -9.49% |
| 12Stocks.com: Charts, Trends, Fundamental Data and Performances of SmallCap Stocks | |
|
We now take in-depth look at all SmallCap stocks including charts, multi-period performances and overall trends (as measured by Smart Investing & Trading Score). One can sort SmallCap stocks (click link to choose) by Daily, Weekly and by Year-to-Date performances. Also, one can sort by size of the company or by market capitalization. |
| Select Your Default Chart Type: | |||||
| |||||
| Click on stock symbol or name for detailed view. Click on to add stock symbol to your watchlist and to view watchlist. Quick View: Move mouse or cursor over "Daily" to quickly view daily technical stock chart and over "Weekly" to view weekly technical stock chart. | |||||

 | RLJ RLJ Lodging Trust |
| Sector: Financials | |
| SubSector: REIT - Hotel/Motel | |
| MarketCap: 1019.34 Millions | |
| Recent Price: 10.96 Smart Investing & Trading Score: 0 | |
| Day Percent Change: -0.36% Day Change: -0.04 | |
| Week Change: -1.35% Year-to-date Change: -6.5% | |
| RLJ Links: Profile News Message Board | |
| Charts:- Daily , Weekly | |
| Add RLJ to Watchlist: View: Get Complete RLJ Trend Analysis ➞ | |
 | FFWM First Foundation Inc. |
| Sector: Financials | |
| SubSector: Regional - Midwest Banks | |
| MarketCap: 457.17 Millions | |
| Recent Price: 5.46 Smart Investing & Trading Score: 0 | |
| Day Percent Change: -0.36% Day Change: -0.02 | |
| Week Change: -10.2% Year-to-date Change: -43.6% | |
| FFWM Links: Profile News Message Board | |
| Charts:- Daily , Weekly | |
| Add FFWM to Watchlist: View: Get Complete FFWM Trend Analysis ➞ | |
 | DY Dycom Industries, Inc. |
| Sector: Industrials | |
| SubSector: Heavy Construction | |
| MarketCap: 576.295 Millions | |
| Recent Price: 139.50 Smart Investing & Trading Score: 53 | |
| Day Percent Change: -0.37% Day Change: -0.52 | |
| Week Change: -2.28% Year-to-date Change: 21.2% | |
| DY Links: Profile News Message Board | |
| Charts:- Daily , Weekly | |
| Add DY to Watchlist: View: Get Complete DY Trend Analysis ➞ | |
 | NEWT Newtek Business Services Corp. |
| Sector: Services & Goods | |
| SubSector: Business Services | |
| MarketCap: 243.982 Millions | |
| Recent Price: 10.75 Smart Investing & Trading Score: 15 | |
| Day Percent Change: -0.37% Day Change: -0.04 | |
| Week Change: -2.27% Year-to-date Change: -22.1% | |
| NEWT Links: Profile News Message Board | |
| Charts:- Daily , Weekly | |
| Add NEWT to Watchlist: View: Get Complete NEWT Trend Analysis ➞ | |
 | MOD Modine Manufacturing Company |
| Sector: Consumer Staples | |
| SubSector: Auto Parts | |
| MarketCap: 177.339 Millions | |
| Recent Price: 92.28 Smart Investing & Trading Score: 41 | |
| Day Percent Change: -0.38% Day Change: -0.35 | |
| Week Change: -4.61% Year-to-date Change: 54.6% | |
| MOD Links: Profile News Message Board | |
| Charts:- Daily , Weekly | |
| Add MOD to Watchlist: View: Get Complete MOD Trend Analysis ➞ | |
 | NWPX Northwest Pipe Company |
| Sector: Materials | |
| SubSector: Steel & Iron | |
| MarketCap: 245.788 Millions | |
| Recent Price: 31.63 Smart Investing & Trading Score: 54 | |
| Day Percent Change: -0.38% Day Change: -0.12 | |
| Week Change: -0.57% Year-to-date Change: 4.5% | |
| NWPX Links: Profile News Message Board | |
| Charts:- Daily , Weekly | |
| Add NWPX to Watchlist: View: Get Complete NWPX Trend Analysis ➞ | |
 | TSE Trinseo S.A. |
| Sector: Materials | |
| SubSector: Specialty Chemicals | |
| MarketCap: 790.057 Millions | |
| Recent Price: 2.60 Smart Investing & Trading Score: 20 | |
| Day Percent Change: -0.38% Day Change: -0.01 | |
| Week Change: -7.47% Year-to-date Change: -68.9% | |
| TSE Links: Profile News Message Board | |
| Charts:- Daily , Weekly | |
| Add TSE to Watchlist: View: Get Complete TSE Trend Analysis ➞ | |
 | BLBD Blue Bird Corporation |
| Sector: Consumer Staples | |
| SubSector: Auto Manufacturers - Major | |
| MarketCap: 345.371 Millions | |
| Recent Price: 32.83 Smart Investing & Trading Score: 0 | |
| Day Percent Change: -0.38% Day Change: -0.13 | |
| Week Change: -3.36% Year-to-date Change: 21.8% | |
| BLBD Links: Profile News Message Board | |
| Charts:- Daily , Weekly | |
| Add BLBD to Watchlist: View: Get Complete BLBD Trend Analysis ➞ | |
 | NX Quanex Building Products Corporation |
| Sector: Industrials | |
| SubSector: General Building Materials | |
| MarketCap: 315.453 Millions | |
| Recent Price: 33.09 Smart Investing & Trading Score: 17 | |
| Day Percent Change: -0.39% Day Change: -0.13 | |
| Week Change: -2.13% Year-to-date Change: 8.2% | |
| NX Links: Profile News Message Board | |
| Charts:- Daily , Weekly | |
| Add NX to Watchlist: View: Get Complete NX Trend Analysis ➞ | |
 | BCO The Brink s Company |
| Sector: Services & Goods | |
| SubSector: Security & Protection Services | |
| MarketCap: 2544.73 Millions | |
| Recent Price: 87.12 Smart Investing & Trading Score: 41 | |
| Day Percent Change: -0.39% Day Change: -0.34 | |
| Week Change: -1.81% Year-to-date Change: -0.9% | |
| BCO Links: Profile News Message Board | |
| Charts:- Daily , Weekly | |
| Add BCO to Watchlist: View: Get Complete BCO Trend Analysis ➞ | |
 | BELFB Bel Fuse Inc. |
| Sector: Technology | |
| SubSector: Diversified Electronics | |
| MarketCap: 77.0396 Millions | |
| Recent Price: 58.49 Smart Investing & Trading Score: 66 | |
| Day Percent Change: -0.39% Day Change: -0.23 | |
| Week Change: 1% Year-to-date Change: -12.4% | |
| BELFB Links: Profile News Message Board | |
| Charts:- Daily , Weekly | |
| Add BELFB to Watchlist: View: Get Complete BELFB Trend Analysis ➞ | |
 | ROG Rogers Corporation |
| Sector: Technology | |
| SubSector: Diversified Electronics | |
| MarketCap: 1756.36 Millions | |
| Recent Price: 118.62 Smart Investing & Trading Score: 73 | |
| Day Percent Change: -0.39% Day Change: -0.47 | |
| Week Change: -1.99% Year-to-date Change: -10.2% | |
| ROG Links: Profile News Message Board | |
| Charts:- Daily , Weekly | |
| Add ROG to Watchlist: View: Get Complete ROG Trend Analysis ➞ | |
 | ATSG Air Transport Services Group, Inc. |
| Sector: Transports | |
| SubSector: Air Delivery & Freight Services | |
| MarketCap: 1111.68 Millions | |
| Recent Price: 12.77 Smart Investing & Trading Score: 61 | |
| Day Percent Change: -0.39% Day Change: -0.05 | |
| Week Change: -1.08% Year-to-date Change: -27.5% | |
| ATSG Links: Profile News Message Board | |
| Charts:- Daily , Weekly | |
| Add ATSG to Watchlist: View: Get Complete ATSG Trend Analysis ➞ | |
 | EPAC Enerpac Tool Group Corp. |
| Sector: Industrials | |
| SubSector: Diversified Machinery | |
| MarketCap: 1044.16 Millions | |
| Recent Price: 35.49 Smart Investing & Trading Score: 48 | |
| Day Percent Change: -0.39% Day Change: -0.14 | |
| Week Change: -1.8% Year-to-date Change: 14.2% | |
| EPAC Links: Profile News Message Board | |
| Charts:- Daily , Weekly | |
| Add EPAC to Watchlist: View: Get Complete EPAC Trend Analysis ➞ | |
 | LZB La-Z-Boy Incorporated |
| Sector: Consumer Staples | |
| SubSector: Home Furnishings & Fixtures | |
| MarketCap: 951.635 Millions | |
| Recent Price: 32.71 Smart Investing & Trading Score: 0 | |
| Day Percent Change: -0.40% Day Change: -0.13 | |
| Week Change: -1.21% Year-to-date Change: -11.4% | |
| LZB Links: Profile News Message Board | |
| Charts:- Daily , Weekly | |
| Add LZB to Watchlist: View: Get Complete LZB Trend Analysis ➞ | |
 | CXW CoreCivic, Inc. |
| Sector: Financials | |
| SubSector: REIT - Diversified | |
| MarketCap: 1440.23 Millions | |
| Recent Price: 14.84 Smart Investing & Trading Score: 10 | |
| Day Percent Change: -0.40% Day Change: -0.06 | |
| Week Change: -1.46% Year-to-date Change: 2.1% | |
| CXW Links: Profile News Message Board | |
| Charts:- Daily , Weekly | |
| Add CXW to Watchlist: View: Get Complete CXW Trend Analysis ➞ | |
 | VSTO Vista Outdoor Inc. |
| Sector: Consumer Staples | |
| SubSector: Sporting Goods | |
| MarketCap: 405.144 Millions | |
| Recent Price: 34.95 Smart Investing & Trading Score: 75 | |
| Day Percent Change: -0.40% Day Change: -0.14 | |
| Week Change: -0.06% Year-to-date Change: 18.2% | |
| VSTO Links: Profile News Message Board | |
| Charts:- Daily , Weekly | |
| Add VSTO to Watchlist: View: Get Complete VSTO Trend Analysis ➞ | |
 | ATMU Atmus Filtration Technologies Inc. |
| Sector: Industrials | |
| SubSector: Pollution & Treatment Controls | |
| MarketCap: 1830 Millions | |
| Recent Price: 30.17 Smart Investing & Trading Score: 53 | |
| Day Percent Change: -0.40% Day Change: -0.12 | |
| Week Change: -3.61% Year-to-date Change: 29.1% | |
| ATMU Links: Profile News Message Board | |
| Charts:- Daily , Weekly | |
| Add ATMU to Watchlist: View: Get Complete ATMU Trend Analysis ➞ | |
 | GCI Gannett Co., Inc. |
| Sector: Services & Goods | |
| SubSector: Publishing - Newspapers | |
| MarketCap: 222.322 Millions | |
| Recent Price: 2.41 Smart Investing & Trading Score: 48 | |
| Day Percent Change: -0.41% Day Change: -0.01 | |
| Week Change: -6.59% Year-to-date Change: 4.8% | |
| GCI Links: Profile News Message Board | |
| Charts:- Daily , Weekly | |
| Add GCI to Watchlist: View: Get Complete GCI Trend Analysis ➞ | |
 | CBAN Colony Bankcorp, Inc. |
| Sector: Financials | |
| SubSector: Regional - Mid-Atlantic Banks | |
| MarketCap: 115.559 Millions | |
| Recent Price: 10.98 Smart Investing & Trading Score: 47 | |
| Day Percent Change: -0.41% Day Change: -0.04 | |
| Week Change: 1.67% Year-to-date Change: -17.4% | |
| CBAN Links: Profile News Message Board | |
| Charts:- Daily , Weekly | |
| Add CBAN to Watchlist: View: Get Complete CBAN Trend Analysis ➞ | |
 | PATK Patrick Industries, Inc. |
| Sector: Industrials | |
| SubSector: Lumber, Wood Production | |
| MarketCap: 565.838 Millions | |
| Recent Price: 104.06 Smart Investing & Trading Score: 0 | |
| Day Percent Change: -0.41% Day Change: -0.43 | |
| Week Change: -1.36% Year-to-date Change: 3.7% | |
| PATK Links: Profile News Message Board | |
| Charts:- Daily , Weekly | |
| Add PATK to Watchlist: View: Get Complete PATK Trend Analysis ➞ | |
 | CWK Cushman & Wakefield plc |
| Sector: Financials | |
| SubSector: Property Management | |
| MarketCap: 2651.62 Millions | |
| Recent Price: 9.61 Smart Investing & Trading Score: 12 | |
| Day Percent Change: -0.41% Day Change: -0.04 | |
| Week Change: -1.13% Year-to-date Change: -11.0% | |
| CWK Links: Profile News Message Board | |
| Charts:- Daily , Weekly | |
| Add CWK to Watchlist: View: Get Complete CWK Trend Analysis ➞ | |
 | JOE The St. Joe Company |
| Sector: Financials | |
| SubSector: Real Estate Development | |
| MarketCap: 1029.39 Millions | |
| Recent Price: 56.96 Smart Investing & Trading Score: 41 | |
| Day Percent Change: -0.42% Day Change: -0.24 | |
| Week Change: -2.68% Year-to-date Change: -5.4% | |
| JOE Links: Profile News Message Board | |
| Charts:- Daily , Weekly | |
| Add JOE to Watchlist: View: Get Complete JOE Trend Analysis ➞ | |
 | AGYS Agilysys, Inc. |
| Sector: Technology | |
| SubSector: Application Software | |
| MarketCap: 391.862 Millions | |
| Recent Price: 82.70 Smart Investing & Trading Score: 51 | |
| Day Percent Change: -0.42% Day Change: -0.35 | |
| Week Change: -0.36% Year-to-date Change: -2.5% | |
| AGYS Links: Profile News Message Board | |
| Charts:- Daily , Weekly | |
| Add AGYS to Watchlist: View: Get Complete AGYS Trend Analysis ➞ | |
 | SMMF Summit Financial Group, Inc. |
| Sector: Financials | |
| SubSector: Regional - Mid-Atlantic Banks | |
| MarketCap: 228.959 Millions | |
| Recent Price: 26.36 Smart Investing & Trading Score: 25 | |
| Day Percent Change: -0.42% Day Change: -0.11 | |
| Week Change: -3.97% Year-to-date Change: -14.1% | |
| SMMF Links: Profile News Message Board | |
| Charts:- Daily , Weekly | |
| Add SMMF to Watchlist: View: Get Complete SMMF Trend Analysis ➞ | |
| Too many stocks? View smallcap stocks filtered by marketcap & sector |
| Marketcap: All SmallCap Stocks (default-no microcap), Large, Mid-Range, Small & MicroCap |
| Sector: Tech, Finance, Energy, Staples, Retail, Industrial, Materials, Utilities & Medical |
|
Best Stocks Today 12Stocks.com |
© 2024 12Stocks.com Terms & Conditions Privacy Contact Us
All Information Provided Only For Education And Not To Be Used For Investing or Trading. See Terms & Conditions


One More Thing ... Get Best Stocks Delivered Daily!
Never Ever Miss A Move With Our Top Ten Stocks Lists
Find Best Stocks In Any Market - Bull or Bear Market
Take A Peek At Our Top Ten Stocks Lists: Daily, Weekly, Year-to-Date & Top Trends
Find Best Stocks In Any Market - Bull or Bear Market
Take A Peek At Our Top Ten Stocks Lists: Daily, Weekly, Year-to-Date & Top Trends
Smallcap Stocks With Best Up Trends [0-bearish to 100-bullish]: Surmodics [100], Rocky Brands[100], TransMedics Group[100], LendingClub [100], Summit [100], A10 s[100], Carpenter [100], UFP [100], PROCEPT BioRobotics[100], Xencor [100], Trinity Industries[100]
Best Smallcap Stocks Year-to-Date:
Janux [441.55%], Viking [310.69%], Longboard [259.25%], Alpine Immune[239.29%], Avidity Biosciences[185.4%], Bakkt [182.96%], Cullinan Oncology[175.33%], Arcutis Bio[173.68%], Vera [173.32%], Super Micro[159.73%], Y-mAbs [141.79%] Best Smallcap Stocks This Week:
Deciphera [73.11%], Eyenovia [45.65%], Cue Biopharma[39.56%], Seres [30.91%], Poseida [30.05%], P3 Health[29.62%], Phibro Animal[28.44%], TransMedics Group[27.72%], Surmodics [27.36%], LendingTree [26.36%], Rocky Brands[24.92%] Best Smallcap Stocks Daily:
Surmodics [29.74%], Rocky Brands[28.41%], TransMedics Group[24.93%], Ventyx Biosciences[24.63%], Eyenovia [21.84%], LendingClub [19.68%], Summit [19.59%], Powell Industries[18.89%], MiMedx Group[18.67%], CareDx [18.30%], A10 s[17.69%]