
 Login Sign Up


| |||||
 |  | ||||

| 12Stocks.com Market Intelligence |
Best SmallCap Stocks
|
| In a hurry? Small Cap Stock Lists: Performance Trends Table, Stock Charts
Sort Small Cap stocks: Daily, Weekly, Year-to-Date, Market Cap & Trends. Filter Small Cap stocks list by sector: Show all, Tech, Finance, Energy, Staples, Retail, Industrial, Materials, Utilities and HealthCare Filter Small Cap stocks list by size: All Large Medium Small and MicroCap |
| 12Stocks.com Small Cap Stocks Performances & Trends Daily | |||||||||
|
|  The overall Smart Investing & Trading Score is 14 (0-bearish to 100-bullish) which puts Small Cap index in short term bearish trend. The Smart Investing & Trading Score from previous trading session is 41 and hence a deterioration of trend.
| ||||||||
Here are the Smart Investing & Trading Scores of the most requested small cap stocks at 12Stocks.com (click stock name for detailed review):
|


| 12Stocks.com: Investing in Smallcap Index with Stocks | |
|
The following table helps investors and traders sort through current performance and trends (as measured by Smart Investing & Trading Score) of various
stocks in the Smallcap Index. Quick View: Move mouse or cursor over stock symbol (ticker) to view short-term technical chart and over stock name to view long term chart. Click on  to add stock symbol to your watchlist and to add stock symbol to your watchlist and  to view watchlist. Click on any ticker or stock name for detailed market intelligence report for that stock. to view watchlist. Click on any ticker or stock name for detailed market intelligence report for that stock. |
12Stocks.com Performance of Stocks in Smallcap Index
| Ticker | Stock Name | Watchlist | Category | Recent Price | Smart Investing & Trading Score | Change % | YTD Change% |
| ANDE | Andersons |   | Consumer Staples | 54.96 | 13 | 0.04 | -4.48% |
| NC | NACCO Industries | | Consumer Staples | 27.55 | 17 | 0.04 | -24.52% |
| EPRT | Essential Properties | | Financials | 26.35 | 100 | 0.04 | 3.09% |
| THFF | First Financial | | Financials | 36.42 | 32 | 0.03 | -15.36% |
| ENV | Envestnet | | Services & Goods | 62.09 | 73 | 0.03 | 25.38% |
| ALEX | Alexander & Baldwin | | Financials | 16.47 | 100 | 0.00 | -13.41% |
| SCS | Steelcase | | Consumer Staples | 12.03 | 30 | 0.00 | -11.02% |
| VHI | Valhi | | Materials | 14.77 | 46 | 0.00 | -2.76% |
| IRBT | iRobot | | Consumer Staples | 8.56 | 74 | 0.00 | -77.88% |
| ANGO | AngioDynamics | | Health Care | 5.79 | 61 | 0.00 | -26.15% |
| CNSL | Consolidated | | Technology | 4.32 | 62 | 0.00 | -0.69% |
| PGC | Peapack-Gladstone Financial | | Financials | 22.38 | 10 | 0.00 | -24.95% |
| GSAT | Globalstar | | Technology | 1.29 | 34 | 0.00 | -33.51% |
| CLNE | Clean Energy | | Utilities | 2.32 | 27 | 0.00 | -39.43% |
| HRT | HireRight | | Industrials | 14.30 | 68 | 0.00 | 6.32% |
| AMPL | Amplitude | | Technology | 9.80 | 29 | 0.00 | -23.20% |
| GOGO | Gogo | | Technology | 9.06 | 83 | 0.00 | -10.56% |
| CIVB | Civista Bancshares | | Financials | 14.28 | 18 | 0.00 | -22.56% |
| TUSK | Mammoth Energy | | Energy | 3.25 | 10 | 0.00 | -27.13% |
| XERS | Xeris | | Health Care | 1.75 | 17 | 0.00 | -25.69% |
| DHC | Diversified Healthcare | | Financials | 2.36 | 27 | 0.00 | -36.90% |
| UONEK | Urban One | | Services & Goods | 1.55 | 25 | 0.00 | -54.94% |
| VEL | Velocity Financial | | Financials | 17.15 | 83 | 0.00 | 3.19% |
| HSHP | Himalaya Shipping | | Industrials | 8.17 | 56 | 0.00 | 21.04% |
| SGHT | Sight Sciences | | Health Care | 5.55 | 68 | 0.00 | 7.45% |


| Too many stocks? View smallcap stocks filtered by marketcap & sector |
| Marketcap: All SmallCap Stocks (default-no microcap), Large, Mid-Range, Small |
| Smallcap Sector: Tech, Finance, Energy, Staples, Retail, Industrial, Materials, & Medical |
|
Get the most comprehensive stock market coverage daily at 12Stocks.com ➞ Best Stocks Today ➞ Best Stocks Weekly ➞ Best Stocks Year-to-Date ➞ Best Stocks Trends ➞  Best Stocks Today 12Stocks.com Best Nasdaq Stocks ➞ Best S&P 500 Stocks ➞ Best Tech Stocks ➞ Best Biotech Stocks ➞ |
| Detailed Overview of SmallCap Stocks |
| SmallCap Technical Overview, Leaders & Laggards, Top SmallCap ETF Funds & Detailed SmallCap Stocks List, Charts, Trends & More |
| Smallcap: Technical Analysis, Trends & YTD Performance | |
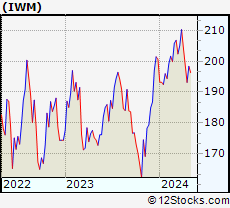
| SmallCap segment as represented by
IWM, an exchange-traded fund [ETF], holds basket of thousands of smallcap stocks from across all major sectors of the US stock market. The smallcap index (contains stocks like Riverbed & Sotheby's) is down by -2.19% and is currently underperforming the overall market by -6.73% year-to-date. Below is a quick view of technical charts and trends: | |
 IWM Weekly Chart |
|
| Long Term Trend: Not Good | |
| Medium Term Trend: Not Good | |
 IWM Daily Chart |
|
| Short Term Trend: Not Good | |
| Overall Trend Score: 14 | |
| YTD Performance: -2.19% | |
| **Trend Scores & Views Are Only For Educational Purposes And Not For Investing | |
| 12Stocks.com: Top Performing Small Cap Index Stocks | ||||||||||||||||||||||||||||||||||||||||||||||||
 The top performing Small Cap Index stocks year to date are
Now, more recently, over last week, the top performing Small Cap Index stocks on the move are


|
||||||||||||||||||||||||||||||||||||||||||||||||
| 12Stocks.com: Investing in Smallcap Index using Exchange Traded Funds | |
|
The following table shows list of key exchange traded funds (ETF) that
help investors track Smallcap index. The following list also includes leveraged ETF funds that track twice or thrice the daily returns of Smallcap indices. Short or inverse ETF funds move in the opposite direction to the index they track and are useful during market pullbacks or during bear markets. Quick View: Move mouse or cursor over ETF symbol (ticker) to view short-term technical chart and over ETF name to view long term chart. Click on ticker or stock name for detailed view. Click on to add stock symbol to your watchlist and to view watchlist. |
12Stocks.com List of ETFs that track Smallcap Index
| Ticker | ETF Name | Watchlist | Recent Price | Smart Investing & Trading Score | Change % | Week % | Year-to-date % |
| IWM | iShares Russell 2000 | | 196.31 | 14 | 0.21 | -1.05 | -2.19% |
| IJR | iShares Core S&P Small-Cap | | 104.74 | 22 | 0.34 | -0.86 | -3.24% |
| VTWO | Vanguard Russell 2000 ETF | | 79.36 | 14 | 0.25 | -1.07 | -2.15% |
| IWN | iShares Russell 2000 Value | | 149.82 | 22 | 0.52 | -0.87 | -3.55% |
| IJS | iShares S&P Small-Cap 600 Value | | 96.40 | 15 | 0.33 | -0.81 | -6.47% |
| IWO | iShares Russell 2000 Growth | | 249.58 | 7 | -0.30 | -1.39 | -1.05% |
| IJT | iShares S&P Small-Cap 600 Growth | | 124.94 | 15 | 0.27 | -0.91 | -0.16% |
| XSLV | PowerShares S&P SmallCap Low Volatil ETF | | 42.83 | 62 | 0.68 | 0.26 | -2.99% |
| SDD | ProShares UltraShort SmallCap600 | | 19.71 | 86 | 0.70 | 1.85 | 6.95% |
| SMLV | SPDR SSGA US Small Cap Low Volatil ETF | | 107.44 | 45 | 1.11 | -0.07 | -4.51% |
| SBB | ProShares Short SmallCap600 | | 16.56 | 79 | 0.05 | 1.06 | 3.94% |
| SAA | ProShares Ultra SmallCap600 | | 22.58 | 8 | -0.08 | -1.99 | -9.49% |
| 12Stocks.com: Charts, Trends, Fundamental Data and Performances of SmallCap Stocks | |
|
We now take in-depth look at all SmallCap stocks including charts, multi-period performances and overall trends (as measured by Smart Investing & Trading Score). One can sort SmallCap stocks (click link to choose) by Daily, Weekly and by Year-to-Date performances. Also, one can sort by size of the company or by market capitalization. |
| Select Your Default Chart Type: | |||||
| |||||
| Click on stock symbol or name for detailed view. Click on to add stock symbol to your watchlist and to view watchlist. Quick View: Move mouse or cursor over "Daily" to quickly view daily technical stock chart and over "Weekly" to view weekly technical stock chart. | |||||

 | ANDE The Andersons, Inc. |
| Sector: Consumer Staples | |
| SubSector: Farm Products | |
| MarketCap: 630.887 Millions | |
| Recent Price: 54.96 Smart Investing & Trading Score: 13 | |
| Day Percent Change: 0.04% Day Change: 0.02 | |
| Week Change: -3.43% Year-to-date Change: -4.5% | |
| ANDE Links: Profile News Message Board | |
| Charts:- Daily , Weekly | |
| Add ANDE to Watchlist: View: Get Complete ANDE Trend Analysis ➞ | |
 | NC NACCO Industries, Inc. |
| Sector: Consumer Staples | |
| SubSector: Home Furnishings & Fixtures | |
| MarketCap: 179.835 Millions | |
| Recent Price: 27.55 Smart Investing & Trading Score: 17 | |
| Day Percent Change: 0.04% Day Change: 0.01 | |
| Week Change: -2.13% Year-to-date Change: -24.5% | |
| NC Links: Profile News Message Board | |
| Charts:- Daily , Weekly | |
| Add NC to Watchlist: View: Get Complete NC Trend Analysis ➞ | |
 | EPRT Essential Properties Realty Trust, Inc. |
| Sector: Financials | |
| SubSector: REIT - Diversified | |
| MarketCap: 1424.43 Millions | |
| Recent Price: 26.35 Smart Investing & Trading Score: 100 | |
| Day Percent Change: 0.04% Day Change: 0.01 | |
| Week Change: 2.57% Year-to-date Change: 3.1% | |
| EPRT Links: Profile News Message Board | |
| Charts:- Daily , Weekly | |
| Add EPRT to Watchlist: View: Get Complete EPRT Trend Analysis ➞ | |
 | THFF First Financial Corporation |
| Sector: Financials | |
| SubSector: Regional - Midwest Banks | |
| MarketCap: 433.07 Millions | |
| Recent Price: 36.42 Smart Investing & Trading Score: 32 | |
| Day Percent Change: 0.03% Day Change: 0.01 | |
| Week Change: -1.19% Year-to-date Change: -15.4% | |
| THFF Links: Profile News Message Board | |
| Charts:- Daily , Weekly | |
| Add THFF to Watchlist: View: Get Complete THFF Trend Analysis ➞ | |
 | ENV Envestnet, Inc. |
| Sector: Services & Goods | |
| SubSector: Business Services | |
| MarketCap: 3114.02 Millions | |
| Recent Price: 62.09 Smart Investing & Trading Score: 73 | |
| Day Percent Change: 0.03% Day Change: 0.02 | |
| Week Change: -0.1% Year-to-date Change: 25.4% | |
| ENV Links: Profile News Message Board | |
| Charts:- Daily , Weekly | |
| Add ENV to Watchlist: View: Get Complete ENV Trend Analysis ➞ | |
 | ALEX Alexander & Baldwin, Inc. |
| Sector: Financials | |
| SubSector: Real Estate Development | |
| MarketCap: 751.419 Millions | |
| Recent Price: 16.47 Smart Investing & Trading Score: 100 | |
| Day Percent Change: 0.00% Day Change: 0.00 | |
| Week Change: 1.73% Year-to-date Change: -13.4% | |
| ALEX Links: Profile News Message Board | |
| Charts:- Daily , Weekly | |
| Add ALEX to Watchlist: View: Get Complete ALEX Trend Analysis ➞ | |
 | SCS Steelcase Inc. |
| Sector: Consumer Staples | |
| SubSector: Business Equipment | |
| MarketCap: 1310.77 Millions | |
| Recent Price: 12.03 Smart Investing & Trading Score: 30 | |
| Day Percent Change: 0.00% Day Change: 0.00 | |
| Week Change: -0.33% Year-to-date Change: -11.0% | |
| SCS Links: Profile News Message Board | |
| Charts:- Daily , Weekly | |
| Add SCS to Watchlist: View: Get Complete SCS Trend Analysis ➞ | |
 | VHI Valhi, Inc. |
| Sector: Materials | |
| SubSector: Chemicals - Major Diversified | |
| MarketCap: 394.336 Millions | |
| Recent Price: 14.77 Smart Investing & Trading Score: 46 | |
| Day Percent Change: 0.00% Day Change: 0.00 | |
| Week Change: -1.53% Year-to-date Change: -2.8% | |
| VHI Links: Profile News Message Board | |
| Charts:- Daily , Weekly | |
| Add VHI to Watchlist: View: Get Complete VHI Trend Analysis ➞ | |
 | IRBT iRobot Corporation |
| Sector: Consumer Staples | |
| SubSector: Appliances | |
| MarketCap: 1193.38 Millions | |
| Recent Price: 8.56 Smart Investing & Trading Score: 74 | |
| Day Percent Change: 0.00% Day Change: 0.00 | |
| Week Change: 9.96% Year-to-date Change: -77.9% | |
| IRBT Links: Profile News Message Board | |
| Charts:- Daily , Weekly | |
| Add IRBT to Watchlist: View: Get Complete IRBT Trend Analysis ➞ | |
 | ANGO AngioDynamics, Inc. |
| Sector: Health Care | |
| SubSector: Medical Instruments & Supplies | |
| MarketCap: 370.86 Millions | |
| Recent Price: 5.79 Smart Investing & Trading Score: 61 | |
| Day Percent Change: 0.00% Day Change: 0.00 | |
| Week Change: -0.34% Year-to-date Change: -26.2% | |
| ANGO Links: Profile News Message Board | |
| Charts:- Daily , Weekly | |
| Add ANGO to Watchlist: View: Get Complete ANGO Trend Analysis ➞ | |
 | CNSL Consolidated Communications Holdings, Inc. |
| Sector: Technology | |
| SubSector: Telecom Services - Domestic | |
| MarketCap: 319.677 Millions | |
| Recent Price: 4.32 Smart Investing & Trading Score: 62 | |
| Day Percent Change: 0.00% Day Change: 0.00 | |
| Week Change: 1.17% Year-to-date Change: -0.7% | |
| CNSL Links: Profile News Message Board | |
| Charts:- Daily , Weekly | |
| Add CNSL to Watchlist: View: Get Complete CNSL Trend Analysis ➞ | |
 | PGC Peapack-Gladstone Financial Corporation |
| Sector: Financials | |
| SubSector: Regional - Northeast Banks | |
| MarketCap: 284.399 Millions | |
| Recent Price: 22.38 Smart Investing & Trading Score: 10 | |
| Day Percent Change: 0.00% Day Change: 0.00 | |
| Week Change: -1.58% Year-to-date Change: -25.0% | |
| PGC Links: Profile News Message Board | |
| Charts:- Daily , Weekly | |
| Add PGC to Watchlist: View: Get Complete PGC Trend Analysis ➞ | |
 | GSAT Globalstar, Inc. |
| Sector: Technology | |
| SubSector: Wireless Communications | |
| MarketCap: 485.127 Millions | |
| Recent Price: 1.29 Smart Investing & Trading Score: 34 | |
| Day Percent Change: 0.00% Day Change: 0.00 | |
| Week Change: 0% Year-to-date Change: -33.5% | |
| GSAT Links: Profile News Message Board | |
| Charts:- Daily , Weekly | |
| Add GSAT to Watchlist: View: Get Complete GSAT Trend Analysis ➞ | |
 | CLNE Clean Energy Fuels Corp. |
| Sector: Utilities | |
| SubSector: Gas Utilities | |
| MarketCap: 371.977 Millions | |
| Recent Price: 2.32 Smart Investing & Trading Score: 27 | |
| Day Percent Change: 0.00% Day Change: 0.00 | |
| Week Change: -4.53% Year-to-date Change: -39.4% | |
| CLNE Links: Profile News Message Board | |
| Charts:- Daily , Weekly | |
| Add CLNE to Watchlist: View: Get Complete CLNE Trend Analysis ➞ | |
 | HRT HireRight Holdings Corporation |
| Sector: Industrials | |
| SubSector: Staffing & Employment Services | |
| MarketCap: 823 Millions | |
| Recent Price: 14.30 Smart Investing & Trading Score: 68 | |
| Day Percent Change: 0.00% Day Change: 0.00 | |
| Week Change: 0.07% Year-to-date Change: 6.3% | |
| HRT Links: Profile News Message Board | |
| Charts:- Daily , Weekly | |
| Add HRT to Watchlist: View: Get Complete HRT Trend Analysis ➞ | |
 | AMPL Amplitude, Inc. |
| Sector: Technology | |
| SubSector: Software - Application | |
| MarketCap: 1320 Millions | |
| Recent Price: 9.80 Smart Investing & Trading Score: 29 | |
| Day Percent Change: 0.00% Day Change: 0.00 | |
| Week Change: -1.21% Year-to-date Change: -23.2% | |
| AMPL Links: Profile News Message Board | |
| Charts:- Daily , Weekly | |
| Add AMPL to Watchlist: View: Get Complete AMPL Trend Analysis ➞ | |
 | GOGO Gogo Inc. |
| Sector: Technology | |
| SubSector: Diversified Communication Services | |
| MarketCap: 307.064 Millions | |
| Recent Price: 9.06 Smart Investing & Trading Score: 83 | |
| Day Percent Change: 0.00% Day Change: 0.00 | |
| Week Change: -0.88% Year-to-date Change: -10.6% | |
| GOGO Links: Profile News Message Board | |
| Charts:- Daily , Weekly | |
| Add GOGO to Watchlist: View: Get Complete GOGO Trend Analysis ➞ | |
 | CIVB Civista Bancshares, Inc. |
| Sector: Financials | |
| SubSector: Regional - Pacific Banks | |
| MarketCap: 255.929 Millions | |
| Recent Price: 14.28 Smart Investing & Trading Score: 18 | |
| Day Percent Change: 0.00% Day Change: 0.00 | |
| Week Change: -3.84% Year-to-date Change: -22.6% | |
| CIVB Links: Profile News Message Board | |
| Charts:- Daily , Weekly | |
| Add CIVB to Watchlist: View: Get Complete CIVB Trend Analysis ➞ | |
 | TUSK Mammoth Energy Services, Inc. |
| Sector: Energy | |
| SubSector: Oil & Gas Drilling & Exploration | |
| MarketCap: 59.5139 Millions | |
| Recent Price: 3.25 Smart Investing & Trading Score: 10 | |
| Day Percent Change: 0.00% Day Change: 0.00 | |
| Week Change: -1.81% Year-to-date Change: -27.1% | |
| TUSK Links: Profile News Message Board | |
| Charts:- Daily , Weekly | |
| Add TUSK to Watchlist: View: Get Complete TUSK Trend Analysis ➞ | |
 | XERS Xeris Pharmaceuticals, Inc. |
| Sector: Health Care | |
| SubSector: Biotechnology | |
| MarketCap: 74.5785 Millions | |
| Recent Price: 1.75 Smart Investing & Trading Score: 17 | |
| Day Percent Change: 0.00% Day Change: 0.00 | |
| Week Change: 0% Year-to-date Change: -25.7% | |
| XERS Links: Profile News Message Board | |
| Charts:- Daily , Weekly | |
| Add XERS to Watchlist: View: Get Complete XERS Trend Analysis ➞ | |
 | DHC Diversified Healthcare Trust |
| Sector: Financials | |
| SubSector: REIT - Healthcare Facilities | |
| MarketCap: 814.114 Millions | |
| Recent Price: 2.36 Smart Investing & Trading Score: 27 | |
| Day Percent Change: 0.00% Day Change: 0.00 | |
| Week Change: -2.88% Year-to-date Change: -36.9% | |
| DHC Links: Profile News Message Board | |
| Charts:- Daily , Weekly | |
| Add DHC to Watchlist: View: Get Complete DHC Trend Analysis ➞ | |
 | UONEK Urban One, Inc. |
| Sector: Services & Goods | |
| SubSector: Broadcasting - Radio | |
| MarketCap: 601.795 Millions | |
| Recent Price: 1.55 Smart Investing & Trading Score: 25 | |
| Day Percent Change: 0.00% Day Change: 0.00 | |
| Week Change: 0.65% Year-to-date Change: -54.9% | |
| UONEK Links: Profile News Message Board | |
| Charts:- Daily , Weekly | |
| Add UONEK to Watchlist: View: Get Complete UONEK Trend Analysis ➞ | |
 | VEL Velocity Financial, Inc. |
| Sector: Financials | |
| SubSector: Mortgage Finance | |
| MarketCap: 12157 Millions | |
| Recent Price: 17.15 Smart Investing & Trading Score: 83 | |
| Day Percent Change: 0.00% Day Change: 0.00 | |
| Week Change: 0.82% Year-to-date Change: 3.2% | |
| VEL Links: Profile News Message Board | |
| Charts:- Daily , Weekly | |
| Add VEL to Watchlist: View: Get Complete VEL Trend Analysis ➞ | |
 | HSHP Himalaya Shipping Ltd. |
| Sector: Industrials | |
| SubSector: Marine Shipping | |
| MarketCap: 179 Millions | |
| Recent Price: 8.17 Smart Investing & Trading Score: 56 | |
| Day Percent Change: 0.00% Day Change: 0.00 | |
| Week Change: -1.45% Year-to-date Change: 21.0% | |
| HSHP Links: Profile News Message Board | |
| Charts:- Daily , Weekly | |
| Add HSHP to Watchlist: View: Get Complete HSHP Trend Analysis ➞ | |
 | SGHT Sight Sciences, Inc. |
| Sector: Health Care | |
| SubSector: Medical Devices | |
| MarketCap: 381 Millions | |
| Recent Price: 5.55 Smart Investing & Trading Score: 68 | |
| Day Percent Change: 0.00% Day Change: 0.00 | |
| Week Change: 5.11% Year-to-date Change: 7.5% | |
| SGHT Links: Profile News Message Board | |
| Charts:- Daily , Weekly | |
| Add SGHT to Watchlist: View: Get Complete SGHT Trend Analysis ➞ | |
| Too many stocks? View smallcap stocks filtered by marketcap & sector |
| Marketcap: All SmallCap Stocks (default-no microcap), Large, Mid-Range, Small & MicroCap |
| Sector: Tech, Finance, Energy, Staples, Retail, Industrial, Materials, Utilities & Medical |
|
Best Stocks Today 12Stocks.com |
© 2024 12Stocks.com Terms & Conditions Privacy Contact Us
All Information Provided Only For Education And Not To Be Used For Investing or Trading. See Terms & Conditions


One More Thing ... Get Best Stocks Delivered Daily!
Never Ever Miss A Move With Our Top Ten Stocks Lists
Find Best Stocks In Any Market - Bull or Bear Market
Take A Peek At Our Top Ten Stocks Lists: Daily, Weekly, Year-to-Date & Top Trends
Find Best Stocks In Any Market - Bull or Bear Market
Take A Peek At Our Top Ten Stocks Lists: Daily, Weekly, Year-to-Date & Top Trends
Smallcap Stocks With Best Up Trends [0-bearish to 100-bullish]: Surmodics [100], Rocky Brands[100], TransMedics Group[100], LendingClub [100], Summit [100], A10 s[100], Carpenter [100], UFP [100], PROCEPT BioRobotics[100], Xencor [100], Trinity Industries[100]
Best Smallcap Stocks Year-to-Date:
Janux [441.55%], Viking [310.69%], Longboard [259.25%], Alpine Immune[239.29%], Avidity Biosciences[185.4%], Bakkt [182.96%], Cullinan Oncology[175.33%], Arcutis Bio[173.68%], Vera [173.32%], Super Micro[159.73%], Y-mAbs [141.79%] Best Smallcap Stocks This Week:
Deciphera [73.11%], Eyenovia [45.65%], Cue Biopharma[39.56%], Seres [30.91%], Poseida [30.05%], P3 Health[29.62%], Phibro Animal[28.44%], TransMedics Group[27.72%], Surmodics [27.36%], LendingTree [26.36%], Rocky Brands[24.92%] Best Smallcap Stocks Daily:
Surmodics [29.74%], Rocky Brands[28.41%], TransMedics Group[24.93%], Ventyx Biosciences[24.63%], Eyenovia [21.84%], LendingClub [19.68%], Summit [19.59%], Powell Industries[18.89%], MiMedx Group[18.67%], CareDx [18.30%], A10 s[17.69%]