
 Login Sign Up


| |||||
 |  | ||||

| 12Stocks.com Market Intelligence |
Best SmallCap Stocks
|
| In a hurry? Small Cap Stock Lists: Performance Trends Table, Stock Charts
Sort Small Cap stocks: Daily, Weekly, Year-to-Date, Market Cap & Trends. Filter Small Cap stocks list by sector: Show all, Tech, Finance, Energy, Staples, Retail, Industrial, Materials, Utilities and HealthCare Filter Small Cap stocks list by size: All Large Medium Small and MicroCap |
| 12Stocks.com Small Cap Stocks Performances & Trends Daily | |||||||||
|
|  The overall Smart Investing & Trading Score is 23 (0-bearish to 100-bullish) which puts Small Cap index in short term bearish to neutral trend. The Smart Investing & Trading Score from previous trading session is 13 and hence an improvement of trend.
| ||||||||
Here are the Smart Investing & Trading Scores of the most requested small cap stocks at 12Stocks.com (click stock name for detailed review):
|


| 12Stocks.com: Investing in Smallcap Index with Stocks | |
|
The following table helps investors and traders sort through current performance and trends (as measured by Smart Investing & Trading Score) of various
stocks in the Smallcap Index. Quick View: Move mouse or cursor over stock symbol (ticker) to view short-term technical chart and over stock name to view long term chart. Click on  to add stock symbol to your watchlist and to add stock symbol to your watchlist and  to view watchlist. Click on any ticker or stock name for detailed market intelligence report for that stock. to view watchlist. Click on any ticker or stock name for detailed market intelligence report for that stock. |
12Stocks.com Performance of Stocks in Smallcap Index
| Ticker | Stock Name | Watchlist | Category | Recent Price | Smart Investing & Trading Score | Change % | YTD Change% |
| TRC | Tejon Ranch |   | Financials | 15.69 | 87 | 5.44 | -8.78% |
| SST | System1 | | Industrials | 2.25 | 83 | 5.14 | -6.64% |
| IPSC | Century | | Health Care | 2.97 | 5 | 5.13 | -10.00% |
| SEAT | Vivid Seats | | Services & Goods | 5.88 | 78 | 5.10 | -5.85% |
| ACRV | Acrivon | | Health Care | 10.87 | 88 | 5.08 | 118.61% |
| AKTS | Akoustis | | Technology | 0.53 | 47 | 4.91 | -36.50% |
| BLFS | BioLife Solutions | | Health Care | 15.86 | 35 | 4.76 | -2.40% |
| SSP | E.W. Scripps | | Services & Goods | 3.45 | 52 | 4.70 | -56.82% |
| RDW | Redwire | | Industrials | 3.57 | 48 | 4.69 | 25.26% |
| CDZI | Cadiz | | Utilities | 2.25 | 17 | 4.65 | -19.64% |
| CMPX | Compass | | Health Care | 1.59 | 53 | 4.61 | 3.58% |
| PL | Planet Labs | | Industrials | 1.83 | 37 | 4.57 | -26.21% |
| SKIN | Beauty Health | | Consumer Staples | 3.46 | 53 | 4.53 | 9.32% |
| CMTG | Claros Mortgage | | Financials | 9.01 | 42 | 4.52 | -35.06% |
| STEM | Stem | | Technology | 1.65 | 42 | 4.43 | -57.03% |
| HLF | Herbalife Nutrition | | Consumer Staples | 8.59 | 42 | 4.37 | -43.71% |
| PACB | Pacific Biosciences | | Health Care | 1.46 | 0 | 4.29 | -85.12% |
| NN | NextNav | | Technology | 8.12 | 100 | 4.24 | 82.47% |
| DCGO | DocGo | | Health Care | 3.50 | 47 | 4.17 | -37.48% |
| MQ | Marqeta | | Technology | 5.62 | 42 | 4.17 | -20.18% |
| KYMR | Kymera | | Health Care | 35.16 | 63 | 4.15 | 38.37% |
| FRGE | Forge Global | | Technology | 1.90 | 17 | 4.12 | -46.92% |
| JBLU | JetBlue Airways | | Transports | 7.11 | 68 | 4.10 | 28.11% |
| ZUMZ | Zumiez | | Services & Goods | 14.36 | 28 | 4.06 | -29.40% |
| TWKS | Thoughtworks Holding | | Technology | 2.34 | 52 | 4.00 | -51.85% |


| Too many stocks? View smallcap stocks filtered by marketcap & sector |
| Marketcap: All SmallCap Stocks (default-no microcap), Large, Mid-Range, Small |
| Smallcap Sector: Tech, Finance, Energy, Staples, Retail, Industrial, Materials, & Medical |
|
Get the most comprehensive stock market coverage daily at 12Stocks.com ➞ Best Stocks Today ➞ Best Stocks Weekly ➞ Best Stocks Year-to-Date ➞ Best Stocks Trends ➞  Best Stocks Today 12Stocks.com Best Nasdaq Stocks ➞ Best S&P 500 Stocks ➞ Best Tech Stocks ➞ Best Biotech Stocks ➞ |
| Detailed Overview of SmallCap Stocks |
| SmallCap Technical Overview, Leaders & Laggards, Top SmallCap ETF Funds & Detailed SmallCap Stocks List, Charts, Trends & More |
| Smallcap: Technical Analysis, Trends & YTD Performance | |
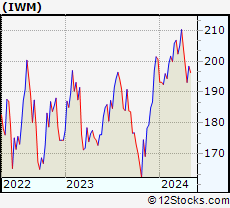
| SmallCap segment as represented by
IWM, an exchange-traded fund [ETF], holds basket of thousands of smallcap stocks from across all major sectors of the US stock market. The smallcap index (contains stocks like Riverbed & Sotheby's) is down by -3.92% and is currently underperforming the overall market by -8.11% year-to-date. Below is a quick view of technical charts and trends: | |
 IWM Weekly Chart |
|
| Long Term Trend: Not Good | |
| Medium Term Trend: Not Good | |
 IWM Daily Chart |
|
| Short Term Trend: Not Good | |
| Overall Trend Score: 23 | |
| YTD Performance: -3.92% | |
| **Trend Scores & Views Are Only For Educational Purposes And Not For Investing | |
| 12Stocks.com: Top Performing Small Cap Index Stocks | ||||||||||||||||||||||||||||||||||||||||||||||||
 The top performing Small Cap Index stocks year to date are
Now, more recently, over last week, the top performing Small Cap Index stocks on the move are


|
||||||||||||||||||||||||||||||||||||||||||||||||
| 12Stocks.com: Investing in Smallcap Index using Exchange Traded Funds | |
|
The following table shows list of key exchange traded funds (ETF) that
help investors track Smallcap index. The following list also includes leveraged ETF funds that track twice or thrice the daily returns of Smallcap indices. Short or inverse ETF funds move in the opposite direction to the index they track and are useful during market pullbacks or during bear markets. Quick View: Move mouse or cursor over ETF symbol (ticker) to view short-term technical chart and over ETF name to view long term chart. Click on ticker or stock name for detailed view. Click on to add stock symbol to your watchlist and to view watchlist. |
12Stocks.com List of ETFs that track Smallcap Index
| Ticker | ETF Name | Watchlist | Recent Price | Smart Investing & Trading Score | Change % | Week % | Year-to-date % |
| IWM | iShares Russell 2000 | | 192.84 | 23 | -0.08 | -2.94 | -3.92% |
| IJR | iShares Core S&P Small-Cap | | 102.34 | 10 | 0.21 | -2.08 | -5.46% |
| VTWO | Vanguard Russell 2000 ETF | | 77.95 | 23 | -0.13 | -2.95 | -3.88% |
| IWN | iShares Russell 2000 Value | | 146.33 | 10 | 0.21 | -2.69 | -5.79% |
| IJS | iShares S&P Small-Cap 600 Value | | 94.51 | 18 | 0.41 | -1.73 | -8.31% |
| IWO | iShares Russell 2000 Growth | | 246.94 | 36 | -0.44 | -3.3 | -2.09% |
| IJT | iShares S&P Small-Cap 600 Growth | | 121.57 | 13 | -0.22 | -2.57 | -2.85% |
| XSLV | PowerShares S&P SmallCap Low Volatil ETF | | 41.65 | 25 | 0.56 | -1.05 | -5.66% |
| SAA | ProShares Ultra SmallCap600 | | 21.62 | 10 | -0.18 | -4.17 | -13.35% |
| SMLV | SPDR SSGA US Small Cap Low Volatil ETF | | 103.83 | 10 | 0.16 | -1.13 | -7.72% |
| SBB | ProShares Short SmallCap600 | | 16.98 | 100 | 0.77 | 2.62 | 6.59% |
| SDD | ProShares UltraShort SmallCap600 | | 20.69 | 95 | 0.44 | 4.33 | 12.28% |
| 12Stocks.com: Charts, Trends, Fundamental Data and Performances of SmallCap Stocks | |
|
We now take in-depth look at all SmallCap stocks including charts, multi-period performances and overall trends (as measured by Smart Investing & Trading Score). One can sort SmallCap stocks (click link to choose) by Daily, Weekly and by Year-to-Date performances. Also, one can sort by size of the company or by market capitalization. |
| Select Your Default Chart Type: | |||||
| |||||
| Click on stock symbol or name for detailed view. Click on to add stock symbol to your watchlist and to view watchlist. Quick View: Move mouse or cursor over "Daily" to quickly view daily technical stock chart and over "Weekly" to view weekly technical stock chart. | |||||

 | TRC Tejon Ranch Co. |
| Sector: Financials | |
| SubSector: Property Management | |
| MarketCap: 346.442 Millions | |
| Recent Price: 15.69 Smart Investing & Trading Score: 87 | |
| Day Percent Change: 5.44% Day Change: 0.81 | |
| Week Change: 3.22% Year-to-date Change: -8.8% | |
| TRC Links: Profile News Message Board | |
| Charts:- Daily , Weekly | |
| Add TRC to Watchlist: View: Get Complete TRC Trend Analysis ➞ | |
 | SST System1, Inc. |
| Sector: Industrials | |
| SubSector: Specialty Business Services | |
| MarketCap: 504 Millions | |
| Recent Price: 2.25 Smart Investing & Trading Score: 83 | |
| Day Percent Change: 5.14% Day Change: 0.11 | |
| Week Change: 2.74% Year-to-date Change: -6.6% | |
| SST Links: Profile News Message Board | |
| Charts:- Daily , Weekly | |
| Add SST to Watchlist: View: Get Complete SST Trend Analysis ➞ | |
 | IPSC Century Therapeutics, Inc. |
| Sector: Health Care | |
| SubSector: Biotechnology | |
| MarketCap: 187 Millions | |
| Recent Price: 2.97 Smart Investing & Trading Score: 5 | |
| Day Percent Change: 5.13% Day Change: 0.15 | |
| Week Change: -24.04% Year-to-date Change: -10.0% | |
| IPSC Links: Profile News Message Board | |
| Charts:- Daily , Weekly | |
| Add IPSC to Watchlist: View: Get Complete IPSC Trend Analysis ➞ | |
 | SEAT Vivid Seats Inc. |
| Sector: Services & Goods | |
| SubSector: Internet Content & Information | |
| MarketCap: 1560 Millions | |
| Recent Price: 5.88 Smart Investing & Trading Score: 78 | |
| Day Percent Change: 5.10% Day Change: 0.29 | |
| Week Change: 3.25% Year-to-date Change: -5.9% | |
| SEAT Links: Profile News Message Board | |
| Charts:- Daily , Weekly | |
| Add SEAT to Watchlist: View: Get Complete SEAT Trend Analysis ➞ | |
 | ACRV Acrivon Therapeutics, Inc. |
| Sector: Health Care | |
| SubSector: Biotechnology | |
| MarketCap: 286 Millions | |
| Recent Price: 10.87 Smart Investing & Trading Score: 88 | |
| Day Percent Change: 5.08% Day Change: 0.53 | |
| Week Change: 8.76% Year-to-date Change: 118.6% | |
| ACRV Links: Profile News Message Board | |
| Charts:- Daily , Weekly | |
| Add ACRV to Watchlist: View: Get Complete ACRV Trend Analysis ➞ | |
 | AKTS Akoustis Technologies, Inc. |
| Sector: Technology | |
| SubSector: Communication Equipment | |
| MarketCap: 197.039 Millions | |
| Recent Price: 0.53 Smart Investing & Trading Score: 47 | |
| Day Percent Change: 4.91% Day Change: 0.02 | |
| Week Change: -7.59% Year-to-date Change: -36.5% | |
| AKTS Links: Profile News Message Board | |
| Charts:- Daily , Weekly | |
| Add AKTS to Watchlist: View: Get Complete AKTS Trend Analysis ➞ | |
 | BLFS BioLife Solutions, Inc. |
| Sector: Health Care | |
| SubSector: Medical Instruments & Supplies | |
| MarketCap: 264.36 Millions | |
| Recent Price: 15.86 Smart Investing & Trading Score: 35 | |
| Day Percent Change: 4.76% Day Change: 0.72 | |
| Week Change: -3.88% Year-to-date Change: -2.4% | |
| BLFS Links: Profile News Message Board | |
| Charts:- Daily , Weekly | |
| Add BLFS to Watchlist: View: Get Complete BLFS Trend Analysis ➞ | |
 | SSP The E.W. Scripps Company |
| Sector: Services & Goods | |
| SubSector: Broadcasting - TV | |
| MarketCap: 766.163 Millions | |
| Recent Price: 3.45 Smart Investing & Trading Score: 52 | |
| Day Percent Change: 4.70% Day Change: 0.16 | |
| Week Change: 7.81% Year-to-date Change: -56.8% | |
| SSP Links: Profile News Message Board | |
| Charts:- Daily , Weekly | |
| Add SSP to Watchlist: View: Get Complete SSP Trend Analysis ➞ | |
 | RDW Redwire Corporation |
| Sector: Industrials | |
| SubSector: Aerospace & Defense | |
| MarketCap: 160 Millions | |
| Recent Price: 3.57 Smart Investing & Trading Score: 48 | |
| Day Percent Change: 4.69% Day Change: 0.16 | |
| Week Change: -7.51% Year-to-date Change: 25.3% | |
| RDW Links: Profile News Message Board | |
| Charts:- Daily , Weekly | |
| Add RDW to Watchlist: View: Get Complete RDW Trend Analysis ➞ | |
 | CDZI Cadiz Inc. |
| Sector: Utilities | |
| SubSector: Water Utilities | |
| MarketCap: 265.502 Millions | |
| Recent Price: 2.25 Smart Investing & Trading Score: 17 | |
| Day Percent Change: 4.65% Day Change: 0.10 | |
| Week Change: -3.02% Year-to-date Change: -19.6% | |
| CDZI Links: Profile News Message Board | |
| Charts:- Daily , Weekly | |
| Add CDZI to Watchlist: View: Get Complete CDZI Trend Analysis ➞ | |
 | CMPX Compass Therapeutics, Inc. |
| Sector: Health Care | |
| SubSector: Biotechnology | |
| MarketCap: 406 Millions | |
| Recent Price: 1.59 Smart Investing & Trading Score: 53 | |
| Day Percent Change: 4.61% Day Change: 0.07 | |
| Week Change: -1.85% Year-to-date Change: 3.6% | |
| CMPX Links: Profile News Message Board | |
| Charts:- Daily , Weekly | |
| Add CMPX to Watchlist: View: Get Complete CMPX Trend Analysis ➞ | |
 | PL Planet Labs PBC |
| Sector: Industrials | |
| SubSector: Aerospace & Defense | |
| MarketCap: 874 Millions | |
| Recent Price: 1.83 Smart Investing & Trading Score: 37 | |
| Day Percent Change: 4.57% Day Change: 0.08 | |
| Week Change: -8.96% Year-to-date Change: -26.2% | |
| PL Links: Profile News Message Board | |
| Charts:- Daily , Weekly | |
| Add PL to Watchlist: View: Get Complete PL Trend Analysis ➞ | |
 | SKIN The Beauty Health Company |
| Sector: Consumer Staples | |
| SubSector: Household & Personal Products | |
| MarketCap: 1070 Millions | |
| Recent Price: 3.46 Smart Investing & Trading Score: 53 | |
| Day Percent Change: 4.53% Day Change: 0.15 | |
| Week Change: -5.46% Year-to-date Change: 9.3% | |
| SKIN Links: Profile News Message Board | |
| Charts:- Daily , Weekly | |
| Add SKIN to Watchlist: View: Get Complete SKIN Trend Analysis ➞ | |
 | CMTG Claros Mortgage Trust, Inc. |
| Sector: Financials | |
| SubSector: REIT - Mortgage | |
| MarketCap: 1610 Millions | |
| Recent Price: 9.01 Smart Investing & Trading Score: 42 | |
| Day Percent Change: 4.52% Day Change: 0.39 | |
| Week Change: 3.8% Year-to-date Change: -35.1% | |
| CMTG Links: Profile News Message Board | |
| Charts:- Daily , Weekly | |
| Add CMTG to Watchlist: View: Get Complete CMTG Trend Analysis ➞ | |
 | STEM Stem, Inc. |
| Sector: Technology | |
| SubSector: Software - Infrastructure | |
| MarketCap: 836 Millions | |
| Recent Price: 1.65 Smart Investing & Trading Score: 42 | |
| Day Percent Change: 4.43% Day Change: 0.07 | |
| Week Change: -5.71% Year-to-date Change: -57.0% | |
| STEM Links: Profile News Message Board | |
| Charts:- Daily , Weekly | |
| Add STEM to Watchlist: View: Get Complete STEM Trend Analysis ➞ | |
 | HLF Herbalife Nutrition Ltd. |
| Sector: Consumer Staples | |
| SubSector: Personal Products | |
| MarketCap: 4884.65 Millions | |
| Recent Price: 8.59 Smart Investing & Trading Score: 42 | |
| Day Percent Change: 4.37% Day Change: 0.36 | |
| Week Change: 6.05% Year-to-date Change: -43.7% | |
| HLF Links: Profile News Message Board | |
| Charts:- Daily , Weekly | |
| Add HLF to Watchlist: View: Get Complete HLF Trend Analysis ➞ | |
 | PACB Pacific Biosciences of California, Inc. |
| Sector: Health Care | |
| SubSector: Biotechnology | |
| MarketCap: 470.685 Millions | |
| Recent Price: 1.46 Smart Investing & Trading Score: 0 | |
| Day Percent Change: 4.29% Day Change: 0.06 | |
| Week Change: -53.94% Year-to-date Change: -85.1% | |
| PACB Links: Profile News Message Board | |
| Charts:- Daily , Weekly | |
| Add PACB to Watchlist: View: Get Complete PACB Trend Analysis ➞ | |
 | NN NextNav Inc. |
| Sector: Technology | |
| SubSector: Software - Infrastructure | |
| MarketCap: 314 Millions | |
| Recent Price: 8.12 Smart Investing & Trading Score: 100 | |
| Day Percent Change: 4.24% Day Change: 0.33 | |
| Week Change: 9.58% Year-to-date Change: 82.5% | |
| NN Links: Profile News Message Board | |
| Charts:- Daily , Weekly | |
| Add NN to Watchlist: View: Get Complete NN Trend Analysis ➞ | |
 | DCGO DocGo Inc. |
| Sector: Health Care | |
| SubSector: Medical Care Facilities | |
| MarketCap: 972 Millions | |
| Recent Price: 3.50 Smart Investing & Trading Score: 47 | |
| Day Percent Change: 4.17% Day Change: 0.14 | |
| Week Change: 7.21% Year-to-date Change: -37.5% | |
| DCGO Links: Profile News Message Board | |
| Charts:- Daily , Weekly | |
| Add DCGO to Watchlist: View: Get Complete DCGO Trend Analysis ➞ | |
 | MQ Marqeta, Inc. |
| Sector: Technology | |
| SubSector: Software - Infrastructure | |
| MarketCap: 2650 Millions | |
| Recent Price: 5.62 Smart Investing & Trading Score: 42 | |
| Day Percent Change: 4.17% Day Change: 0.23 | |
| Week Change: 3.22% Year-to-date Change: -20.2% | |
| MQ Links: Profile News Message Board | |
| Charts:- Daily , Weekly | |
| Add MQ to Watchlist: View: Get Complete MQ Trend Analysis ➞ | |
 | KYMR Kymera Therapeutics, Inc. |
| Sector: Health Care | |
| SubSector: Biotechnology | |
| MarketCap: 27087 Millions | |
| Recent Price: 35.16 Smart Investing & Trading Score: 63 | |
| Day Percent Change: 4.15% Day Change: 1.40 | |
| Week Change: -1.18% Year-to-date Change: 38.4% | |
| KYMR Links: Profile News Message Board | |
| Charts:- Daily , Weekly | |
| Add KYMR to Watchlist: View: Get Complete KYMR Trend Analysis ➞ | |
 | FRGE Forge Global Holdings, Inc. |
| Sector: Technology | |
| SubSector: Software - Application | |
| MarketCap: 426 Millions | |
| Recent Price: 1.90 Smart Investing & Trading Score: 17 | |
| Day Percent Change: 4.12% Day Change: 0.07 | |
| Week Change: -6.19% Year-to-date Change: -46.9% | |
| FRGE Links: Profile News Message Board | |
| Charts:- Daily , Weekly | |
| Add FRGE to Watchlist: View: Get Complete FRGE Trend Analysis ➞ | |
 | JBLU JetBlue Airways Corporation |
| Sector: Transports | |
| SubSector: Regional Airlines | |
| MarketCap: 2383.1 Millions | |
| Recent Price: 7.11 Smart Investing & Trading Score: 68 | |
| Day Percent Change: 4.10% Day Change: 0.28 | |
| Week Change: 5.33% Year-to-date Change: 28.1% | |
| JBLU Links: Profile News Message Board | |
| Charts:- Daily , Weekly | |
| Add JBLU to Watchlist: View: Get Complete JBLU Trend Analysis ➞ | |
 | ZUMZ Zumiez Inc. |
| Sector: Services & Goods | |
| SubSector: Specialty Retail, Other | |
| MarketCap: 526.244 Millions | |
| Recent Price: 14.36 Smart Investing & Trading Score: 28 | |
| Day Percent Change: 4.06% Day Change: 0.56 | |
| Week Change: -1.91% Year-to-date Change: -29.4% | |
| ZUMZ Links: Profile News Message Board | |
| Charts:- Daily , Weekly | |
| Add ZUMZ to Watchlist: View: Get Complete ZUMZ Trend Analysis ➞ | |
 | TWKS Thoughtworks Holding, Inc. |
| Sector: Technology | |
| SubSector: Information Technology Services | |
| MarketCap: 2370 Millions | |
| Recent Price: 2.34 Smart Investing & Trading Score: 52 | |
| Day Percent Change: 4.00% Day Change: 0.09 | |
| Week Change: -2.09% Year-to-date Change: -51.9% | |
| TWKS Links: Profile News Message Board | |
| Charts:- Daily , Weekly | |
| Add TWKS to Watchlist: View: Get Complete TWKS Trend Analysis ➞ | |
| Too many stocks? View smallcap stocks filtered by marketcap & sector |
| Marketcap: All SmallCap Stocks (default-no microcap), Large, Mid-Range, Small & MicroCap |
| Sector: Tech, Finance, Energy, Staples, Retail, Industrial, Materials, Utilities & Medical |
|
Best Stocks Today 12Stocks.com |
© 2024 12Stocks.com Terms & Conditions Privacy Contact Us
All Information Provided Only For Education And Not To Be Used For Investing or Trading. See Terms & Conditions


One More Thing ... Get Best Stocks Delivered Daily!
Never Ever Miss A Move With Our Top Ten Stocks Lists
Find Best Stocks In Any Market - Bull or Bear Market
Take A Peek At Our Top Ten Stocks Lists: Daily, Weekly, Year-to-Date & Top Trends
Find Best Stocks In Any Market - Bull or Bear Market
Take A Peek At Our Top Ten Stocks Lists: Daily, Weekly, Year-to-Date & Top Trends
Smallcap Stocks With Best Up Trends [0-bearish to 100-bullish]: Badger Meter[100], Cullinan Oncology[100], Oscar Health[100], NextNav [100], EchoStar [100], Victory Capital[100], Macatawa Bank[100], IMAX [100], Envestnet [100], ALX Oncology[100], Argan [95]
Best Smallcap Stocks Year-to-Date:
Agenus [500.31%], CareMax [417.53%], Janux [348.12%], Viking [247.5%], Alpine Immune[238.5%], Super Micro[226.63%], Longboard [194.76%], Arcutis Bio[192.57%], Vera [161.3%], Avidity Biosciences[154.87%], Hippo [128.32%] Best Smallcap Stocks This Week:
Macatawa Bank[44.42%], 23andMe Holding[33.3%], ProKidney [32%], Snap One[29.73%], Vertex Energy[25.96%], ALX Oncology[20.64%], Vanda [20.63%], Expensify [18.37%], Badger Meter[16.72%], ContextLogic [15%], Cullinan Oncology[13.89%] Best Smallcap Stocks Daily:
23andMe Holding[65.91%], Vertex Energy[33.78%], Zura Bio[17.20%], Badger Meter[16.65%], ContextLogic [15.81%], Expensify [15.23%], Montrose Environmental[12.84%], Vaxxinity [10.05%], Cipher Mining[8.65%], FiscalNote [8.61%], Vuzix [8.15%]