
 Login Sign Up


| |||||
 |  | ||||

| 12Stocks.com Market Intelligence |
Best SmallCap Stocks
|
| In a hurry? Small Cap Stock Lists: Performance Trends Table, Stock Charts
Sort Small Cap stocks: Daily, Weekly, Year-to-Date, Market Cap & Trends. Filter Small Cap stocks list by sector: Show all, Tech, Finance, Energy, Staples, Retail, Industrial, Materials, Utilities and HealthCare Filter Small Cap stocks list by size: All Large Medium Small and MicroCap |
| 12Stocks.com Small Cap Stocks Performances & Trends Daily | |||||||||
|
|  The overall Smart Investing & Trading Score is 14 (0-bearish to 100-bullish) which puts Small Cap index in short term bearish trend. The Smart Investing & Trading Score from previous trading session is 41 and hence a deterioration of trend.
| ||||||||
Here are the Smart Investing & Trading Scores of the most requested small cap stocks at 12Stocks.com (click stock name for detailed review):
|


| 12Stocks.com: Investing in Smallcap Index with Stocks | |
|
The following table helps investors and traders sort through current performance and trends (as measured by Smart Investing & Trading Score) of various
stocks in the Smallcap Index. Quick View: Move mouse or cursor over stock symbol (ticker) to view short-term technical chart and over stock name to view long term chart. Click on  to add stock symbol to your watchlist and to add stock symbol to your watchlist and  to view watchlist. Click on any ticker or stock name for detailed market intelligence report for that stock. to view watchlist. Click on any ticker or stock name for detailed market intelligence report for that stock. |
12Stocks.com Performance of Stocks in Smallcap Index
| Ticker | Stock Name | Watchlist | Category | Recent Price | Smart Investing & Trading Score | Change % | YTD Change% |
| COUR | Coursera |   | Consumer Staples | 9.77 | 0 | -4.40 | -50.32% |
| FWRD | Forward Air | | Transports | 21.05 | 20 | -4.41 | -66.52% |
| LBRT | Liberty Oilfield | | Energy | 21.03 | 0 | -4.41 | 15.93% |
| SXC | SunCoke Energy | | Materials | 9.85 | 0 | -4.46 | -8.29% |
| KAI | Kadant | | Industrials | 261.52 | 0 | -4.48 | -6.70% |
| SAGE | Sage | | Health Care | 13.28 | 10 | -4.73 | -38.72% |
| CIX | CompX | | Services & Goods | 31.42 | 31 | -4.82 | 24.29% |
| LTH | Life Time | | Services & Goods | 13.00 | 0 | -4.83 | -14.19% |
| ARIS | Aris Water | | Utilities | 13.73 | 43 | -4.85 | 63.65% |
| EVBN | Evans Bancorp | | Financials | 24.34 | 0 | -4.88 | -22.80% |
| RILY | B. Riley | | Financials | 32.69 | 68 | -4.97 | 55.74% |
| NSIT | Insight Enterprises | | Technology | 173.22 | 0 | -5.12 | -2.24% |
| GPOR | Gulfport Energy | | Energy | 150.57 | 26 | -5.13 | 13.04% |
| DFIN | Donnelley Financial | | Services & Goods | 59.53 | 0 | -5.18 | -4.55% |
| BWMN | Bowman Consulting | | Industrials | 30.75 | 7 | -5.34 | -12.65% |
| BRY | Berry | | Energy | 8.03 | 36 | -5.42 | 14.22% |
| CHCT | Community Healthcare | | Financials | 25.08 | 18 | -5.47 | -5.86% |
| ASPN | Aspen Aerogels | | Industrials | 15.22 | 0 | -5.47 | -3.55% |
| VAXX | Vaxxinity | | Health Care | 0.12 | 25 | -5.62 | -86.22% |
| TNGX | Tango | | Health Care | 7.26 | 17 | -5.71 | -26.67% |
| NOG | Northern Oil | | Energy | 39.67 | 26 | -5.73 | 7.01% |
| ACDC | ProFrac Holding | | Energy | 6.83 | 10 | -5.92 | -19.74% |
| BKKT | Bakkt | | Technology | 6.31 | 88 | -5.96 | 182.96% |
| MIR | Mirion | | Industrials | 10.20 | 26 | -6.16 | -0.58% |
| AMKR | Amkor | | Technology | 30.33 | 17 | -6.24 | -8.84% |


| Too many stocks? View smallcap stocks filtered by marketcap & sector |
| Marketcap: All SmallCap Stocks (default-no microcap), Large, Mid-Range, Small |
| Smallcap Sector: Tech, Finance, Energy, Staples, Retail, Industrial, Materials, & Medical |
|
Get the most comprehensive stock market coverage daily at 12Stocks.com ➞ Best Stocks Today ➞ Best Stocks Weekly ➞ Best Stocks Year-to-Date ➞ Best Stocks Trends ➞  Best Stocks Today 12Stocks.com Best Nasdaq Stocks ➞ Best S&P 500 Stocks ➞ Best Tech Stocks ➞ Best Biotech Stocks ➞ |
| Detailed Overview of SmallCap Stocks |
| SmallCap Technical Overview, Leaders & Laggards, Top SmallCap ETF Funds & Detailed SmallCap Stocks List, Charts, Trends & More |
| Smallcap: Technical Analysis, Trends & YTD Performance | |
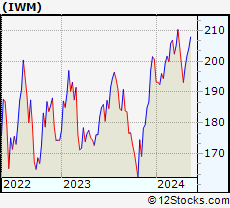
| SmallCap segment as represented by
IWM, an exchange-traded fund [ETF], holds basket of thousands of smallcap stocks from across all major sectors of the US stock market. The smallcap index (contains stocks like Riverbed & Sotheby's) is down by -2.19% and is currently underperforming the overall market by -6.73% year-to-date. Below is a quick view of technical charts and trends: | |
 IWM Weekly Chart |
|
| Long Term Trend: Not Good | |
| Medium Term Trend: Not Good | |
 IWM Daily Chart |
|
| Short Term Trend: Not Good | |
| Overall Trend Score: 14 | |
| YTD Performance: -2.19% | |
| **Trend Scores & Views Are Only For Educational Purposes And Not For Investing | |
| 12Stocks.com: Top Performing Small Cap Index Stocks | ||||||||||||||||||||||||||||||||||||||||||||||||
 The top performing Small Cap Index stocks year to date are
Now, more recently, over last week, the top performing Small Cap Index stocks on the move are


|
||||||||||||||||||||||||||||||||||||||||||||||||
| 12Stocks.com: Investing in Smallcap Index using Exchange Traded Funds | |
|
The following table shows list of key exchange traded funds (ETF) that
help investors track Smallcap index. The following list also includes leveraged ETF funds that track twice or thrice the daily returns of Smallcap indices. Short or inverse ETF funds move in the opposite direction to the index they track and are useful during market pullbacks or during bear markets. Quick View: Move mouse or cursor over ETF symbol (ticker) to view short-term technical chart and over ETF name to view long term chart. Click on ticker or stock name for detailed view. Click on to add stock symbol to your watchlist and to view watchlist. |
12Stocks.com List of ETFs that track Smallcap Index
| Ticker | ETF Name | Watchlist | Recent Price | Smart Investing & Trading Score | Change % | Week % | Year-to-date % |
| IWM | iShares Russell 2000 | | 196.31 | 14 | 0.21 | -1.05 | -2.19% |
| IJR | iShares Core S&P Small-Cap | | 104.74 | 22 | 0.34 | -0.86 | -3.24% |
| VTWO | Vanguard Russell 2000 ETF | | 79.36 | 14 | 0.25 | -1.07 | -2.15% |
| IWN | iShares Russell 2000 Value | | 149.82 | 22 | 0.52 | -0.87 | -3.55% |
| IJS | iShares S&P Small-Cap 600 Value | | 96.40 | 15 | 0.33 | -0.81 | -6.47% |
| IWO | iShares Russell 2000 Growth | | 249.58 | 7 | -0.30 | -1.39 | -1.05% |
| IJT | iShares S&P Small-Cap 600 Growth | | 124.94 | 15 | 0.27 | -0.91 | -0.16% |
| XSLV | PowerShares S&P SmallCap Low Volatil ETF | | 42.83 | 62 | 0.68 | 0.26 | -2.99% |
| SDD | ProShares UltraShort SmallCap600 | | 19.71 | 86 | 0.70 | 1.85 | 6.95% |
| SMLV | SPDR SSGA US Small Cap Low Volatil ETF | | 107.44 | 45 | 1.11 | -0.07 | -4.51% |
| SBB | ProShares Short SmallCap600 | | 16.56 | 79 | 0.05 | 1.06 | 3.94% |
| SAA | ProShares Ultra SmallCap600 | | 22.58 | 8 | -0.08 | -1.99 | -9.49% |
| 12Stocks.com: Charts, Trends, Fundamental Data and Performances of SmallCap Stocks | |
|
We now take in-depth look at all SmallCap stocks including charts, multi-period performances and overall trends (as measured by Smart Investing & Trading Score). One can sort SmallCap stocks (click link to choose) by Daily, Weekly and by Year-to-Date performances. Also, one can sort by size of the company or by market capitalization. |
| Select Your Default Chart Type: | |||||
| |||||
| Click on stock symbol or name for detailed view. Click on to add stock symbol to your watchlist and to view watchlist. Quick View: Move mouse or cursor over "Daily" to quickly view daily technical stock chart and over "Weekly" to view weekly technical stock chart. | |||||

 | COUR Coursera, Inc. |
| Sector: Consumer Staples | |
| SubSector: Education & Training Services | |
| MarketCap: 1990 Millions | |
| Recent Price: 9.77 Smart Investing & Trading Score: 0 | |
| Day Percent Change: -4.40% Day Change: -0.45 | |
| Week Change: -18.38% Year-to-date Change: -50.3% | |
| COUR Links: Profile News Message Board | |
| Charts:- Daily , Weekly | |
| Add COUR to Watchlist: View: Get Complete COUR Trend Analysis ➞ | |
 | FWRD Forward Air Corporation |
| Sector: Transports | |
| SubSector: Air Delivery & Freight Services | |
| MarketCap: 1278.88 Millions | |
| Recent Price: 21.05 Smart Investing & Trading Score: 20 | |
| Day Percent Change: -4.41% Day Change: -0.97 | |
| Week Change: -5.48% Year-to-date Change: -66.5% | |
| FWRD Links: Profile News Message Board | |
| Charts:- Daily , Weekly | |
| Add FWRD to Watchlist: View: Get Complete FWRD Trend Analysis ➞ | |
 | LBRT Liberty Oilfield Services Inc. |
| Sector: Energy | |
| SubSector: Oil & Gas Equipment & Services | |
| MarketCap: 308.261 Millions | |
| Recent Price: 21.03 Smart Investing & Trading Score: 0 | |
| Day Percent Change: -4.41% Day Change: -0.97 | |
| Week Change: -8.6% Year-to-date Change: 15.9% | |
| LBRT Links: Profile News Message Board | |
| Charts:- Daily , Weekly | |
| Add LBRT to Watchlist: View: Get Complete LBRT Trend Analysis ➞ | |
 | SXC SunCoke Energy, Inc. |
| Sector: Materials | |
| SubSector: Nonmetallic Mineral Mining | |
| MarketCap: 306.5 Millions | |
| Recent Price: 9.85 Smart Investing & Trading Score: 0 | |
| Day Percent Change: -4.46% Day Change: -0.46 | |
| Week Change: -6.81% Year-to-date Change: -8.3% | |
| SXC Links: Profile News Message Board | |
| Charts:- Daily , Weekly | |
| Add SXC to Watchlist: View: Get Complete SXC Trend Analysis ➞ | |
 | KAI Kadant Inc. |
| Sector: Industrials | |
| SubSector: Diversified Machinery | |
| MarketCap: 787.116 Millions | |
| Recent Price: 261.52 Smart Investing & Trading Score: 0 | |
| Day Percent Change: -4.48% Day Change: -12.27 | |
| Week Change: -7.38% Year-to-date Change: -6.7% | |
| KAI Links: Profile News Message Board | |
| Charts:- Daily , Weekly | |
| Add KAI to Watchlist: View: Get Complete KAI Trend Analysis ➞ | |
 | SAGE Sage Therapeutics, Inc. |
| Sector: Health Care | |
| SubSector: Biotechnology | |
| MarketCap: 1683.75 Millions | |
| Recent Price: 13.28 Smart Investing & Trading Score: 10 | |
| Day Percent Change: -4.73% Day Change: -0.66 | |
| Week Change: -2.99% Year-to-date Change: -38.7% | |
| SAGE Links: Profile News Message Board | |
| Charts:- Daily , Weekly | |
| Add SAGE to Watchlist: View: Get Complete SAGE Trend Analysis ➞ | |
 | CIX CompX International Inc. |
| Sector: Services & Goods | |
| SubSector: Security & Protection Services | |
| MarketCap: 189.603 Millions | |
| Recent Price: 31.42 Smart Investing & Trading Score: 31 | |
| Day Percent Change: -4.82% Day Change: -1.59 | |
| Week Change: -8.32% Year-to-date Change: 24.3% | |
| CIX Links: Profile News Message Board | |
| Charts:- Daily , Weekly | |
| Add CIX to Watchlist: View: Get Complete CIX Trend Analysis ➞ | |
 | LTH Life Time Group Holdings, Inc. |
| Sector: Services & Goods | |
| SubSector: Leisure | |
| MarketCap: 3740 Millions | |
| Recent Price: 13.00 Smart Investing & Trading Score: 0 | |
| Day Percent Change: -4.83% Day Change: -0.66 | |
| Week Change: -8.13% Year-to-date Change: -14.2% | |
| LTH Links: Profile News Message Board | |
| Charts:- Daily , Weekly | |
| Add LTH to Watchlist: View: Get Complete LTH Trend Analysis ➞ | |
 | ARIS Aris Water Solutions, Inc. |
| Sector: Utilities | |
| SubSector: Utilities - Regulated Water | |
| MarketCap: 575 Millions | |
| Recent Price: 13.73 Smart Investing & Trading Score: 43 | |
| Day Percent Change: -4.85% Day Change: -0.70 | |
| Week Change: -7.29% Year-to-date Change: 63.7% | |
| ARIS Links: Profile News Message Board | |
| Charts:- Daily , Weekly | |
| Add ARIS to Watchlist: View: Get Complete ARIS Trend Analysis ➞ | |
 | EVBN Evans Bancorp, Inc. |
| Sector: Financials | |
| SubSector: Regional - Northeast Banks | |
| MarketCap: 124.899 Millions | |
| Recent Price: 24.34 Smart Investing & Trading Score: 0 | |
| Day Percent Change: -4.88% Day Change: -1.25 | |
| Week Change: -6.64% Year-to-date Change: -22.8% | |
| EVBN Links: Profile News Message Board | |
| Charts:- Daily , Weekly | |
| Add EVBN to Watchlist: View: Get Complete EVBN Trend Analysis ➞ | |
 | RILY B. Riley Financial, Inc. |
| Sector: Financials | |
| SubSector: Asset Management | |
| MarketCap: 443.703 Millions | |
| Recent Price: 32.69 Smart Investing & Trading Score: 68 | |
| Day Percent Change: -4.97% Day Change: -1.71 | |
| Week Change: -11.22% Year-to-date Change: 55.7% | |
| RILY Links: Profile News Message Board | |
| Charts:- Daily , Weekly | |
| Add RILY to Watchlist: View: Get Complete RILY Trend Analysis ➞ | |
 | NSIT Insight Enterprises, Inc. |
| Sector: Technology | |
| SubSector: Information Technology Services | |
| MarketCap: 1498.48 Millions | |
| Recent Price: 173.22 Smart Investing & Trading Score: 0 | |
| Day Percent Change: -5.12% Day Change: -9.35 | |
| Week Change: -5.21% Year-to-date Change: -2.2% | |
| NSIT Links: Profile News Message Board | |
| Charts:- Daily , Weekly | |
| Add NSIT to Watchlist: View: Get Complete NSIT Trend Analysis ➞ | |
 | GPOR Gulfport Energy Corporation |
| Sector: Energy | |
| SubSector: Oil & Gas E&P | |
| MarketCap: 1890 Millions | |
| Recent Price: 150.57 Smart Investing & Trading Score: 26 | |
| Day Percent Change: -5.13% Day Change: -8.14 | |
| Week Change: -7.78% Year-to-date Change: 13.0% | |
| GPOR Links: Profile News Message Board | |
| Charts:- Daily , Weekly | |
| Add GPOR to Watchlist: View: Get Complete GPOR Trend Analysis ➞ | |
 | DFIN Donnelley Financial Solutions, Inc. |
| Sector: Services & Goods | |
| SubSector: Business Services | |
| MarketCap: 229.882 Millions | |
| Recent Price: 59.53 Smart Investing & Trading Score: 0 | |
| Day Percent Change: -5.18% Day Change: -3.25 | |
| Week Change: -5.54% Year-to-date Change: -4.6% | |
| DFIN Links: Profile News Message Board | |
| Charts:- Daily , Weekly | |
| Add DFIN to Watchlist: View: Get Complete DFIN Trend Analysis ➞ | |
 | BWMN Bowman Consulting Group Ltd. |
| Sector: Industrials | |
| SubSector: Engineering & Construction | |
| MarketCap: 443 Millions | |
| Recent Price: 30.75 Smart Investing & Trading Score: 7 | |
| Day Percent Change: -5.34% Day Change: -1.74 | |
| Week Change: -6.66% Year-to-date Change: -12.7% | |
| BWMN Links: Profile News Message Board | |
| Charts:- Daily , Weekly | |
| Add BWMN to Watchlist: View: Get Complete BWMN Trend Analysis ➞ | |
 | BRY Berry Corporation |
| Sector: Energy | |
| SubSector: Independent Oil & Gas | |
| MarketCap: 254.793 Millions | |
| Recent Price: 8.03 Smart Investing & Trading Score: 36 | |
| Day Percent Change: -5.42% Day Change: -0.46 | |
| Week Change: -8.12% Year-to-date Change: 14.2% | |
| BRY Links: Profile News Message Board | |
| Charts:- Daily , Weekly | |
| Add BRY to Watchlist: View: Get Complete BRY Trend Analysis ➞ | |
 | CHCT Community Healthcare Trust Incorporated |
| Sector: Financials | |
| SubSector: REIT - Healthcare Facilities | |
| MarketCap: 698.614 Millions | |
| Recent Price: 25.08 Smart Investing & Trading Score: 18 | |
| Day Percent Change: -5.47% Day Change: -1.45 | |
| Week Change: -4.75% Year-to-date Change: -5.9% | |
| CHCT Links: Profile News Message Board | |
| Charts:- Daily , Weekly | |
| Add CHCT to Watchlist: View: Get Complete CHCT Trend Analysis ➞ | |
 | ASPN Aspen Aerogels, Inc. |
| Sector: Industrials | |
| SubSector: General Building Materials | |
| MarketCap: 150.153 Millions | |
| Recent Price: 15.22 Smart Investing & Trading Score: 0 | |
| Day Percent Change: -5.47% Day Change: -0.88 | |
| Week Change: -5.47% Year-to-date Change: -3.6% | |
| ASPN Links: Profile News Message Board | |
| Charts:- Daily , Weekly | |
| Add ASPN to Watchlist: View: Get Complete ASPN Trend Analysis ➞ | |
 | VAXX Vaxxinity, Inc. |
| Sector: Health Care | |
| SubSector: Biotechnology | |
| MarketCap: 320 Millions | |
| Recent Price: 0.12 Smart Investing & Trading Score: 25 | |
| Day Percent Change: -5.62% Day Change: -0.01 | |
| Week Change: -0.69% Year-to-date Change: -86.2% | |
| VAXX Links: Profile News Message Board | |
| Charts:- Daily , Weekly | |
| Add VAXX to Watchlist: View: Get Complete VAXX Trend Analysis ➞ | |
 | TNGX Tango Therapeutics, Inc. |
| Sector: Health Care | |
| SubSector: Biotechnology | |
| MarketCap: 302 Millions | |
| Recent Price: 7.26 Smart Investing & Trading Score: 17 | |
| Day Percent Change: -5.71% Day Change: -0.44 | |
| Week Change: -2.42% Year-to-date Change: -26.7% | |
| TNGX Links: Profile News Message Board | |
| Charts:- Daily , Weekly | |
| Add TNGX to Watchlist: View: Get Complete TNGX Trend Analysis ➞ | |
 | NOG Northern Oil and Gas, Inc. |
| Sector: Energy | |
| SubSector: Oil & Gas Drilling & Exploration | |
| MarketCap: 301.939 Millions | |
| Recent Price: 39.67 Smart Investing & Trading Score: 26 | |
| Day Percent Change: -5.73% Day Change: -2.41 | |
| Week Change: -8.32% Year-to-date Change: 7.0% | |
| NOG Links: Profile News Message Board | |
| Charts:- Daily , Weekly | |
| Add NOG to Watchlist: View: Get Complete NOG Trend Analysis ➞ | |
 | ACDC ProFrac Holding Corp. |
| Sector: Energy | |
| SubSector: Oil & Gas Equipment & Services | |
| MarketCap: 1830 Millions | |
| Recent Price: 6.83 Smart Investing & Trading Score: 10 | |
| Day Percent Change: -5.92% Day Change: -0.43 | |
| Week Change: -16.91% Year-to-date Change: -19.7% | |
| ACDC Links: Profile News Message Board | |
| Charts:- Daily , Weekly | |
| Add ACDC to Watchlist: View: Get Complete ACDC Trend Analysis ➞ | |
 | BKKT Bakkt Holdings, Inc. |
| Sector: Technology | |
| SubSector: Software - Infrastructure | |
| MarketCap: 335 Millions | |
| Recent Price: 6.31 Smart Investing & Trading Score: 88 | |
| Day Percent Change: -5.96% Day Change: -0.40 | |
| Week Change: 1478.68% Year-to-date Change: 183.0% | |
| BKKT Links: Profile News Message Board | |
| Charts:- Daily , Weekly | |
| Add BKKT to Watchlist: View: Get Complete BKKT Trend Analysis ➞ | |
 | MIR Mirion Technologies, Inc. |
| Sector: Industrials | |
| SubSector: Specialty Industrial Machinery | |
| MarketCap: 1920 Millions | |
| Recent Price: 10.20 Smart Investing & Trading Score: 26 | |
| Day Percent Change: -6.16% Day Change: -0.67 | |
| Week Change: -8.03% Year-to-date Change: -0.6% | |
| MIR Links: Profile News Message Board | |
| Charts:- Daily , Weekly | |
| Add MIR to Watchlist: View: Get Complete MIR Trend Analysis ➞ | |
 | AMKR Amkor Technology, Inc. |
| Sector: Technology | |
| SubSector: Semiconductor - Integrated Circuits | |
| MarketCap: 1966.2 Millions | |
| Recent Price: 30.33 Smart Investing & Trading Score: 17 | |
| Day Percent Change: -6.24% Day Change: -2.02 | |
| Week Change: -0.95% Year-to-date Change: -8.8% | |
| AMKR Links: Profile News Message Board | |
| Charts:- Daily , Weekly | |
| Add AMKR to Watchlist: View: Get Complete AMKR Trend Analysis ➞ | |
| Too many stocks? View smallcap stocks filtered by marketcap & sector |
| Marketcap: All SmallCap Stocks (default-no microcap), Large, Mid-Range, Small & MicroCap |
| Sector: Tech, Finance, Energy, Staples, Retail, Industrial, Materials, Utilities & Medical |
|
Best Stocks Today 12Stocks.com |
© 2024 12Stocks.com Terms & Conditions Privacy Contact Us
All Information Provided Only For Education And Not To Be Used For Investing or Trading. See Terms & Conditions


One More Thing ... Get Best Stocks Delivered Daily!
Never Ever Miss A Move With Our Top Ten Stocks Lists
Find Best Stocks In Any Market - Bull or Bear Market
Take A Peek At Our Top Ten Stocks Lists: Daily, Weekly, Year-to-Date & Top Trends
Find Best Stocks In Any Market - Bull or Bear Market
Take A Peek At Our Top Ten Stocks Lists: Daily, Weekly, Year-to-Date & Top Trends
Smallcap Stocks With Best Up Trends [0-bearish to 100-bullish]: Surmodics [100], Rocky Brands[100], TransMedics Group[100], LendingClub [100], Summit [100], A10 s[100], Carpenter [100], UFP [100], PROCEPT BioRobotics[100], Xencor [100], Trinity Industries[100]
Best Smallcap Stocks Year-to-Date:
Janux [441.55%], Viking [310.69%], Longboard [259.25%], Alpine Immune[239.29%], Avidity Biosciences[185.4%], Bakkt [182.96%], Cullinan Oncology[175.33%], Arcutis Bio[173.68%], Vera [173.32%], Super Micro[159.73%], Y-mAbs [141.79%] Best Smallcap Stocks This Week:
Deciphera [73.11%], Eyenovia [45.65%], Cue Biopharma[39.56%], Seres [30.91%], Poseida [30.05%], P3 Health[29.62%], Phibro Animal[28.44%], TransMedics Group[27.72%], Surmodics [27.36%], LendingTree [26.36%], Rocky Brands[24.92%] Best Smallcap Stocks Daily:
Surmodics [29.74%], Rocky Brands[28.41%], TransMedics Group[24.93%], Ventyx Biosciences[24.63%], Eyenovia [21.84%], LendingClub [19.68%], Summit [19.59%], Powell Industries[18.89%], MiMedx Group[18.67%], CareDx [18.30%], A10 s[17.69%]