
 Login Sign Up


| |||||
 |  | ||||

| 12Stocks.com Market Intelligence |
Best SmallCap Stocks
|
| In a hurry? Small Cap Stock Lists: Performance Trends Table, Stock Charts
Sort Small Cap stocks: Daily, Weekly, Year-to-Date, Market Cap & Trends. Filter Small Cap stocks list by sector: Show all, Tech, Finance, Energy, Staples, Retail, Industrial, Materials, Utilities and HealthCare Filter Small Cap stocks list by size: All Large Medium Small and MicroCap |
| 12Stocks.com Small Cap Stocks Performances & Trends Daily | |||||||||
|
|  The overall Smart Investing & Trading Score is 49 (0-bearish to 100-bullish) which puts Small Cap index in short term neutral trend. The Smart Investing & Trading Score from previous trading session is 14 and hence an improvement of trend.
| ||||||||
Here are the Smart Investing & Trading Scores of the most requested small cap stocks at 12Stocks.com (click stock name for detailed review):
|


| 12Stocks.com: Investing in Smallcap Index with Stocks | |
|
The following table helps investors and traders sort through current performance and trends (as measured by Smart Investing & Trading Score) of various
stocks in the Smallcap Index. Quick View: Move mouse or cursor over stock symbol (ticker) to view short-term technical chart and over stock name to view long term chart. Click on  to add stock symbol to your watchlist and to add stock symbol to your watchlist and  to view watchlist. Click on any ticker or stock name for detailed market intelligence report for that stock. to view watchlist. Click on any ticker or stock name for detailed market intelligence report for that stock. |
12Stocks.com Performance of Stocks in Smallcap Index
| Ticker | Stock Name | Watchlist | Category | Recent Price | Smart Investing & Trading Score | Change % | YTD Change% |
| TTMI | TTM |   | Technology | 16.65 | 100 | 12.73 | 5.31% |
| FOSL | Fossil Group | | Consumer Staples | 0.90 | 59 | 12.68 | -38.11% |
| BIRD | Allbirds | | Services & Goods | 0.61 | 17 | 12.36 | -50.40% |
| TROX | Tronox | | Materials | 19.18 | 100 | 12.23 | 35.45% |
| SFM | Sprouts Farmers | | Services & Goods | 72.00 | 100 | 11.99 | 49.66% |
| FEAM | 5E Advanced | | Materials | 1.26 | 55 | 11.95 | -10.28% |
| SLQT | SelectQuote | | Financials | 1.80 | 59 | 11.80 | 31.39% |
| TPB | Turning Point | | Consumer Staples | 32.57 | 100 | 11.58 | 23.75% |
| LPSN | LivePerson | | Technology | 0.57 | 54 | 11.43 | -85.08% |
| BV | BrightView | | Industrials | 12.54 | 100 | 11.27 | 48.93% |
| ALKT | Alkami | | Technology | 27.18 | 95 | 11.21 | 12.45% |
| EXPI | eXp World | | Financials | 11.25 | 74 | 10.84 | -27.51% |
| FTDR | frontdoor | | Services & Goods | 34.02 | 100 | 10.60 | -3.41% |
| EYPT | EyePoint | | Health Care | 19.94 | 49 | 10.53 | -13.72% |
| MSTR | MicroStrategy | | Technology | 1129.42 | 43 | 9.84 | 78.81% |
| ASRT | Assertio | | Health Care | 1.01 | 100 | 9.64 | -6.48% |
| OMER | Omeros | | Health Care | 3.72 | 54 | 9.41 | 13.76% |
| BDC | Belden | | Industrials | 88.91 | 100 | 9.33 | 15.09% |
| TPIC | TPI Composites | | Industrials | 3.64 | 100 | 9.31 | -12.08% |
| ITRI | Itron | | Technology | 99.82 | 100 | 9.05 | 32.19% |
| TWOU | 2U | | Technology | 0.27 | 59 | 9.01 | -78.17% |
| HRTX | Heron | | Health Care | 2.55 | 37 | 8.97 | 50.00% |
| UPWK | Upwork | | Technology | 12.99 | 69 | 8.61 | -12.64% |
| TSE | Trinseo S.A | | Materials | 2.82 | 37 | 8.46 | -66.31% |
| DLX | Deluxe | | Services & Goods | 21.57 | 100 | 8.45 | 0.56% |


| Too many stocks? View smallcap stocks filtered by marketcap & sector |
| Marketcap: All SmallCap Stocks (default-no microcap), Large, Mid-Range, Small |
| Smallcap Sector: Tech, Finance, Energy, Staples, Retail, Industrial, Materials, & Medical |
|
Get the most comprehensive stock market coverage daily at 12Stocks.com ➞ Best Stocks Today ➞ Best Stocks Weekly ➞ Best Stocks Year-to-Date ➞ Best Stocks Trends ➞  Best Stocks Today 12Stocks.com Best Nasdaq Stocks ➞ Best S&P 500 Stocks ➞ Best Tech Stocks ➞ Best Biotech Stocks ➞ |
| Detailed Overview of SmallCap Stocks |
| SmallCap Technical Overview, Leaders & Laggards, Top SmallCap ETF Funds & Detailed SmallCap Stocks List, Charts, Trends & More |
| Smallcap: Technical Analysis, Trends & YTD Performance | |
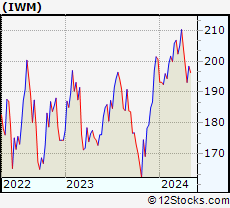
| SmallCap segment as represented by
IWM, an exchange-traded fund [ETF], holds basket of thousands of smallcap stocks from across all major sectors of the US stock market. The smallcap index (contains stocks like Riverbed & Sotheby's) is down by -0.39% and is currently underperforming the overall market by -6.01% year-to-date. Below is a quick view of technical charts and trends: | |
 IWM Weekly Chart |
|
| Long Term Trend: Not Good | |
| Medium Term Trend: Good | |
 IWM Daily Chart |
|
| Short Term Trend: Deteriorating | |
| Overall Trend Score: 49 | |
| YTD Performance: -0.39% | |
| **Trend Scores & Views Are Only For Educational Purposes And Not For Investing | |
| 12Stocks.com: Top Performing Small Cap Index Stocks | ||||||||||||||||||||||||||||||||||||||||||||||||
 The top performing Small Cap Index stocks year to date are
Now, more recently, over last week, the top performing Small Cap Index stocks on the move are


|
||||||||||||||||||||||||||||||||||||||||||||||||
| 12Stocks.com: Investing in Smallcap Index using Exchange Traded Funds | |
|
The following table shows list of key exchange traded funds (ETF) that
help investors track Smallcap index. The following list also includes leveraged ETF funds that track twice or thrice the daily returns of Smallcap indices. Short or inverse ETF funds move in the opposite direction to the index they track and are useful during market pullbacks or during bear markets. Quick View: Move mouse or cursor over ETF symbol (ticker) to view short-term technical chart and over ETF name to view long term chart. Click on ticker or stock name for detailed view. Click on to add stock symbol to your watchlist and to view watchlist. |
12Stocks.com List of ETFs that track Smallcap Index
| Ticker | ETF Name | Watchlist | Recent Price | Smart Investing & Trading Score | Change % | Week % | Year-to-date % |
| IWM | iShares Russell 2000 | | 199.92 | 49 | 1.84 | 0.77 | -0.39% |
| IJR | iShares Core S&P Small-Cap | | 106.33 | 50 | 1.52 | 0.64 | -1.77% |
| VTWO | Vanguard Russell 2000 ETF | | 80.85 | 42 | 1.88 | 0.79 | -0.31% |
| IWN | iShares Russell 2000 Value | | 152.88 | 75 | 2.04 | 1.15 | -1.58% |
| IWO | iShares Russell 2000 Growth | | 254.34 | 32 | 1.91 | 0.49 | 0.84% |
| IJS | iShares S&P Small-Cap 600 Value | | 98.02 | 43 | 1.68 | 0.85 | -4.9% |
| IJT | iShares S&P Small-Cap 600 Growth | | 126.72 | 63 | 1.42 | 0.5 | 1.26% |
| XSLV | PowerShares S&P SmallCap Low Volatil ETF | | 43.14 | 73 | 0.72 | 0.98 | -2.29% |
| SDD | ProShares UltraShort SmallCap600 | | 19.31 | 56 | -2.02 | -0.21 | 4.79% |
| SMLV | SPDR SSGA US Small Cap Low Volatil ETF | | 108.83 | 87 | 1.30 | 1.22 | -3.27% |
| SAA | ProShares Ultra SmallCap600 | | 22.93 | 42 | 1.56 | -0.46 | -8.08% |
| SBB | ProShares Short SmallCap600 | | 16.37 | 49 | -1.14 | -0.09 | 2.76% |
| 12Stocks.com: Charts, Trends, Fundamental Data and Performances of SmallCap Stocks | |
|
We now take in-depth look at all SmallCap stocks including charts, multi-period performances and overall trends (as measured by Smart Investing & Trading Score). One can sort SmallCap stocks (click link to choose) by Daily, Weekly and by Year-to-Date performances. Also, one can sort by size of the company or by market capitalization. |
| Select Your Default Chart Type: | |||||
| |||||
| Click on stock symbol or name for detailed view. Click on to add stock symbol to your watchlist and to view watchlist. Quick View: Move mouse or cursor over "Daily" to quickly view daily technical stock chart and over "Weekly" to view weekly technical stock chart. | |||||

 | TTMI TTM Technologies, Inc. |
| Sector: Technology | |
| SubSector: Printed Circuit Boards | |
| MarketCap: 1028.35 Millions | |
| Recent Price: 16.65 Smart Investing & Trading Score: 100 | |
| Day Percent Change: 12.73% Day Change: 1.88 | |
| Week Change: 10.05% Year-to-date Change: 5.3% | |
| TTMI Links: Profile News Message Board | |
| Charts:- Daily , Weekly | |
| Add TTMI to Watchlist: View: Get Complete TTMI Trend Analysis ➞ | |
 | FOSL Fossil Group, Inc. |
| Sector: Consumer Staples | |
| SubSector: Textile - Apparel Footwear & Accessories | |
| MarketCap: 215.87 Millions | |
| Recent Price: 0.90 Smart Investing & Trading Score: 59 | |
| Day Percent Change: 12.68% Day Change: 0.10 | |
| Week Change: 14.24% Year-to-date Change: -38.1% | |
| FOSL Links: Profile News Message Board | |
| Charts:- Daily , Weekly | |
| Add FOSL to Watchlist: View: Get Complete FOSL Trend Analysis ➞ | |
 | BIRD Allbirds, Inc. |
| Sector: Services & Goods | |
| SubSector: Apparel Retail | |
| MarketCap: 184 Millions | |
| Recent Price: 0.61 Smart Investing & Trading Score: 17 | |
| Day Percent Change: 12.36% Day Change: 0.07 | |
| Week Change: -0.41% Year-to-date Change: -50.4% | |
| BIRD Links: Profile News Message Board | |
| Charts:- Daily , Weekly | |
| Add BIRD to Watchlist: View: Get Complete BIRD Trend Analysis ➞ | |
 | TROX Tronox Holdings plc |
| Sector: Materials | |
| SubSector: Chemicals - Major Diversified | |
| MarketCap: 807 Millions | |
| Recent Price: 19.18 Smart Investing & Trading Score: 100 | |
| Day Percent Change: 12.23% Day Change: 2.09 | |
| Week Change: 9.73% Year-to-date Change: 35.5% | |
| TROX Links: Profile News Message Board | |
| Charts:- Daily , Weekly | |
| Add TROX to Watchlist: View: Get Complete TROX Trend Analysis ➞ | |
 | SFM Sprouts Farmers Market, Inc. |
| Sector: Services & Goods | |
| SubSector: Grocery Stores | |
| MarketCap: 2495.85 Millions | |
| Recent Price: 72.00 Smart Investing & Trading Score: 100 | |
| Day Percent Change: 11.99% Day Change: 7.71 | |
| Week Change: 7.49% Year-to-date Change: 49.7% | |
| SFM Links: Profile News Message Board | |
| Charts:- Daily , Weekly | |
| Add SFM to Watchlist: View: Get Complete SFM Trend Analysis ➞ | |
 | FEAM 5E Advanced Materials Inc. |
| Sector: Materials | |
| SubSector: Specialty Chemicals | |
| MarketCap: 247 Millions | |
| Recent Price: 1.26 Smart Investing & Trading Score: 55 | |
| Day Percent Change: 11.95% Day Change: 0.14 | |
| Week Change: 11.95% Year-to-date Change: -10.3% | |
| FEAM Links: Profile News Message Board | |
| Charts:- Daily , Weekly | |
| Add FEAM to Watchlist: View: Get Complete FEAM Trend Analysis ➞ | |
 | SLQT SelectQuote, Inc. |
| Sector: Financials | |
| SubSector: Insurance Brokers | |
| MarketCap: 38257 Millions | |
| Recent Price: 1.80 Smart Investing & Trading Score: 59 | |
| Day Percent Change: 11.80% Day Change: 0.19 | |
| Week Change: 11.8% Year-to-date Change: 31.4% | |
| SLQT Links: Profile News Message Board | |
| Charts:- Daily , Weekly | |
| Add SLQT to Watchlist: View: Get Complete SLQT Trend Analysis ➞ | |
 | TPB Turning Point Brands, Inc. |
| Sector: Consumer Staples | |
| SubSector: Tobacco Products, Other | |
| MarketCap: 381.97 Millions | |
| Recent Price: 32.57 Smart Investing & Trading Score: 100 | |
| Day Percent Change: 11.58% Day Change: 3.38 | |
| Week Change: 15.33% Year-to-date Change: 23.8% | |
| TPB Links: Profile News Message Board | |
| Charts:- Daily , Weekly | |
| Add TPB to Watchlist: View: Get Complete TPB Trend Analysis ➞ | |
 | LPSN LivePerson, Inc. |
| Sector: Technology | |
| SubSector: Business Software & Services | |
| MarketCap: 1070.58 Millions | |
| Recent Price: 0.57 Smart Investing & Trading Score: 54 | |
| Day Percent Change: 11.43% Day Change: 0.06 | |
| Week Change: 7.53% Year-to-date Change: -85.1% | |
| LPSN Links: Profile News Message Board | |
| Charts:- Daily , Weekly | |
| Add LPSN to Watchlist: View: Get Complete LPSN Trend Analysis ➞ | |
 | BV BrightView Holdings, Inc. |
| Sector: Industrials | |
| SubSector: General Contractors | |
| MarketCap: 973.763 Millions | |
| Recent Price: 12.54 Smart Investing & Trading Score: 100 | |
| Day Percent Change: 11.27% Day Change: 1.27 | |
| Week Change: 11.17% Year-to-date Change: 48.9% | |
| BV Links: Profile News Message Board | |
| Charts:- Daily , Weekly | |
| Add BV to Watchlist: View: Get Complete BV Trend Analysis ➞ | |
 | ALKT Alkami Technology, Inc. |
| Sector: Technology | |
| SubSector: Software - Application | |
| MarketCap: 1530 Millions | |
| Recent Price: 27.18 Smart Investing & Trading Score: 95 | |
| Day Percent Change: 11.21% Day Change: 2.74 | |
| Week Change: 10.89% Year-to-date Change: 12.5% | |
| ALKT Links: Profile News Message Board | |
| Charts:- Daily , Weekly | |
| Add ALKT to Watchlist: View: Get Complete ALKT Trend Analysis ➞ | |
 | EXPI eXp World Holdings, Inc. |
| Sector: Financials | |
| SubSector: Property Management | |
| MarketCap: 448.042 Millions | |
| Recent Price: 11.25 Smart Investing & Trading Score: 74 | |
| Day Percent Change: 10.84% Day Change: 1.10 | |
| Week Change: 11.17% Year-to-date Change: -27.5% | |
| EXPI Links: Profile News Message Board | |
| Charts:- Daily , Weekly | |
| Add EXPI to Watchlist: View: Get Complete EXPI Trend Analysis ➞ | |
 | FTDR frontdoor, inc. |
| Sector: Services & Goods | |
| SubSector: Business Services | |
| MarketCap: 2974.22 Millions | |
| Recent Price: 34.02 Smart Investing & Trading Score: 100 | |
| Day Percent Change: 10.60% Day Change: 3.26 | |
| Week Change: 9.57% Year-to-date Change: -3.4% | |
| FTDR Links: Profile News Message Board | |
| Charts:- Daily , Weekly | |
| Add FTDR to Watchlist: View: Get Complete FTDR Trend Analysis ➞ | |
 | EYPT EyePoint Pharmaceuticals, Inc. |
| Sector: Health Care | |
| SubSector: Biotechnology | |
| MarketCap: 125.085 Millions | |
| Recent Price: 19.94 Smart Investing & Trading Score: 49 | |
| Day Percent Change: 10.53% Day Change: 1.90 | |
| Week Change: 19.04% Year-to-date Change: -13.7% | |
| EYPT Links: Profile News Message Board | |
| Charts:- Daily , Weekly | |
| Add EYPT to Watchlist: View: Get Complete EYPT Trend Analysis ➞ | |
 | MSTR MicroStrategy Incorporated |
| Sector: Technology | |
| SubSector: Application Software | |
| MarketCap: 1164.52 Millions | |
| Recent Price: 1129.42 Smart Investing & Trading Score: 43 | |
| Day Percent Change: 9.84% Day Change: 101.15 | |
| Week Change: -11.93% Year-to-date Change: 78.8% | |
| MSTR Links: Profile News Message Board | |
| Charts:- Daily , Weekly | |
| Add MSTR to Watchlist: View: Get Complete MSTR Trend Analysis ➞ | |
 | ASRT Assertio Therapeutics, Inc. |
| Sector: Health Care | |
| SubSector: Drugs - Generic | |
| MarketCap: 65.8185 Millions | |
| Recent Price: 1.01 Smart Investing & Trading Score: 100 | |
| Day Percent Change: 9.64% Day Change: 0.09 | |
| Week Change: 21.95% Year-to-date Change: -6.5% | |
| ASRT Links: Profile News Message Board | |
| Charts:- Daily , Weekly | |
| Add ASRT to Watchlist: View: Get Complete ASRT Trend Analysis ➞ | |
 | OMER Omeros Corporation |
| Sector: Health Care | |
| SubSector: Biotechnology | |
| MarketCap: 759.585 Millions | |
| Recent Price: 3.72 Smart Investing & Trading Score: 54 | |
| Day Percent Change: 9.41% Day Change: 0.32 | |
| Week Change: 18.1% Year-to-date Change: 13.8% | |
| OMER Links: Profile News Message Board | |
| Charts:- Daily , Weekly | |
| Add OMER to Watchlist: View: Get Complete OMER Trend Analysis ➞ | |
 | BDC Belden Inc. |
| Sector: Industrials | |
| SubSector: Industrial Electrical Equipment | |
| MarketCap: 1490.59 Millions | |
| Recent Price: 88.91 Smart Investing & Trading Score: 100 | |
| Day Percent Change: 9.33% Day Change: 7.59 | |
| Week Change: 6.61% Year-to-date Change: 15.1% | |
| BDC Links: Profile News Message Board | |
| Charts:- Daily , Weekly | |
| Add BDC to Watchlist: View: Get Complete BDC Trend Analysis ➞ | |
 | TPIC TPI Composites, Inc. |
| Sector: Industrials | |
| SubSector: Diversified Machinery | |
| MarketCap: 451.016 Millions | |
| Recent Price: 3.64 Smart Investing & Trading Score: 100 | |
| Day Percent Change: 9.31% Day Change: 0.31 | |
| Week Change: 30.94% Year-to-date Change: -12.1% | |
| TPIC Links: Profile News Message Board | |
| Charts:- Daily , Weekly | |
| Add TPIC to Watchlist: View: Get Complete TPIC Trend Analysis ➞ | |
 | ITRI Itron, Inc. |
| Sector: Technology | |
| SubSector: Scientific & Technical Instruments | |
| MarketCap: 2222.23 Millions | |
| Recent Price: 99.82 Smart Investing & Trading Score: 100 | |
| Day Percent Change: 9.05% Day Change: 8.28 | |
| Week Change: 4.25% Year-to-date Change: 32.2% | |
| ITRI Links: Profile News Message Board | |
| Charts:- Daily , Weekly | |
| Add ITRI to Watchlist: View: Get Complete ITRI Trend Analysis ➞ | |
 | TWOU 2U, Inc. |
| Sector: Technology | |
| SubSector: Application Software | |
| MarketCap: 1090.12 Millions | |
| Recent Price: 0.27 Smart Investing & Trading Score: 59 | |
| Day Percent Change: 9.01% Day Change: 0.02 | |
| Week Change: 11.74% Year-to-date Change: -78.2% | |
| TWOU Links: Profile News Message Board | |
| Charts:- Daily , Weekly | |
| Add TWOU to Watchlist: View: Get Complete TWOU Trend Analysis ➞ | |
 | HRTX Heron Therapeutics, Inc. |
| Sector: Health Care | |
| SubSector: Biotechnology | |
| MarketCap: 1172.75 Millions | |
| Recent Price: 2.55 Smart Investing & Trading Score: 37 | |
| Day Percent Change: 8.97% Day Change: 0.21 | |
| Week Change: 4.08% Year-to-date Change: 50.0% | |
| HRTX Links: Profile News Message Board | |
| Charts:- Daily , Weekly | |
| Add HRTX to Watchlist: View: Get Complete HRTX Trend Analysis ➞ | |
 | UPWK Upwork Inc. |
| Sector: Technology | |
| SubSector: Internet Information Providers | |
| MarketCap: 815.98 Millions | |
| Recent Price: 12.99 Smart Investing & Trading Score: 69 | |
| Day Percent Change: 8.61% Day Change: 1.03 | |
| Week Change: 12.37% Year-to-date Change: -12.6% | |
| UPWK Links: Profile News Message Board | |
| Charts:- Daily , Weekly | |
| Add UPWK to Watchlist: View: Get Complete UPWK Trend Analysis ➞ | |
 | TSE Trinseo S.A. |
| Sector: Materials | |
| SubSector: Specialty Chemicals | |
| MarketCap: 790.057 Millions | |
| Recent Price: 2.82 Smart Investing & Trading Score: 37 | |
| Day Percent Change: 8.46% Day Change: 0.22 | |
| Week Change: 0.36% Year-to-date Change: -66.3% | |
| TSE Links: Profile News Message Board | |
| Charts:- Daily , Weekly | |
| Add TSE to Watchlist: View: Get Complete TSE Trend Analysis ➞ | |
 | DLX Deluxe Corporation |
| Sector: Services & Goods | |
| SubSector: Business Services | |
| MarketCap: 1025.82 Millions | |
| Recent Price: 21.57 Smart Investing & Trading Score: 100 | |
| Day Percent Change: 8.45% Day Change: 1.68 | |
| Week Change: 6% Year-to-date Change: 0.6% | |
| DLX Links: Profile News Message Board | |
| Charts:- Daily , Weekly | |
| Add DLX to Watchlist: View: Get Complete DLX Trend Analysis ➞ | |
| Too many stocks? View smallcap stocks filtered by marketcap & sector |
| Marketcap: All SmallCap Stocks (default-no microcap), Large, Mid-Range, Small & MicroCap |
| Sector: Tech, Finance, Energy, Staples, Retail, Industrial, Materials, Utilities & Medical |
|
Best Stocks Today 12Stocks.com |
© 2024 12Stocks.com Terms & Conditions Privacy Contact Us
All Information Provided Only For Education And Not To Be Used For Investing or Trading. See Terms & Conditions


One More Thing ... Get Best Stocks Delivered Daily!
Never Ever Miss A Move With Our Top Ten Stocks Lists
Find Best Stocks In Any Market - Bull or Bear Market
Take A Peek At Our Top Ten Stocks Lists: Daily, Weekly, Year-to-Date & Top Trends
Find Best Stocks In Any Market - Bull or Bear Market
Take A Peek At Our Top Ten Stocks Lists: Daily, Weekly, Year-to-Date & Top Trends
Smallcap Stocks With Best Up Trends [0-bearish to 100-bullish]: Emergent BioSolutions[100], Aspen Aerogels[100], Carvana Co[100], Perdoceo Education[100], Gannett Co[100], Pitney Bowes[100], Benchmark Electronics[100], Origin Materials[100], FormFactor [100], Lantheus [100], Q2 [100]
Best Smallcap Stocks Year-to-Date:
Janux [440.16%], Viking [307.09%], Longboard [273.98%], Alpine Immune[239.29%], Bakkt [187.89%], Avidity Biosciences[182.96%], Vera [170.74%], Cullinan Oncology[169.74%], Super Micro[168.25%], Arcutis Bio[166.25%], Y-mAbs [152.93%] Best Smallcap Stocks This Week:
Deciphera [73.24%], Emergent BioSolutions[71.88%], Eyenovia [49.22%], Aspen Aerogels[48.14%], P3 Health[38.51%], Carvana Co[38.18%], Cue Biopharma[37.73%], Origin Materials[36.24%], TransMedics Group[35.14%], Seres [34.55%], Enovix [32.07%] Best Smallcap Stocks Daily:
Emergent BioSolutions[70.98%], Aspen Aerogels[56.70%], Carvana Co[33.77%], Perdoceo Education[31.46%], Enovix [31.06%], Office Properties[28.00%], Gannett Co[26.97%], Sunnova Energy[25.21%], Pitney Bowes[24.70%], Pulmonx [21.50%], CommScope Holding[20.95%]