
 Login Sign Up


| |||||
 |  | ||||

| 12Stocks.com Market Intelligence |
Best Tech Stocks
| In a hurry? Tech Stocks Lists: Performance & Trends, Stock Charts, FANG Stocks
Sort Tech stocks: Daily, Weekly, Year-to-Date, Market Cap & Trends. Filter Tech stocks list by size:All Tech Large Mid-Range Small and MicroCap |
| 12Stocks.com Tech Stocks Performances & Trends Daily | |||||||||
|
|  The overall Smart Investing & Trading Score is 68 (0-bearish to 100-bullish) which puts Technology sector in short term neutral to bullish trend. The Smart Investing & Trading Score from previous trading session is 58 and hence an improvement of trend.
| ||||||||
Here are the Smart Investing & Trading Scores of the most requested Technology stocks at 12Stocks.com (click stock name for detailed review):
|


| 12Stocks.com: Investing in Technology sector with Stocks | |
|
The following table helps investors and traders sort through current performance and trends (as measured by Smart Investing & Trading Score) of various
stocks in the Tech sector. Quick View: Move mouse or cursor over stock symbol (ticker) to view short-term technical chart and over stock name to view long term chart. Click on  to add stock symbol to your watchlist and to add stock symbol to your watchlist and  to view watchlist. Click on any ticker or stock name for detailed market intelligence report for that stock. to view watchlist. Click on any ticker or stock name for detailed market intelligence report for that stock. |
12Stocks.com Performance of Stocks in Tech Sector
| Ticker | Stock Name | Watchlist | Category | Recent Price | Smart Investing & Trading Score | Change % | YTD Change% |
| MSCI | MSCI |   | Processing | 475.13 | 32 | -0.55 | -16.00% |
| JAMF | Jamf Holding | | Software | 19.44 | 61 | -0.56 | 7.58% |
| WDAY | Workday | | Software | 249.61 | 10 | -0.57 | -9.58% |
| CHKP | Check Point | | Security Software | 150.31 | 0 | -0.59 | -1.62% |
| NFLX | Netflix | | CATV | 557.07 | 18 | -0.74 | 14.42% |
| ANET | Arista Networks | | Computer | 262.73 | 58 | -0.74 | 11.56% |
| GIB | CGI | | IT | 102.29 | 0 | -0.82 | -4.59% |
| ERIC | Telefonaktiebolaget LM | | Communication | 5.13 | 30 | -0.87 | -18.49% |
| ADBE | Adobe | | Software | 473.12 | 30 | -0.93 | -20.70% |
| KC | Kingsoft Cloud | | Software | 3.13 | 81 | -0.95 | -17.31% |
| MTCH | Match | | Internet | 31.57 | 23 | -0.99 | -13.49% |
| ASML | ASML Holding | | Semiconductor | 908.27 | 51 | -1.16 | 20.00% |
| BIGC | BigCommerce | | Software | 5.83 | 35 | -1.19 | -40.14% |
| ADSK | Autodesk | | Software | 215.28 | 18 | -1.22 | -11.58% |
| ANSS | ANSYS | | Software | 329.62 | 38 | -1.24 | -9.17% |
| SAP | SAP SE | | Software | 183.74 | 48 | -1.31 | 18.85% |
| ORCL | Oracle | | Software | 115.66 | 44 | -1.32 | 9.70% |
| ABNB | Airbnb | | Internet Content & Information | 162.02 | 64 | -1.35 | 19.00% |
| MSFT | Microsoft | | Software | 400.73 | 36 | -1.38 | 6.57% |
| ACN | Accenture | | IT | 303.70 | 10 | -1.40 | -13.45% |
| JD | JD.com | | Internet | 29.87 | 100 | -1.55 | 3.39% |
| FROG | JFrog | | Software | 41.34 | 71 | -1.55 | 19.41% |
| TEAM | Atlassian | | IT | 176.36 | 0 | -1.72 | -25.86% |
| DDOG | Datadog | | Software | 129.06 | 90 | -1.82 | 6.33% |
| INTC | Intel | | Semiconductor | 31.29 | 0 | -1.85 | -37.73% |
| For chart view version of above stock list: Chart View ➞ 0 - 25 , 25 - 50 , 50 - 75 , 75 - 100 , 100 - 125 , 125 - 150 , 150 - 175 , 175 - 200 | ||
 | Click To Change The Sort Order: By Market Cap or Company Size Performance: Year-to-date, Week and Day |  |
|
Get the most comprehensive stock market coverage daily at 12Stocks.com ➞ Best Stocks Today ➞ Best Stocks Weekly ➞ Best Stocks Year-to-Date ➞ Best Stocks Trends ➞  Best Stocks Today 12Stocks.com Best Nasdaq Stocks ➞ Best S&P 500 Stocks ➞ Best Tech Stocks ➞ Best Biotech Stocks ➞ |
| Detailed Overview of Tech Stocks |
| Tech Technical Overview, Leaders & Laggards, Top Tech ETF Funds & Detailed Tech Stocks List, Charts, Trends & More |
| Tech Sector: Technical Analysis, Trends & YTD Performance | |
| Technology sector is composed of stocks
from semiconductors, software, web, social media
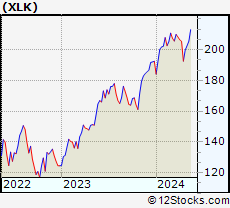
and services subsectors. Technology sector, as represented by XLK, an exchange-traded fund [ETF] that holds basket of tech stocks (e.g, Intel, Google) is up by 4.19% and is currently underperforming the overall market by -2.1% year-to-date. Below is a quick view of technical charts and trends: |
|
 XLK Weekly Chart |
|
| Long Term Trend: Good | |
| Medium Term Trend: Not Good | |
 XLK Daily Chart |
|
| Short Term Trend: Very Good | |
| Overall Trend Score: 68 | |
| YTD Performance: 4.19% | |
| **Trend Scores & Views Are Only For Educational Purposes And Not For Investing | |
| 12Stocks.com: Top Performing Technology Sector Stocks | ||||||||||||||||||||||||||||||||||||||||||||||||
 The top performing Technology sector stocks year to date are
Now, more recently, over last week, the top performing Technology sector stocks on the move are


|
||||||||||||||||||||||||||||||||||||||||||||||||
| 12Stocks.com: Investing in Tech Sector using Exchange Traded Funds | |
|
The following table shows list of key exchange traded funds (ETF) that
help investors track Tech Index. For detailed view, check out our ETF Funds section of our website. Quick View: Move mouse or cursor over ETF symbol (ticker) to view short-term technical chart and over ETF name to view long term chart. Click on ticker or stock name for detailed view. Click on to add stock symbol to your watchlist and to view watchlist. |
12Stocks.com List of ETFs that track Tech Index
| Ticker | ETF Name | Watchlist | Recent Price | Smart Investing & Trading Score | Change % | Week % | Year-to-date % |
| XLK | Technology | | 200.54 | 68 | 0.36 | 0.36 | 4.19% |
| QQQ | QQQ | | 431.87 | 68 | 0.20 | 0.2 | 5.46% |
| IYW | Technology | | 130.98 | 68 | 0.02 | 0.02 | 6.7% |
| VGT | Information Technology | | 505.39 | 75 | 0.29 | 0.29 | 4.42% |
| IXN | Global Tech | | 71.92 | 58 | 0.17 | 0.17 | 5.49% |
| IGV | Tech-Software | | 81.03 | 35 | -0.07 | -0.07 | -0.12% |
| XSD | Semiconductor | | 226.15 | 100 | 0.65 | 0.65 | 0.61% |
| TQQQ | QQQ | | 55.74 | 68 | 0.83 | 0.83 | 9.94% |
| SQQQ | Short QQQ | | 11.36 | 27 | -0.61 | -0.61 | -15.54% |
| SOXL | Semicondct Bull 3X | | 40.60 | 80 | 2.14 | 2.14 | 29.3% |
| SOXS | Semicondct Bear 3X | | 35.17 | 51 | 0.21 | 0.21 | 504.38% |
| SOXX | PHLX Semiconductor | | 216.99 | 78 | 0.04 | 0.04 | 12.99% |
| QTEC | First -100-Tech | | 183.52 | 75 | -0.26 | -0.26 | 4.59% |
| SMH | Semiconductor | | 218.13 | 63 | 0.22 | 0.22 | 24.74% |
| 12Stocks.com: Charts, Trends, Fundamental Data and Performances of Tech Stocks | |
|
We now take in-depth look at all Tech stocks including charts, multi-period performances and overall trends (as measured by Smart Investing & Trading Score). One can sort Tech stocks (click link to choose) by Daily, Weekly and by Year-to-Date performances. Also, one can sort by size of the company or by market capitalization. |
| Select Your Default Chart Type: | |||||
| |||||
| Click on stock symbol or name for detailed view. Click on to add stock symbol to your watchlist and to view watchlist. Quick View: Move mouse or cursor over "Daily" to quickly view daily technical stock chart and over "Weekly" to view weekly technical stock chart. | |||||


 | MSCI MSCI Inc. |
| Sector: Technology | |
| SubSector: Processing Systems & Products | |
| MarketCap: 21086.3 Millions | |
| Recent Price: 475.13 Smart Investing & Trading Score: 32 | |
| Day Percent Change: -0.55% Day Change: -2.65 | |
| Week Change: -0.55% Year-to-date Change: -16.0% | |
| MSCI Links: Profile News Message Board | |
| Charts:- Daily , Weekly | |
| Add MSCI to Watchlist: View: Get Complete MSCI Trend Analysis ➞ | |
 | JAMF Jamf Holding Corp. |
| Sector: Technology | |
| SubSector: Software Application | |
| MarketCap: 36987 Millions | |
| Recent Price: 19.44 Smart Investing & Trading Score: 61 | |
| Day Percent Change: -0.56% Day Change: -0.11 | |
| Week Change: -0.56% Year-to-date Change: 7.6% | |
| JAMF Links: Profile News Message Board | |
| Charts:- Daily , Weekly | |
| Add JAMF to Watchlist: View: Get Complete JAMF Trend Analysis ➞ | |
 | WDAY Workday, Inc. |
| Sector: Technology | |
| SubSector: Application Software | |
| MarketCap: 31372.1 Millions | |
| Recent Price: 249.61 Smart Investing & Trading Score: 10 | |
| Day Percent Change: -0.57% Day Change: -1.43 | |
| Week Change: -0.57% Year-to-date Change: -9.6% | |
| WDAY Links: Profile News Message Board | |
| Charts:- Daily , Weekly | |
| Add WDAY to Watchlist: View: Get Complete WDAY Trend Analysis ➞ | |
 | CHKP Check Point Software Technologies Ltd. |
| Sector: Technology | |
| SubSector: Security Software & Services | |
| MarketCap: 15112.2 Millions | |
| Recent Price: 150.31 Smart Investing & Trading Score: 0 | |
| Day Percent Change: -0.59% Day Change: -0.89 | |
| Week Change: -0.59% Year-to-date Change: -1.6% | |
| CHKP Links: Profile News Message Board | |
| Charts:- Daily , Weekly | |
| Add CHKP to Watchlist: View: Get Complete CHKP Trend Analysis ➞ | |
 | NFLX Netflix, Inc. |
| Sector: Technology | |
| SubSector: CATV Systems | |
| MarketCap: 162108 Millions | |
| Recent Price: 557.07 Smart Investing & Trading Score: 18 | |
| Day Percent Change: -0.74% Day Change: -4.16 | |
| Week Change: -0.74% Year-to-date Change: 14.4% | |
| NFLX Links: Profile News Message Board | |
| Charts:- Daily , Weekly | |
| Add NFLX to Watchlist: View: Get Complete NFLX Trend Analysis ➞ | |
 | ANET Arista Networks, Inc. |
| Sector: Technology | |
| SubSector: Diversified Computer Systems | |
| MarketCap: 14071.2 Millions | |
| Recent Price: 262.73 Smart Investing & Trading Score: 58 | |
| Day Percent Change: -0.74% Day Change: -1.97 | |
| Week Change: -0.74% Year-to-date Change: 11.6% | |
| ANET Links: Profile News Message Board | |
| Charts:- Daily , Weekly | |
| Add ANET to Watchlist: View: Get Complete ANET Trend Analysis ➞ | |
 | GIB CGI Inc. |
| Sector: Technology | |
| SubSector: Information Technology Services | |
| MarketCap: 13185.3 Millions | |
| Recent Price: 102.29 Smart Investing & Trading Score: 0 | |
| Day Percent Change: -0.82% Day Change: -0.85 | |
| Week Change: -0.82% Year-to-date Change: -4.6% | |
| GIB Links: Profile News Message Board | |
| Charts:- Daily , Weekly | |
| Add GIB to Watchlist: View: Get Complete GIB Trend Analysis ➞ | |
 | ERIC Telefonaktiebolaget LM Ericsson (publ) |
| Sector: Technology | |
| SubSector: Communication Equipment | |
| MarketCap: 27041.1 Millions | |
| Recent Price: 5.13 Smart Investing & Trading Score: 30 | |
| Day Percent Change: -0.87% Day Change: -0.04 | |
| Week Change: -0.87% Year-to-date Change: -18.5% | |
| ERIC Links: Profile News Message Board | |
| Charts:- Daily , Weekly | |
| Add ERIC to Watchlist: View: Get Complete ERIC Trend Analysis ➞ | |
 | ADBE Adobe Inc. |
| Sector: Technology | |
| SubSector: Application Software | |
| MarketCap: 157868 Millions | |
| Recent Price: 473.12 Smart Investing & Trading Score: 30 | |
| Day Percent Change: -0.93% Day Change: -4.44 | |
| Week Change: -0.93% Year-to-date Change: -20.7% | |
| ADBE Links: Profile News Message Board | |
| Charts:- Daily , Weekly | |
| Add ADBE to Watchlist: View: Get Complete ADBE Trend Analysis ➞ | |
 | KC Kingsoft Cloud Holdings Limited |
| Sector: Technology | |
| SubSector: Software Application | |
| MarketCap: 98487 Millions | |
| Recent Price: 3.13 Smart Investing & Trading Score: 81 | |
| Day Percent Change: -0.95% Day Change: -0.03 | |
| Week Change: -0.95% Year-to-date Change: -17.3% | |
| KC Links: Profile News Message Board | |
| Charts:- Daily , Weekly | |
| Add KC to Watchlist: View: Get Complete KC Trend Analysis ➞ | |
 | MTCH Match Group, Inc. |
| Sector: Technology | |
| SubSector: Internet Information Providers | |
| MarketCap: 14655.8 Millions | |
| Recent Price: 31.57 Smart Investing & Trading Score: 23 | |
| Day Percent Change: -0.99% Day Change: -0.32 | |
| Week Change: -0.99% Year-to-date Change: -13.5% | |
| MTCH Links: Profile News Message Board | |
| Charts:- Daily , Weekly | |
| Add MTCH to Watchlist: View: Get Complete MTCH Trend Analysis ➞ | |
 | ASML ASML Holding N.V. |
| Sector: Technology | |
| SubSector: Semiconductor Equipment & Materials | |
| MarketCap: 102565 Millions | |
| Recent Price: 908.27 Smart Investing & Trading Score: 51 | |
| Day Percent Change: -1.16% Day Change: -10.70 | |
| Week Change: -1.16% Year-to-date Change: 20.0% | |
| ASML Links: Profile News Message Board | |
| Charts:- Daily , Weekly | |
| Add ASML to Watchlist: View: Get Complete ASML Trend Analysis ➞ | |
 | BIGC BigCommerce Holdings, Inc. |
| Sector: Technology | |
| SubSector: Software Application | |
| MarketCap: 47587 Millions | |
| Recent Price: 5.83 Smart Investing & Trading Score: 35 | |
| Day Percent Change: -1.19% Day Change: -0.07 | |
| Week Change: -1.19% Year-to-date Change: -40.1% | |
| BIGC Links: Profile News Message Board | |
| Charts:- Daily , Weekly | |
| Add BIGC to Watchlist: View: Get Complete BIGC Trend Analysis ➞ | |
 | ADSK Autodesk, Inc. |
| Sector: Technology | |
| SubSector: Technical & System Software | |
| MarketCap: 36975.8 Millions | |
| Recent Price: 215.28 Smart Investing & Trading Score: 18 | |
| Day Percent Change: -1.22% Day Change: -2.65 | |
| Week Change: -1.22% Year-to-date Change: -11.6% | |
| ADSK Links: Profile News Message Board | |
| Charts:- Daily , Weekly | |
| Add ADSK to Watchlist: View: Get Complete ADSK Trend Analysis ➞ | |
 | ANSS ANSYS, Inc. |
| Sector: Technology | |
| SubSector: Application Software | |
| MarketCap: 19497.4 Millions | |
| Recent Price: 329.62 Smart Investing & Trading Score: 38 | |
| Day Percent Change: -1.24% Day Change: -4.13 | |
| Week Change: -1.24% Year-to-date Change: -9.2% | |
| ANSS Links: Profile News Message Board | |
| Charts:- Daily , Weekly | |
| Add ANSS to Watchlist: View: Get Complete ANSS Trend Analysis ➞ | |
 | SAP SAP SE |
| Sector: Technology | |
| SubSector: Application Software | |
| MarketCap: 129635 Millions | |
| Recent Price: 183.74 Smart Investing & Trading Score: 48 | |
| Day Percent Change: -1.31% Day Change: -2.44 | |
| Week Change: -1.31% Year-to-date Change: 18.9% | |
| SAP Links: Profile News Message Board | |
| Charts:- Daily , Weekly | |
| Add SAP to Watchlist: View: Get Complete SAP Trend Analysis ➞ | |
 | ORCL Oracle Corporation |
| Sector: Technology | |
| SubSector: Application Software | |
| MarketCap: 164530 Millions | |
| Recent Price: 115.66 Smart Investing & Trading Score: 44 | |
| Day Percent Change: -1.32% Day Change: -1.55 | |
| Week Change: -1.32% Year-to-date Change: 9.7% | |
| ORCL Links: Profile News Message Board | |
| Charts:- Daily , Weekly | |
| Add ORCL to Watchlist: View: Get Complete ORCL Trend Analysis ➞ | |
 | ABNB Airbnb, Inc. |
| Sector: Technology | |
| SubSector: Internet Content & Information | |
| MarketCap: 86237 Millions | |
| Recent Price: 162.02 Smart Investing & Trading Score: 64 | |
| Day Percent Change: -1.35% Day Change: -2.21 | |
| Week Change: -1.35% Year-to-date Change: 19.0% | |
| ABNB Links: Profile News Message Board | |
| Charts:- Daily , Weekly | |
| Add ABNB to Watchlist: View: Get Complete ABNB Trend Analysis ➞ | |
 | MSFT Microsoft Corporation |
| Sector: Technology | |
| SubSector: Business Software & Services | |
| MarketCap: 1154150 Millions | |
| Recent Price: 400.73 Smart Investing & Trading Score: 36 | |
| Day Percent Change: -1.38% Day Change: -5.59 | |
| Week Change: -1.38% Year-to-date Change: 6.6% | |
| MSFT Links: Profile News Message Board | |
| Charts:- Daily , Weekly | |
| Add MSFT to Watchlist: View: Get Complete MSFT Trend Analysis ➞ | |
 | ACN Accenture plc |
| Sector: Technology | |
| SubSector: Information Technology Services | |
| MarketCap: 106627 Millions | |
| Recent Price: 303.70 Smart Investing & Trading Score: 10 | |
| Day Percent Change: -1.40% Day Change: -4.31 | |
| Week Change: -1.4% Year-to-date Change: -13.5% | |
| ACN Links: Profile News Message Board | |
| Charts:- Daily , Weekly | |
| Add ACN to Watchlist: View: Get Complete ACN Trend Analysis ➞ | |
 | JD JD.com, Inc. |
| Sector: Technology | |
| SubSector: Internet Information Providers | |
| MarketCap: 59907.3 Millions | |
| Recent Price: 29.87 Smart Investing & Trading Score: 100 | |
| Day Percent Change: -1.55% Day Change: -0.47 | |
| Week Change: -1.55% Year-to-date Change: 3.4% | |
| JD Links: Profile News Message Board | |
| Charts:- Daily , Weekly | |
| Add JD to Watchlist: View: Get Complete JD Trend Analysis ➞ | |
 | FROG JFrog Ltd. |
| Sector: Technology | |
| SubSector: Software Application | |
| MarketCap: 62287 Millions | |
| Recent Price: 41.34 Smart Investing & Trading Score: 71 | |
| Day Percent Change: -1.55% Day Change: -0.65 | |
| Week Change: -1.55% Year-to-date Change: 19.4% | |
| FROG Links: Profile News Message Board | |
| Charts:- Daily , Weekly | |
| Add FROG to Watchlist: View: Get Complete FROG Trend Analysis ➞ | |
 | TEAM Atlassian Corporation Plc |
| Sector: Technology | |
| SubSector: Information Technology Services | |
| MarketCap: 32265.7 Millions | |
| Recent Price: 176.36 Smart Investing & Trading Score: 0 | |
| Day Percent Change: -1.72% Day Change: -3.09 | |
| Week Change: -1.72% Year-to-date Change: -25.9% | |
| TEAM Links: Profile News Message Board | |
| Charts:- Daily , Weekly | |
| Add TEAM to Watchlist: View: Get Complete TEAM Trend Analysis ➞ | |
 | DDOG Datadog, Inc. |
| Sector: Technology | |
| SubSector: Application Software | |
| MarketCap: 10653.2 Millions | |
| Recent Price: 129.06 Smart Investing & Trading Score: 90 | |
| Day Percent Change: -1.82% Day Change: -2.39 | |
| Week Change: -1.82% Year-to-date Change: 6.3% | |
| DDOG Links: Profile News Message Board | |
| Charts:- Daily , Weekly | |
| Add DDOG to Watchlist: View: Get Complete DDOG Trend Analysis ➞ | |
 | INTC Intel Corporation |
| Sector: Technology | |
| SubSector: Semiconductor - Broad Line | |
| MarketCap: 222357 Millions | |
| Recent Price: 31.29 Smart Investing & Trading Score: 0 | |
| Day Percent Change: -1.85% Day Change: -0.59 | |
| Week Change: -1.85% Year-to-date Change: -37.7% | |
| INTC Links: Profile News Message Board | |
| Charts:- Daily , Weekly | |
| Add INTC to Watchlist: View: Get Complete INTC Trend Analysis ➞ | |
| For tabular summary view of above stock list: Summary View ➞ 0 - 25 , 25 - 50 , 50 - 75 , 75 - 100 , 100 - 125 , 125 - 150 , 150 - 175 , 175 - 200 | ||
| Click To Change The Sort Order: By Market Cap or Company Size Performance: Year-to-date, Week and Day | |
| Select Chart Type: | ||
|
Best Stocks Today 12Stocks.com |
© 2024 12Stocks.com Terms & Conditions Privacy Contact Us
All Information Provided Only For Education And Not To Be Used For Investing or Trading. See Terms & Conditions


One More Thing ... Get Best Stocks Delivered Daily!
Never Ever Miss A Move With Our Top Ten Stocks Lists
Find Best Stocks In Any Market - Bull or Bear Market
Take A Peek At Our Top Ten Stocks Lists: Daily, Weekly, Year-to-Date & Top Trends
Find Best Stocks In Any Market - Bull or Bear Market
Take A Peek At Our Top Ten Stocks Lists: Daily, Weekly, Year-to-Date & Top Trends
Technology Stocks With Best Up Trends [0-bearish to 100-bullish]: Bakkt [100], Koninklijke Philips[100], GDS [100], Ouster [100], Baidu [100], Impinj [100], Skyworks [100], Teradyne [100], MACOM [100], Liberty Latin[100], America Movil[100]
Best Technology Stocks Year-to-Date:
MicroCloud Hologram[584.89%], Bakkt [355.16%], MediaCo Holding[277.93%], Super Micro[213.88%], Uxin [182.45%], Smith Micro[179.66%], CXApp [171.04%], SoundHound AI[113.79%], NextNav [111.12%], MicroStrategy [103.37%], CuriosityStream [99.96%] Best Technology Stocks This Week:
Bakkt [2439.4%], Koninklijke Philips[26.48%], Velo3D [14.96%], uCloudlink [14.6%], Phoenix New[12.57%], 2U [11.86%], 21Vianet [10.13%], Cogint [9.63%], GDS [9.47%], Uxin [8.79%], Xperi [8.64%] Best Technology Stocks Daily:
Bakkt [2439.40%], Koninklijke Philips[26.48%], Velo3D [14.96%], uCloudlink [14.60%], Phoenix New[12.57%], 2U [11.86%], 21Vianet [10.13%], Cogint [9.63%], GDS [9.47%], Uxin [8.79%], Xperi [8.64%]